In-Medium Spectral Function Study via the 2H, 3He, 12C Reaction
Abstract
We report a helicity analysis of sub-threshold production on 2H, 3He and 12C at low photo-production energies. The results are indicative of a large longitudinal polarization (, ) and are consistent with a strong helicity-flip production mechanism. This signature is used to extract in-medium invariant mass distributions for all three nuclei in a manner which is less model-dependent than previous measurements. The results are compared to kinematic and phenomenological models of the spectral function. The 2H and 3He data distributions support the role of excitation in shaping the in-medium invariant mass distribution, while the 12C distributions are consistent with quasi-free production. The data support an in-medium modification of the invariant mass distribution.
pacs:
13.60.Le, 25.20.Lj, 14.40.Cs, 12.40 YxI Introduction
Of all particles, the -meson has received the most attention with regard to medium modifications. Since the carries the quantum numbers of the conserved vector current, its properties are related to chiral symmetry, and can be investigated with a variety of models. Most models predict a reduction of the renormalized vector meson mass in the nuclear medium. A review of the field, up to 1999, is given in Ref. Li99 . One of the first models was “Brown and Rho scaling” Br91 , in which the in-medium mass is rescaled according to the relation
This relation is based on chiral symmetry and scale invariance, and predicts that the mass of the should drop by from its free mass value at standard nuclear density. This is supported by Lattice QCD calculations Ji95 , which suggest that chiral symmetry will be fully restored at MeV and/or .
In addition to mass rescaling, the in-medium shape of the may be changed by resonant interactions. One well-known model of these interactions is that of Rapp, Chanfray, and Wambach Ra97 . Here, the strong coupling of the with states in the nuclear medium, and -baryon scattering, lead to a series of “rhosobar” excitations. This results in an enhancement of the low invariant mass portion of the spectral function. This model has been applied to the high temperature and high density regime of high energy heavy ion collisions with great success. This picture has been refined and extended by other groups in recent years, such as the relativistic-model calculation by Post, Leupold and Mosel Po01 . These and other models will be discussed in more detail later in the paper.
Experimental evidence for in-medium mass modification has been widespread, but all interpretations suffer from significant model uncertainties. For example, CERN dilepton production data from S+Au and S+W collisions at 200 GeV/u yield a significant enhancement at low CERES , indicative of a density-dependent mass reduction which is consistent with chiral symmetry restoration as well as with -medium rescattering. An IUCF 28SiSi polarization transfer experiment found an effective isovector interaction strength consistent with MeV/c2 St97 , and a KEK 12 GeV collision experiment yielded spectra which indicate a significant enhancement for Cu which is not present for 12C, consistent with MeV/c2 mass shift Oz01 , but these both suffer ambiguities in interpretation due to the use of a proton probe. Frascati total photo-absorption cross sections on C, Al, Cu, Sn, Pb at 0.5-2.6 GeV are smaller than expected, indicative of increased shadowing. These results are best explained in terms of a reduced in-medium mass, MeV/c2, which increases the coherence length bianchi . However, due to the inclusive nature of the experiment, this can only be considered an indirect observation of in-medium properties.
Finally, the TAGX Collaboration has investigated the reaction in the sub-threshold region. In this case, diffractive production is suppressed, as the reaction must utilize Fermi momentum to produce a . The resulting ’s are produced with low boost with respect to the nuclear medium, so that they decay within 1 fm of their production point (i.e. still within even a small nucleus). These two properties of the sub-threshold region reaction enhance the nuclear-medium effect. The effects of final state interactions (FSI) are minimized by the choice of a small nucleus (3He). An energy-dependent mass reduction MeV/c2 was found for MeV Lo98 ; Ka99 ; Ma00 , with evidence for even lower mass at lower photon energy Hu98 . Of these, Ref. Ma00 used an analysis technique significantly different than Refs. Lo98 ; Ka99 , and yielded nearly the same value. A limitation of these results is the model-dependent separation of the channel from other processes leading to the state. Experimental data which can be interpreted in a less model-dependent fashion are highly desirable, and this is the goal of the study reported here.
A technique which may allow a cleaner separation of the contribution from competing processes has recently been reported by the TAGX Collaboration Lo02 . There, the decay angular distribution is reconstructed for sub-threshold 2H and 12C reaction data, and it is found that when kinematic cuts which enhance the relative population of decay compared to competing processes, such as production, are applied to the data, a strong cos distribution results. The only mechanism compatible with the features of the data is the decay of longitudinally polarized , consistent with a strong helicity-flip mechanism of production. This result forms the motivation for this work. Such helicity-flip amplitudes are interesting, because they may be related to the production mechanism and so assist in such investigations. Here, the emphasis is placed on the use of the longitudinal polarization of the to isolate its contribution to the data, with the goal being to extract the in-medium line shape and compare it to various phenomenological models. A preliminary analysis using this technique was presented in Ref. Hu02 and this work presents our final results and conclusions for 2H, 3He and 12C.
The deuteron comprises an important element in the investigation of medium modifications. Its low Fermi momentum and nuclear matter density reduce the probability of medium modifications and/or nucleonic effects. However, the low binding energy and the better defined final states for Monte Carlo (MC) simulations also make the deuteron an attractive test case for comparisons with data and with the free line shape. 12C is a “benchmark” test of nuclear modifications, because of its combination of nuclear size and density. Unlike the simpler targets, the number of nucleons present in 12C raise potential complications due to FSI, including absorption. The effects of such FSI will be investigated in detail later in this paper. 3He may be expected to represent the “nuclear” aspects of 12C with the simplicity of 2H, as far as FSI and pion absorption corrections are concerned. The low relative -N and He momenta of this experiment largely compensate for the short nuclear radius disadvantage, compared to more massive nuclei, by increasing the probability of decay within the nuclear volume Ka99 .
This paper is organized in eight sections. In Sec. II, the experiment setup and analysis procedure are reviewed. Sec. III discusses the MC simulations and presents representative characteristics of the reaction channels considered. Sec. IV compares the data distributions with the MC simulation results, with particular emphasis on the effects of the kinematic cuts on the observed helicity angle distributions. In Sec. V, the helicity analysis is used to quantify and subtract the proportion of non- events surviving the kinematic cuts, yielding the experimental in-medium invariant mass distributions. Sec. VI compares the experimental distributions to a series of model calculations, and Sec. VII compares the helicity angle analysis result to the previous TAGX Collaboration results. Finally, in Sec. VIII the discussion and conclusions are presented.
II Experiment and Data Analysis
The analysis presented here is based on data taken in three separate running periods Wa97 ; Ka99 ; Lo02 . Together, they comprise data with 2H, 3He and 12C targets. The experiments were carried out using the tagged photon beam of the 1.3-GeV Electron Synchrotron (ES) at the Institute of Nuclear Study at Tokyo (INS) and the TAGX magnetic spectrometer.
II.1 Tagged photon beam
The photon beam is produced utilizing the 1.3 GeV Tokyo Electron Synchrotron with a duty factor of 10% Yoshida ; Mar96 . Figure 1 displays the tagged photon energy distributions used in this work. As the data for the different targets were obtained at different times, and under slightly different experimental conditions, the shapes of the resulting tagged photon energy spectra are significantly different for the 3He and CD2 targets. The 3He target data are from Refs. Ka99 and Wa97 , which used ES nominal energies of 800 and 1220 MeV, respectively. The CD2 target data were taken with three ES energies of 1040, 1180 and 1200 MeV, with overlapping tagged photon energy distributions.
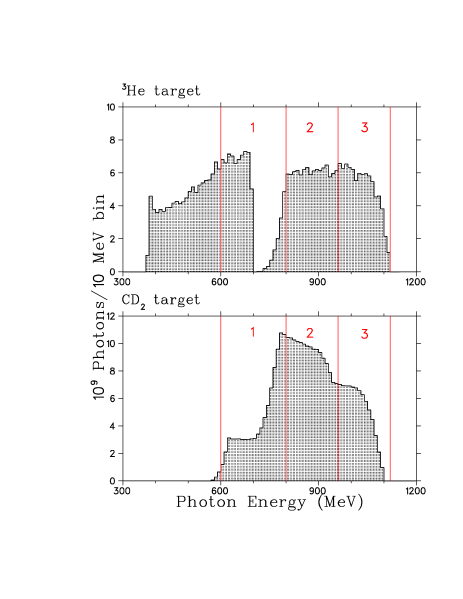
The data were divided into three tagged photon energy bins of 600-800 MeV, 800-960 MeV, and 960-1120 MeV. The choice of the limits of these bins was motivated by the photon energy thresholds for production via the quasi-free and non-quasi-free mechanisms in nuclei. On 1H, the threshold for production of with mass one lower than the nominal 770 MeV/c2 (i.e. 705 MeV/c2), is 971 MeV. The division between the mid- and high-energy photon bins is placed near here, and so the highest photon energy bin is expected to receive a significant contribution from quasi-free production on all three targets. On 12C, the corresponding photo-production threshold is 723 MeV, while for the centroid it is 797 MeV. This motivates the division between the low- and mid-energy bins to be 800 MeV. In this case, the middle photon energy bin may contain contributions from the low-mass components of the (more than one below mean) in a quasi-free production mechanism, as well as nominal production from the nucleus as a whole. The mid-energy bin also has the best photon luminosity and event statistics for all three nuclear targets. The lowest photon energy bin is deeply sub-threshold and so will be the most sensitive to low-mass components of the in a nuclear environment. However, at these low energies the production cross-section is small, and any interpretation of the data will be complicated by significant phase-space restrictions and non- contributions.
II.2 Targets
The 3He data were obtained with the use of a cryogenic liquid target of 5 cm diameter and 0.0786 density tgt3he . This necessitated an empty-target background subtraction procedure, explained in Ref. Ka99 . The 2H and 12C data were obtained together, via the use of a solid deuterated polyethylene and research grade graphite target assembly. The graphite target (0.069 g/cm2) was positioned at the nominal center of the TAGX magnetic field, with two deuterated polyethylene targets (total thickness 0.618 ) flanking it upstream (-16.8 mm) and downstream (+15.8 mm) relative to the photon beam. The 2H data were obtained by subtraction of the graphite target data from the CD2 target data, via the procedure discussed in section II.6.
II.3 TAGX spectrometer
The TAGX spectrometer has an acceptance of sr for charged particles. It consists of a dipole magnet (5 kG), drift chambers for tracking, and plastic scintillation counters for time-of-flight (TOF) and trigger information. Fig. 2 displays the layout of the TAGX system for the 2H and 12C measurements. A brief description of the detectors follows. An extended description of the TAGX spectrometer is found in Ref. Mar96 .

Directly surrounding the target is the inner hodoscope (IH), made of two sets of six scintillator counters, one on each side of the beam. The IH is used in the trigger, as well as in measuring the time of flight (TOF) of the outgoing particles Mar96 ; Gar97 .
Next are the two straw tube drift chambers (SDC), located on opposite sides of the beam. Their operation greatly improves the vertex resolution capability of the system, which aids in the suppression of experimental background. The SDC were designed to preserve the TAGX -sr acceptance prior to its installation, to not impose extensive modifications of the spectrometer, and to not induce significant energy losses to traversing particles by keeping its thickness to minimum. The SDC is explained in detail in Ref. Gar97 .
Surrounding the SDC are two semi-circular cylindrical drift chambers (CDC), subtending angles from 15∘ to 165∘ on both sides of the beam in the horizontal plane, and 18.3∘ in the vertical plane. Together with the SDC, they are used to determine the planar momentum and in-plane emission angle of the traversing charged particles, and the vertex position of the trajectory crossings.
The outer hodoscope (OH) is a set of 33 scintillator elements placed after the CDC. Each scintillator is oriented vertically, with PMT’s attached at top and bottom to determine the track angle relative to the median plane. The two sets of hodoscopes, IH and OH, measure the TOF of the tracked particles.
Finally, for the 2H and 12C data taking a pressurized CO2 C̆erenkov detector was added to further improve the suppression of beam-related electromagnetic (EM) background. The gas pressure was slightly higher than atmosphere, resulting in an electron threshold of 17 MeV/c. An aerogel C̆erenkov counter with was located at backward angle on beam right. The pion threshold for this detector was 570 MeV/c. Because of their proximity to the TAGX magnetic field, neither detector was used in the on-line trigger decision.
The remaining components of the TAGX spectrometer are four 155 mm 50 mm 5 mm scintillator counters, with a primary function to veto background. These veto counters are positioned along the OH arms in the median plane, and eliminate charged-particle tracks registering within 2.5 mm, mostly affecting forward-focused pairs produced copiously downstream of the target, but having a small effect on events.
II.4 Event reconstruction
As our interest lay with production from the decay of the meson, the experiment trigger was set up to record two-charged particle coincidences on opposite sides of the beam axis.
The reconstruction of the TAGX data is briefly reviewed here; a detailed account is in Ref. Mar96 . In the analysis, a lab system of co-ordinates was used, in which the -axis is taken to be along the direction of the photon beam and the -axis is taken along the TAGX magnetic field. The trajectory of a charged particle reconstructed by the SDC+CDC drift chamber system defined the horizontal component of the momentum, , the horizontal tracked trajectory length, , and the tangential direction of the track in the horizontal plane, . The resulting planar momentum resolution is given by the relation Sh02 .
The timing difference of the PMT’s mounted on both ends of each OH scintillator gave the the -component of the hit position, which measured the trajectory length along the -axis (), and allowed the magnitude of the momentum in three dimensions to be calculated. The out-of-plane trajectory length resolution was approximately cm. The resulting three dimensional momentum resolution is dominated by , above.
The information from each of the two tracks is combined to provide the vertex position of each event in the plane. The SDC+CDC traceback resolution is 1.0 mm () Sh02 .
II.5 Particle Identification
Fig. 3 shows the observed correlation between the three dimensional momentum and the TOF between the IH and OH. Particle identification boxes were created as shown in the figure to select pions and protons for further analysis. This method does not allow () to be cleanly separated from () because of the limitation set by the timing resolution. Therefore, in the case of the CD2 experiment, TDC information from the forward gas C̆erenkov detector was used to additionally suppress the background. The aerogel C̆erenkov detector suffered from poor gain due to the TAGX magnetic field, and was not used in the analysis.

Events were only kept if a and a were detected on opposite sides of the beam-line, a requirement consistent with the experiment trigger. Because of the larger probability of one or more protons from the 12C target also intercepting the spectrometer, events in which a proton was detected in addition to the left-right-going pair were also accepted for the CD2 experiment, only. events meeting this condition comprised 6% of the CD2 target event sample. “Three track” events with a pair detected on the same side of the beam-line were excluded from further analysis in all cases.
II.6 Background Subtraction and Target Separation
For the 3He experiment, the cryogenic target was housed in a low-mass target cell with 185 m thick mylar walls, a mylar-aluminum laminate super-insulator, and a 50 m thick aluminum radiation shield tgt3he . This necessitated the use of dedicated empty-target cell data acquisition runs, for the purpose of background subtraction. The result of the 3He empty-target cell subtraction is shown in Ref. Ka99 .
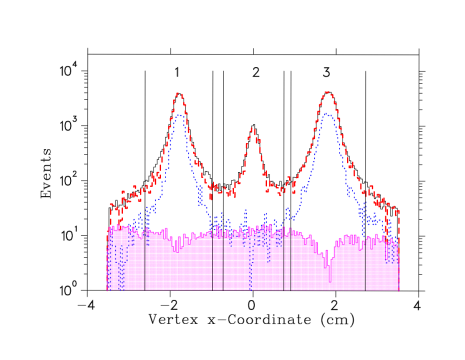
Dedicated empty-target subtraction runs were not necessary for the CD2 experiment, as no target container was used. In this case, the vertex position provided the means to identify whether the event originated from the graphite target, the deuterated polyethylene target, or elsewhere. Monte Carlo (MC) simulations incorporating the known target densities and positions, and taking into account the variation of the traceback resolution upon the two-track opening angle and the TAGX tracking resolution, were normalized to the data to provide the target subtraction parameters to extract the 2H data from the CD2 target yield. Fig. 4 compares the -coordinate distribution of the data to the sum of three MC simulations, in which the production was from either 2H, 12C, or the atmosphere between the solid targets. The inferred contributions of each source to the events within each target box shown in Fig. 4 are listed in Table 1.
| Box # | Observed Events | 2H | 12C | Air (1 atm) | Sum |
|---|---|---|---|---|---|
| 1 | 38487 | 39% | 59% | 1% | 99% |
| 2 | 9484 | 5% | 85% | 5% | 95% |
| 3 | 49873 | 38% | 61% | 1% | 100% |
The three simulations provide an excellent description of the CD2 target regions, and a poorer but still acceptable description of the natC target region. In all three cases, the level of agreement is within the 5% systematic uncertainty in the MC simulation of the detector, and so it was concluded that it was not necessary to add an arbitrary background source to describe the target traceback data. After application of a correction to account for the variation in TAGX acceptance with -coordinate (values 1.06 and 0.87 for Boxes 1 and 3 relative to Box 2), the Box 2 data were subtracted from the Box 1 and Box 3 data to yield the 2H event sample. As air is predominantly N and O, which will be nearly indistinguishable from 12C in the physics analysis, the decision was made to take all of the events within Box 2 as the 12C event sample.
III Monte Carlo Simulations
The MC simulations constitute an integral part of the analysis, as they provide the best means to take into account the effect of the limited experimental acceptance upon the observed data distributions. A detailed comparison of the observed data distributions with those predicted by the MC simulations will help determine the kinematic regions populated by the respective reaction channels, and how best to separate their contributions. Two key observables in this comparison are the lab frame pion-pion opening angle () and the missing mass (). It is necessary for us to investigate the effects of analysis cuts on these two variables and any possible inter-dependence between them. Finally, it is important to show that the cuts suppress non- background in an understood fashion and that they do not induce distortion in the spectra that can imitate the signature of a longitudinally polarized .
III.1 production channels considered
III.1.1 production
We first discuss the production generator. production was assumed to occur via a quasi-free mechanism, where is the participating struck proton with initial Fermi momentum and the remainder of the nucleus is a spectator. Several different line-shapes Est74 ; Be93 ; Bu96 ; Be98 ; pdg were considered in the simulations. While they all yield very similar results, all simulations shown here use the line-shape of Benayoun et al. Be93 unless specified otherwise. This line-shape is based on the partial-wave analysis (PWA) of data from to 1000 MeV/c2, and so is the most authoritative description of the free low mass tail 111Ref. Be98 by the same authors is based on the same data, and yields a nearly identical line-shape.. The then proceeded to decay into a pair. For the simulations assuming longitudinally polarized production, the decay distribution was weighted by cos in the rest frame; for unpolarized production the decay distribution was taken to be isotropic.
III.1.2 production
Quasi-free production and its decay is included as a representative scalar process with Breit-Wigner width and centroid as listed in Ref. pdg 222The actual values used are MeV/c2 and MeV/c2, which are in the middle of the range given for the .. This decay is isotropic in the rest frame and it is a vital test to investigate whether any cut-induced -like signatures appear in the MC simulations.
III.1.3 Baryon resonances
For the baryon resonances, we follow the work of Refs. Lo98 ; Hu98 ; Ka99 , where a variety of other reaction channels leading to were identified and simulated. Thus, quasi-free reactions leading to the production of , , , and were considered here. The line-shapes of the baryon resonances were assumed to be described by Breit-Wigner distributions with centroids and widths taken from Ref. pdg , while the shape of the from decay uses the PWA shape from Be93 . In addition, production was simulated in a mechanism, where was a spectator recoiling in some excited state with the appropriate Fermi momentum.
As only quasi-free mechanisms have been simulated, cuts must be placed on both the experimental data and the MC simulated data to exclude regions populated by more complicated reaction mechanisms involving additional nucleons or those producing three or more pions. is the lowest mass mechanism involving more than one target nucleon which leads to the final state, and so it serves as an important test case. Any kinematic cuts which eliminate the process should be even more effective at eliminating yet more complicated multi-nucleon mechanisms.
The single-nucleon Fermi momentum distributions in the quasi-free simulations were chosen appropriate to each respective target nucleus. For 2H, a parametric fit to the 2H data of Bernheim et al. Bern81 by A. Saha Saha was used. For 3He, a parameterization from a variational calculation using the Argonne potential Sch86 for the 2-body breakup 3He was used. For 12C, the PWIA parameterizations of J.W. van Orden VanO for the and shells of 16O was used, and the recoil nucleus was placed in the corresponding excited state. The remaining nucleon or nucleus, as the case may be, was assumed to be a spectator recoiling with equal and opposite momentum to the reaction product.
III.1.4 final state interactions (FSI)
For all processes leading to production in the MeV energy range, the emitted pions are in the resonant energy region and pion re-scattering, as well as absorption, have large cross sections. Although FSI in the form of absorption may play a role in the extraction of the final invariant mass distribution and will be discussed in more detail later, re-scattering is of particular concern because helicity signatures are used to extract the content, to assign confidence levels and to define the actual background shapes and strengths to be subtracted from the data. While one can argue that for 2H and 3He re-scattering FSI should be a small contribution, their effect can not be ignored in the case of 12C. For the sub-threshold region considered here, our simulations indicate a mean CM momentum of 230 MeV/c, which yields an approximate 50% probablity that one of two originating in the center of a uniform density nucleus with the radius of 12C will undergo re-scattering.
Therefore, a series of MC simulations were made in which a pion was randomly selected to scatter with a proton, , where the pion initial energy and angle are from the production and decay MC generator, and the nucleon has appropriate Fermi momentum for 12C. The representative processes for which FSI were studied were quasi-free production, production via decay, and . The amplitudes are taken from the phase shift analysis parameterization of Ro78 .
The effect of absorption FSI on the line-shape was also considered. In this case, a parameterization of the total pion absorption cross-sections of Ref. Ash86 and Jon93 was used to calculate the absorption probability as the pion traveled from some random point inside a uniform density sphere with radius of 12C to the exterior. Inelastic processes such as pion induced pion production were not considered since the cut will eliminate them.
In all cases, the simulated particles were transported through the detection apparatus using GEANT geant . The TAGX detector performance evaluated in the event reconstruction process was utilized to accurately simulate the TAGX detection efficiency and to reproduce the experimental resolution. All experimental thresholds and acceptance cuts were applied, and the simulated data were analyzed in the same manner as the experimental data.
III.2 Representative characteristics of the reaction channels
Figure 5 shows representative kinematic distributions from four MC simulations with the 3He target and for the 800-960 MeV tagged photon energy range. The observables plotted are the missing mass , the di-pion invariant mass , the lab frame opening angle , and, of particular importance to this work, the helicity angle , calculated in the di-pion rest frame in the following manner:
-
1.
the longitudinal component of the momentum with respect to in the lab frame is formed.
-
2.
both and are transformed to the center of mass frame.
-
3.
is then calculated from
The 3He nucleus was chosen for a detailed discussion on the effects of the cuts on the MC simulations for a number of reasons. First, 3He exhibits features common to all three nuclei and most of the conclusions drawn from its analysis apply to the other two. Second, there are previously published works on the same target, but based on a different analysis methodology, that this work can be directly compared to. Third, the data quality and statistics (for the MC simulations to be compared to) are good, and this improves the reliability of any conclusions made. The and simulations are selected as representative baryonic non- processes and the simulation is a representative mesonic simulation which will mimic a in all respects except for the helicity signature.
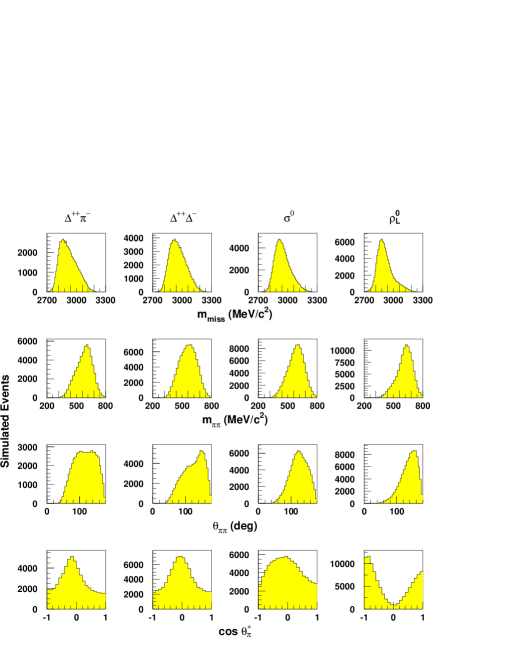
The , and simulations make use of a quasi-free mechanism, as evident by their very similar missing mass distributions, indicating the escape of a single, energetic nucleon. The simulation involves two energetic nucleons, and so its distribution peaks at slightly higher missing mass. For the remainder of the discussion, only events with missing mass between 2629 and 2919 MeV/c2 were accepted for further analysis. The upper limit of range is placed at 110 MeV excitation energy of the residual nuclear system and so will be referred to as the MM110 missing mass cut. It will eliminate all 3 production processes. The value of the lower limit is not critical, and is placed well below the 3He ground state.
The quasi-free and processes have similar lab-frame opening angle distributions, as each rely on back-to-back decay in the meson rest frame. The and processes have significantly more strength in the region, and this is characteristic of baryonic decay into non- channels. The cutoff in the distributions for is due to the experimental requirement of two detected tracks on opposite sides of the photon beam-line.
The bottom row of Fig. 5 shows the respective helicity angle distributions of the four processes. Even though the angular distribution is intrinsically isotropic in cos due to its nature, once all experimental considerations are taken into account the resulting distributions are not isotropic. The decay of a longitudinally polarized is the only process which produces a cos-like signature. The 30% forward-backward asymmetry in the simulated distribution, and the fact that the distribution maximum is not quite at , are understood effects of the TAGX acceptance.
III.2.1 Investigation of the effects of the and cuts
The purpose of this section is to observe the effect the missing mass and opening angle cuts have upon the simulated cos distributions. The latter form the basis of the extraction of the yields and distribution from the data.
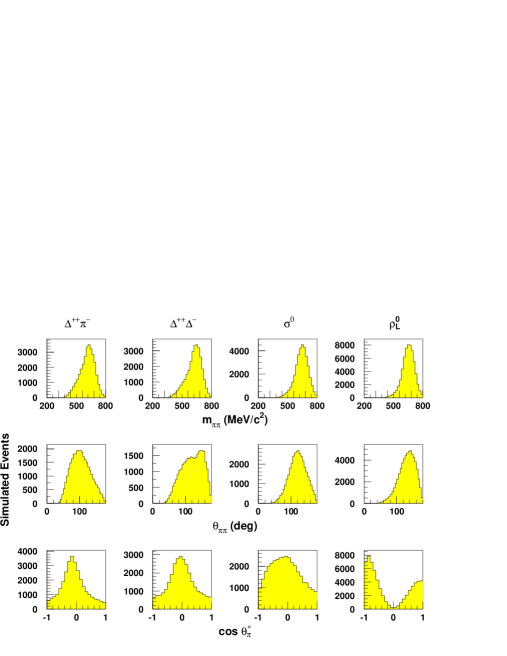
Fig. 6 shows the same MC simulations as in Fig. 5 after application of the MM110 missing mass cut. As expected, the removal of the high missing mass events has depopulated the low region, and so each of the respective invariant mass distributions have shifted sightly upward in mass. The opening angle distribution of the simulation has shifted to lower values of . This is a desirable effect, as it will cause the addition of the opening angle cut to be more effective in reducing the contribution of this very important process from the data. The effect of the MM110 cut upon the other opening angle distributions is much smaller. Finally, we see that the effect of this cut upon the helicity angle distributions is small.
Helicity angle distributions for the same four simulations are shown in Fig. 7, this time with the application of a series of opening angle cuts of increasing tightness. The cut is shown for comparison to the previously reported results of Ref. Ka99 .
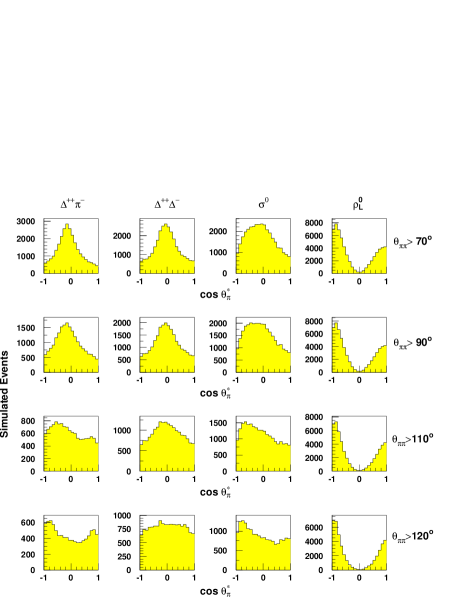
One striking observation, by comparing Figs. 5 and 7, is the effectiveness of the two cuts in suppressing non- processes such as and . The difference in the -axis scale of each figure gives a rough measure of the effectiveness of the corresponding cuts. The combination of the MM110 missing mass cut and the cut reduced the , and processes by factors of 6.2, 5.2 and 5.0, respectively, while reducing yield by only a factor of 2.4. These factors are in addition to the inherent selectivity of the TAGX spectrometer to coplanar processes such as decay. The TAGX limited out-of-plane acceptance discriminates against two-step production processes and uncorrelated production when forming the experiment trigger. This combination of favorable spectrometer acceptance and analysis cuts accounts for the experiment’s ability to extract a signal with small cross-section out of a comparatively large background. Depending on the production processes compared, the relative enhancement of signal can be as much as a factor of ten.
The next observation to be made from Fig. 7 is that only the simulation produces a strong -wave signature. It is clear that an opening angle cut as tight as cannot artificially induce a cos distribution in any production process. In the row, while the simulated distribution is featureless, one may argue that some biasing of the distributions is evident in the and channels. While these two distributions do not resemble a -wave, they do indicate that some population at the extremes of the cos distributions can be accounted for by non- decay and that care, as well as some additional criteria, may be necessary to separate from non- processes. Nonetheless, for , no background process can create the “edge-to-center” ratios that decay exhibits. In fact, the population at the center of the distribution is a measure of the non- contributions and can be used as an input to further analysis. We also investigated whether the combination of any two simulated processes can mimic the observed distributions. We found that no combination of non- reactions leading to production can reproduce the cos distribution, and the response to and cuts, characteristic of production. Any admixture of together with the other two background channels will only move the distribution further away from being -like.
In conclusion, we see that the and cuts together provide a good means of enhancing the proportion of events in the data. This combination of cuts does not appear to induce a false cos distribution to the data, and if used in concert with the “edge-to-center” ratio of the distribution, can provide a unique means to identify the yield. While the cut appears to be effective, we do not believe it is prudent to cut the data more severely than this. Beyond this point, the degraded statistics of the surviving data and the restricted kinematics caused by the cut become progressively more important factors.
III.2.2 Application of cuts to 2H and 12C simulated data
For the 2H target nucleus, the effects of the two cuts on the cos distributions for the various reaction processes lead to conclusions very similar to those presented for 3He. However, given the more complex nature of 12C, two specific investigations are worth exploring in some detail. One is based on the fact that this nucleus consists of six protons and six neutrons and charge symmetric background processes may have differing distributions, due to triggering requirements. The other is exploring the effects of FSI, an effect that also has its basis on the larger number of nucleons present compared to the other two nuclei.
Fig. 8 shows simulations for three non- channels as well as quasi-free production, both with and without the effect of re-scattering FSI. The upper limit of the missing mass cut applied, MeV/c2, corresponds to 130 MeV excitation of the recoil system, and so is termed the MM130 cut. This higher upper cut value chosen (as opposed to MM110) is to maximize the data statistics, which are more limited for 12C than the other nuclei, while still remaining below production.
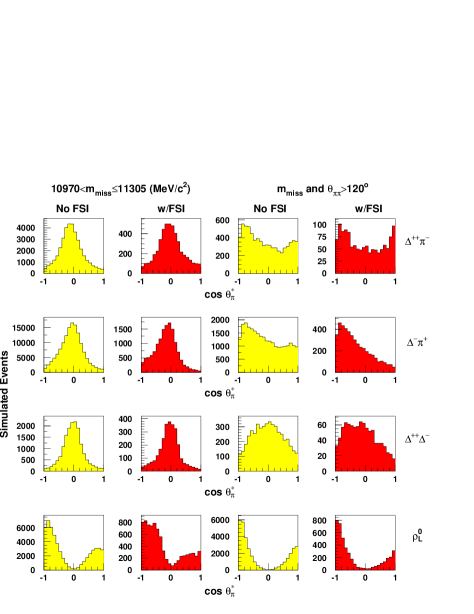
With only the MM130 cut applied, all non- processes exhibit distributions which peak near the center of the cos range. With six protons and six neutrons present, the charge symmetric and reactions should contribute at approximately the same rates. However, the inclusion of re-scattering FSI and the slightly different TAGX acceptances for and may induce a difference between the charge symmetric distributions. Nonetheless, no artificial -wave behavior is seen as a result of the MM130 cut. This cut is also very effective in suppressing processes.
For the non- processes, the application of the cut results in the suppression of yield in the regions between -0.7 and 0.7, and the remaining population about cos is a measure of the total surviving background. All of the simulations in Fig. 8 were run for the same number of simulated TAGX triggers, so the poor statistics for the FSI simulations indicate their low survival probability after the cuts. The mean cut survival probability of FSI processes is less than 25% of that of non-FSI processes, enhancing the expected relative proportion of non-FSI to FSI events in the 12C data by a factor of four. It is interesting to note that the channels exhibit distributions that may be fitted by a function, such as cos cos, that has a -wave component. It is also worth noting that the “skewness” observed for the reaction (forward-backward asymmetry) will give different values for the three coefficients than that expected for the decay process. These aspects of the analysis will be pursued for all three nuclei in a later section of this work.
IV Data distributions and comparisons with MC simulations
In this section, the effects of the two cuts, and , on the data distributions are investigated and detailed comparisons with the MC simulations are made. The objective is to establish the consistency of the conclusions derived from the application of the cuts on the data and the simulations. In subsequent sections in this paper, this will lead to the identification of a component in the experimental data and its extraction and separation from the non- background.
IV.1 The effects of the cuts upon the 3He data
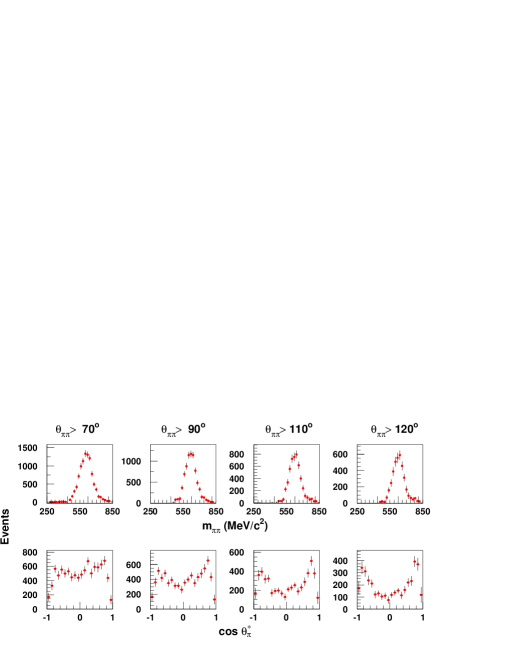
The effect of the cut upon the 3He data distributions for and other variables is shown in Fig. 9. Four successive cut values of and have been applied. The effect of the cut upon is small. There is a shift in the mean of the distribution of approximately 30 MeV/c2 as the cut is changed from to . The low missing mass region is most affected, due to the elimination of two pion events with low relative momenta. The effect on the invariant mass, , is also small. Neither the peak nor the shape of the distributions change appreciably for the four values of cut. The low mass tail of the distribution, below 500 MeV/c2, is affected a little more greatly, resulting in a slightly more symmetric shape for the distribution. Generally, invariant mass distributions for such multi-channel (inclusive) processes are not sensitive variables on their own. This is because they represent phase-space and acceptance limitations compounded with broad and overlapping resonances.
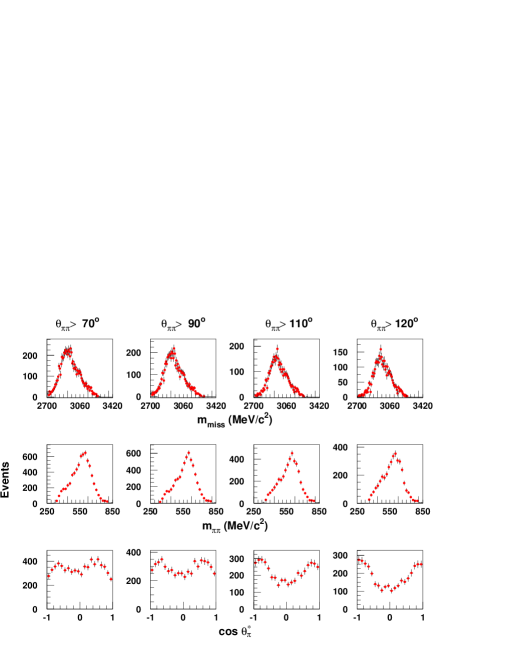
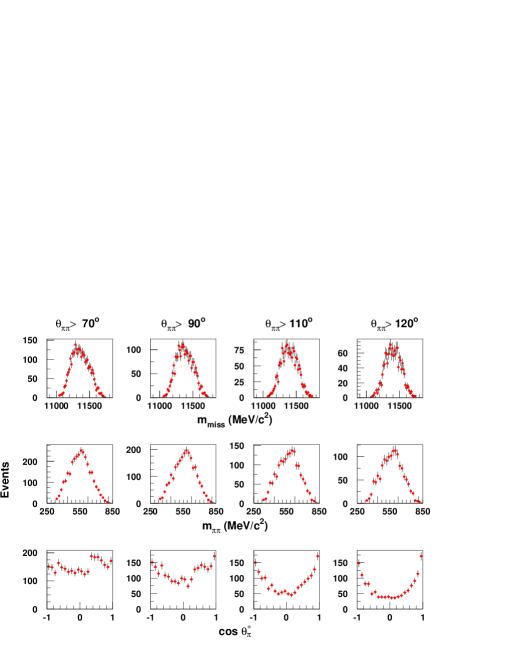
The effect of the MM110 missing mass cut, in addition to the opening angle cut, is shown in Fig. 10. A comparison of Figs. 9 and 10 reveals that the application of the cut has a larger effect on than the cut had alone. By eliminating three pion production and suppressing the emission of energetic nucleons, the missing mass cut helps to isolate two energetic pion events adding up to larger invariant mass. As an example, the peak of corresponding to the cut has shifted from approximately 580 MeV/c2 in Fig. 9 to approximately 665 MeV/c2 in Fig. 10. Similar behavior was observed in Lo02 for 2H. These shifts become a significant factor in the discussion on the invariant mass distribution and comparisons with theoretical models in the relevant sections of this work.
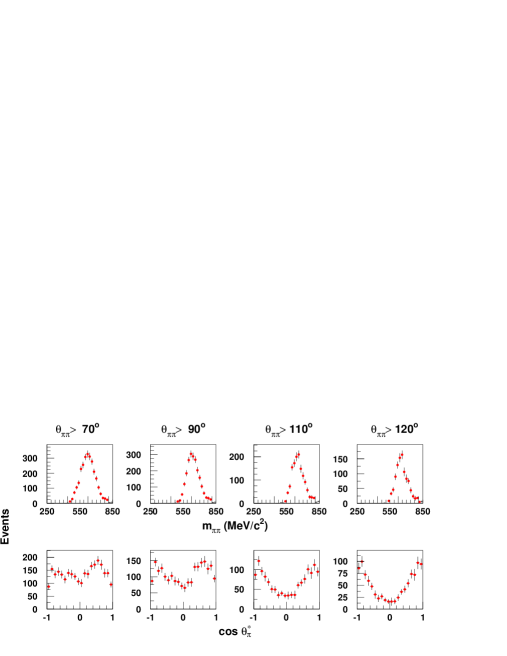
The effect of the opening angle cut upon cos is quite dramatic. The effect of the additional MM110 cut has been to make the resulting cos distribution more symmetric. It is instructive to compare the corresponding cut plots in Figs. 7 and 10. The MC simulations show cos distributions for all background processes that are radically different from the data. Furthermore, no combination of and processes without content can reproduce the shape and change of population of the data in going from the to the cut. The “edge-to-center” ratio is an additional piece of information, as the MC simulations indicate that the bulk of the background processes are located in the “center” region of the cos distribution. Thus, this ratio is a measure of the to non- contributions to the observed data yield, and a comparison of Figs. 9 and 10 indicates that the effect of the cut has been to remove additional non- processes, such as production.
In conclusion, the two kinematic cuts, applied to both data and MC simulations, have been shown to be largely uncorrelated, each selecting different features of the data-set. They help to establish that the only self-consistent process identified as the source of the -wave-like distribution in cos is the decay of a longitudinally polarized . By comparing the ‘edge-to-center’ ratios of the distributions in Figs. 7 and 10, it is clear that the non- background under the cut is minimal. This is established by the MC simulations for the , and processes and the small number of data events at cos. Since this “pedestal” is an accumulation of surviving events from all background processes, it establishes an absolute measure of the contribution of these processes to the data.
One question that arises as a result of the comparison of the simulations and the data is that of helicity conserving or unpolarized content in the data and their signatures in the data and simulations. Both unpolarized and transversely polarized events, the latter with a distribution peaking at zero values of cos, would add to the “pedestal” at the center of the distribution. As such, it is clear that there is little or no evidence for such polarization states of in the data sample. The argument against signatures is particularly strong because such a helicity state would otherwise share all other responses to and cuts with . In this case, increasing the cut limit would result in a central enhancement, an expectation completely in variance with the data.
IV.2 The effects of the cuts upon the 2H data
The 2H data distributions respond to the cuts in a manner similar to those in Fig. 9, except that the distributions show a peak at the deuteron mass with a narrower distribution than the 3He distributions, and the distributions have slightly higher centroids, a manifestation of the smaller phase-space available and the more well-defined final state. Application of the missing mass MM130 cut results in the data distributions of Fig. 11. The effect of the cut on is similar to that already shown on 3He. The low invariant mass regions below 500 MeV/c2 are essentially eliminated; the means of the distributions are approximately 25 MeV/c2 below their corresponding distributions in Fig. 10. This is consistent with the lower center-of-mass energies available for pion production due to the lower Fermi momenta of the struck nucleons.
The MM130 cut does not have the same quality of improvement in the -wave-like behavior of the cos data as it did for 3He. This is partly due to the fact that the deuterium data are the result of a subtraction, CDC, and partly due to the MM130 cut itself. This cut is perhaps too generous for such a loosely bound nucleus, and will be tightened in subsequent sections of this work. Nevertheless, the “edge-to-center” ratios of cos distribution for the cut are good.
IV.3 The effects of the cuts upon the 12C data
Fig. 12 shows the effect of the cuts on the 12C data. The and distributions are similar to the two lighter nuclei, but with broader, smoother distributions, reflecting the larger phase-space available to the pions due to the higher Fermi momentum in this nucleus. The overall effect on cos is also similar for all three nuclei. One minor difference observed in this figure is that the loss of acceptance observed at the extremes of the distribution is even less pronounced for 12C compared to 3He. This is consistent with the MC simulations. The -wave signature is clearly observed as a result of the opening angle cut.
Application of the MM130 cut results in the distributions in Fig. 13. The reduction in the number of surviving events is dramatic, compared to the other two nuclei. Application of the same cut on 2H resulted in a survival fraction of 54% for the cut. In the 3He case, the surviving fraction is 34% while in this case the fraction is 19%. This severely restricts the surviving statistical precision. However, comparing the cos distributions for the , and cuts in Figs. 12 and 13, the MM130 cut reduces the non--wave background in a very effective manner.

IV.4 Conclusions from the comparison of the data to the simulations
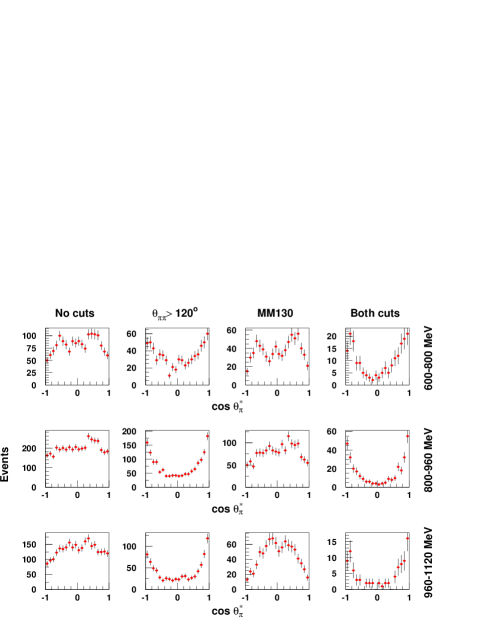
Overall, the effect of the two cuts on all the variables investigated and for all three different nuclei do not result in any significant differences in the distributions among the three target nuclei. It should also be mentioned that the cos distributions for the three photon energy bins of 600-800, 800-960 and 960-1120 MeV are also very similar. A sample plot of the 12C data for the full photon energy range is shown in Fig. 14. Application of the cut removes most of the yield near cos=0, resulting in the -wave-like distributions in the second column. Application of only the MM130 cut eliminates events across the distributions, without altering their shapes. The final column displays the final distributions after the application of both cuts. The surviving events are consistent with processes dominated by -wave-like distributions. The two-step processes analogous to those simulated in Fig. 6 cannot be the main contributors, as they have different responses to the cuts than the foreground channels and the data respond to the cuts as the simulations predict. There is little evidence that background processes dominate the data-set after application of the two kinematic cuts, each with their own unique effects on both the data and the MC simulations. In fact, a direct comparison of Figs. 6 and 10 indicates that the total background is a small fraction of the total event sample. However, the exact contribution of the background in the cos distributions needs to be determined in a quantitative manner, and this is the subject of the next section.
V Investigation of non- background via helicity analysis
The purpose of this section is to investigate the relative contributions of the various production processes to the observed cos distributions, to subtract the contributions of the background processes in as model-independent manner as possible, and in so-doing to obtain a better measure of the observed distribution versus invariant mass for each of the target nuclei. In order to gain more insight into the nature of the non- background remaining after the missing mass and opening angle cuts, both the experiment and the MC-simulated cos distributions were fit with a function that contains a -wave term, a -wave term and an interference term. In this manner, all of the elements of the distributions, namely a uniform event distribution, a symmetric -wave distribution about and an asymmetric interference term are represented in the fit. The fitted function is
| (1) |
This function is not intended to provide a perfect fit to the observed distributions, but rather to provide a means to quantify the relevant features of the observed distributions.
If the data show high fractions of -wave content, it means that the coefficient , which is the “pedestal” at cos, is very small. This can either mean that the background is negligible and the data are almost purely in content, or that there may be significant background, but it is almost purely -wave-like due to the cuts imposed. None of the background processes in Fig. 7 appear to reflect such a possibility.
In order to extract the in-medium invariant mass distribution, one needs to investigate the data and MC simulations as a function of and possibly extract different confidence levels for different values. Both the experimental and MC-simulated data were binned according to invariant mass, and a cos distribution formed for each bin. Each invariant mass bin was 90 MeV/c2 wide, staggered in 30 MeV/c2 increments. Thus, the first bin was 360450 MeV/c2, the second was 390480 MeV/c2, and so on. This binning procedure was necessary to ensure sufficient statistics per bin to allow inferences to be formed, while preserving sufficient invariant mass resolution to make these inferences interesting and useful. The three coefficients were determined for each bin for both the data and the various MC-simulated processes, and tabulated according to the mean value of the respective population in each bin. Thus, although the data and simulations used the same binning scheme, the tabulated values for each differ slightly according to the distributions of the populations of each. Checks were made to ensure that the resulting parameter distributions versus were not sensitive to the bin size and stagger offset used.
If the non- processes had cos distributions described by only the flat and skewed terms of the fitting function, and if the process had a pure cos distribution with only the coefficient being non-zero, then a plot of versus invariant mass would give a precise measure of the observed distribution for each of the target nuclei. To first order, this is in fact a good approximation. However, as we have seen in section III.2.1, the TAGX acceptance modifies the expected distribution from a pure cos function, and the background processes contribute somewhat to as well as to and .
If one integrates equation 1 from cos=-1 to +1, one obtains . The ratio thus provides a relative measure of the cos component in the observed distribution. The skewness coefficient, , does not contribute to the integral as this term is odd in cos. However, as we have seen in Fig. 9, certain background processes have significantly skewed distributions, so the value of could assist in the discrimination between and non- processes. This conclusion was confirmed after further analysis, and so a -wave shape ratio
was formed for further study. This weighs the skewed coefficient as if the absolute value of the skewness term had been taken in the integral. The absolute values in the denominator ensure that cancellation between opposite sign coefficients cannot artificially boost the value of the ratio.
V.1 Comparison with data
Fig. 15 displays the observed -wave shape ratio for the 3He data and several MC simulations. The two producing channels considered are quasi-free production and decay, while the two “benchmarks” for non- di-pion production are the quasi-free and processes. The elimination of the process from further consideration is based on the observation that it has no -wave-like structure independent of any cuts applied, and that the proportion of events surviving the cuts is small (see Figs. 7 and 8). For the quasi-free simulation, deviates from 1.0 because of the finite TAGX acceptance, primarily due to the inability to detect pions emitted between 0 and in the lab frame. As expected, the simulation yields similar results. The ratios for the two background processes, however, show much greater variation, as a result of the and cuts. For example, at MeV the and channels display high -wave ratios between MeV/c2, but lower ratios in most other regions.
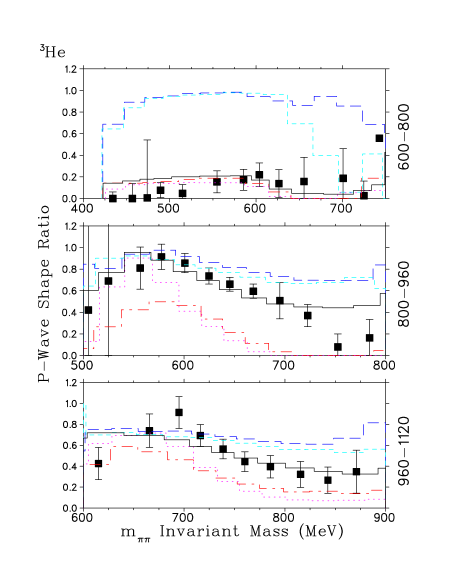
For 800-1120 MeV, the data have -wave ratios which are mid-way between the -producing and background simulations. This means that after the application of the and cuts, the data still contain some contribution from non- processes. The effect of the background processes is to dilute the -wave shape ratio observed for the data. For example, between 800 and 960 MeV tagged photon energy, a less than 10% contribution of the process to the remaining data would be sufficient to account for the degradation of the ratio from that of the pure- process to that observed for the data. At 600-800 MeV, however, the degradation of the observed ratio is more severe, and a more significant contribution by background processes to the remaining data after the cuts would be necessary to account for the observed ratio. For the higher region of 960-1120 MeV, the picture is even more complicated. Within the data error bars, the MeV/c2 region has a high -wave shape ratio, but at the same time, the background channels (especially the channel) also have high ratios. Thus, the level of confidence in this region is not as high as that of the mid-energy region.
Thus, the confidence in the accurate extraction of the component, and therefore its invariant mass distribution, depends on both and . In the mid- range, where the most and highest quality data have been obtained, the degradation in the observed -wave ratio appears to be small, and so events may be extracted with high confidence for values between 550 and 730 MeV/c2. The confidence in the low region, which is deeply sub-threshold, is not as high, while the situation at the high end of the tagged photon energy range is similar.
Fig. 16 displays the -wave shape ratio for the 2H data and the equivalent four MC simulations. In this case, the imposed missing mass cut is at 90 MeV excitation energy equivalent (MM090), in order to improve the foreground to background ratio of the data. The opening angle cut remains at . The 2H data exhibit a -wave ratio which is diluted in comparison to the pure- channels, which indicates that a portion of the data remaining after the cuts is due to background processes. This is particularly true for the low-energy panel, where the 550-620 MeV/c2 invariant mass data have a ratio, while the pure- channels have ratios in excess of 80%. In this case, the dilution of the ratio could be explained by attributing approximately 40% of the data to background processes, while the background proportion would be much less for the other two energy bins.
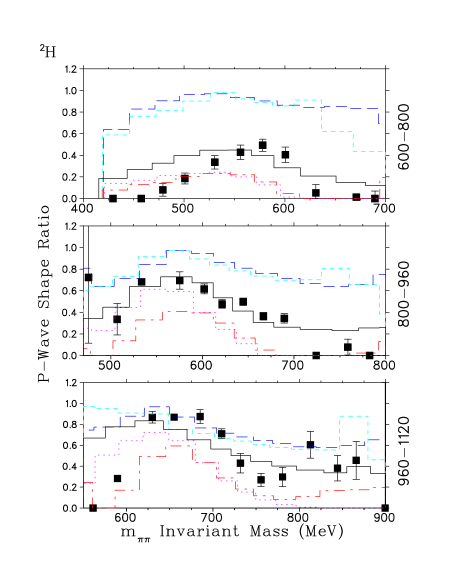
Finally, a measure of the reliability of the helicity analysis for 12C can be pursued with the same methodology in Fig. 17. The data display larger -wave shape ratios than either of the 2H or 3He data, consistent with a smaller proportion of background reactions surviving the two cuts.
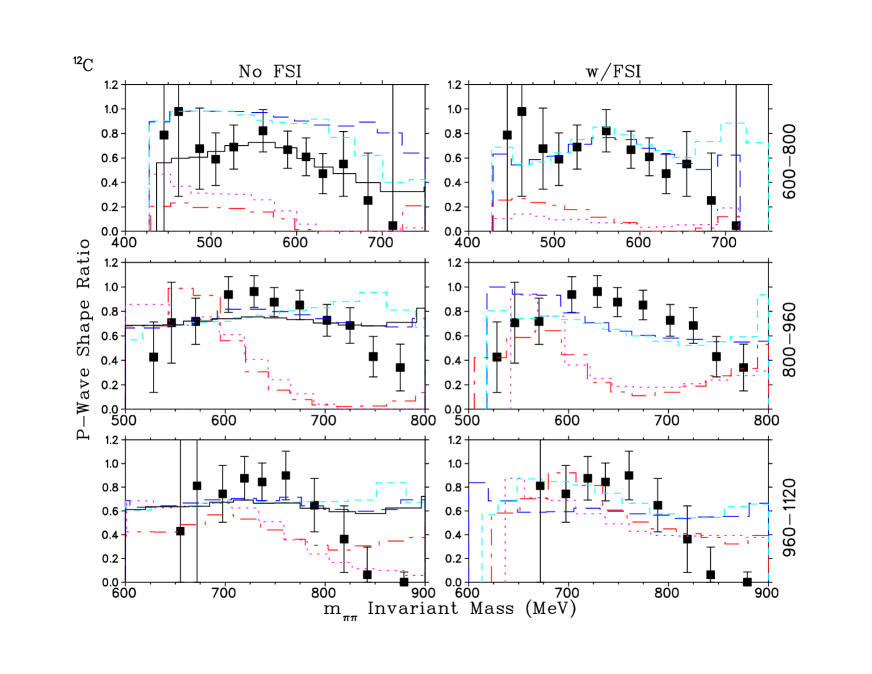
Simulations both with and without the effects of re-scattering FSI are also displayed in Fig. 17. In the 600-800 MeV photon energy bin, the data and FSI-modified processes are in excellent agreement for all values of . This is likely a fortuitous agreement, as it would indicate a 0% contribution due to background processes in this energy region, an expectation at variance with our findings for the two lighter nuclei. Moreover, in the 800-960 MeV energy range, the data display a -wave shape ratio which is larger than that expected for the FSI-modified processes. To be in agreement with the data ratios, a negative number of background process events would have to be subtracted in this region, which is unreasonable.
Simulations without FSI are shown in the left panels of Fig. 17. There, the data show large -wave ratios which are consistent with or degraded slightly from those expected for pure processes. Our expectation from Fig. 8 is that a large fraction of the re-scattering FSI will be removed by the analysis cuts. If one assumes that 100% of FSI processes have been eliminated, the non- contribution to the remaining 600-800 MeV and 800-960 MeV tagged photon bin yield is still less than 10%. A more likely scenario is that some FSI contribution remains after the cuts, but since the re-scattering processes do not significantly affect the -wave shape ratio, their contributions are relatively difficult to distinguish. In this case, however, the assumption of no re-scattering FSI actually leads to the subtraction of a greater amount of non- background, and so is the more conservative of the two choices. The 960-1120 MeV energy bin is less definitive, due to poorer statistics. Even here, the data exhibit -wave ratios consistent with dominance, although the background contribution is likely higher than in the two lower tagged photon energy bins.
It is interesting to note that among the three nuclei, the more massive and complex target exhibits the cleanest -wave signature overall. This analysis simply underscores the observations made by comparing Figs. 10, 11, and 13, which are -integrated distributions for the data surviving the cuts from each nucleus. It appears that the missing mass cut is very effective in eliminating background, moreso in the case of 12C.
The response of the MC simulations to the two cuts provides a good description of the response exhibited by the experimental data. While all three nuclei seem to be dominated by the same production mechanisms, as indicated by the distributions of several important observables, and all three show clear signatures of -wave attributed to production and decay, the relative background proportion is different for the three nuclei. It is important to emphasize here that the information obtained for the background channels are relative ratios, since absolute cross sections are not known under these conditions. However, they are valuable inputs to the robustness of the conclusion that events are correctly identified for specific regions of photon energy and invariant mass. They also provide an additional, and independent, tool to compare the results of this analysis with previous publications on the subject Lo98 ; Hu98 ; Ka99 by forming the foundation upon which the extraction of the invariant mass distribution is accomplished. For all three nuclei, the 800-960 MeV tagged energy regions have the best statistics and cleanest -wave signatures associated with quantum states. This is also the energy region of increasing, but still sub-threshold, production. Thus, this is the region where one expects non-coherent production signatures to manifest themselves, if they are to be present at all. Finally, the analysis and FSI simulations shown here have not altered the conclusions in Ref. Lo02 , that no background processes have been identified which can account for or explain the helicity signatures observed in the data.
V.2 Non- background subtraction
Based on the analysis of the -wave shape ratios of the different contributing processes, the portion due to non- background can be estimated and subtracted. The basic procedure was that relative contributions of the foreground processes ( and quasi-free ) and background processes ( and ) were fit to the distributions of the data, yielding two relative normalization factors for the foreground and for the background, respectively. Our estimate of the in-medium invariant mass distribution is then obtained from
A single normalization factor was thus obtained for each tagged photon energy bin; the values are tabulated in Table 2. To minimize model sensitivity, the , , coefficients for the two foreground processes, quasi-free and , and for the two assumed background processes, quasi-free and , were averaged together prior to fitting the distributions.
| Nucleus | Tagged photon energy bin (MeV) | ||
|---|---|---|---|
| 600-800 | 800-960 | 960-1120 | |
| 2H | |||
| 3He | |||
| 12C | |||
The solid lines in Figs. 15, 16 and 17 indicate the fits to the distributions for the three target nuclei. It is clearly seen that the MC simulation sums do not perfectly describe all of the features of the data. However, the -wave shape ratios are relative ratios, independent of the actual yield of the data within each invariant mass bin, and the discrepancies between the fits of the simulations and the data are largely confined to the tails of the invariant mass distributions. To avoid unwarranted sensitivity to these regions, the fits were weighted according to the data yield within each invariant mass bin. In many cases, the fit to the data could have been improved by choosing one of the background or foreground processes alone in the fit and excluding the other, rather than averaging them. If this was done, the obtained normalization factors would not vary outside the uncertainties listed in Table 2. Nonetheless, which background or foreground process to choose to obtain the best fit would depend on target nucleus and photon energy bin, and so the averaging procedure was maintained to ensure uniformity of approach for all of the data distributions.
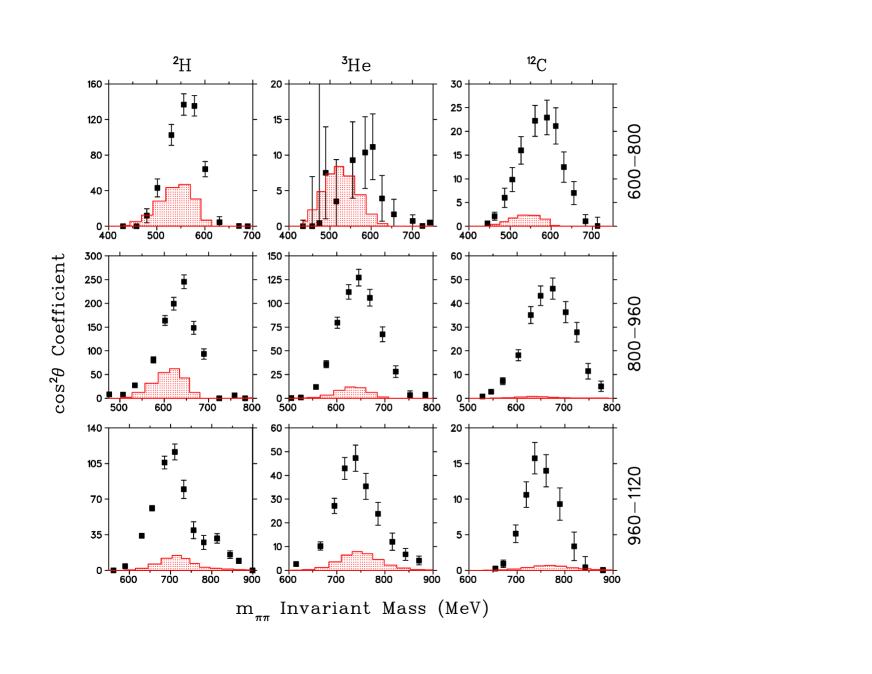
Fig. 18 shows the cos fit coefficient ‘’ versus invariant mass for all three nuclei. The shaded regions are for the estimated background contributions to the cos coefficient distributions resulting from the analysis. With the exception of the 600-800 MeV 3He distribution, the estimated background contribution is nearly negligible for 12C, a bit larger for 3He, and larger yet for 2H. This systematic behavior is despite the tightest missing mass cut being applied to the 2H data, and the most generous cut applied to the 12C data. In most cases, the shaded contributions to be subtracted are relatively small, quantifying the earlier discussion that the data display large -wave signatures which are consistent with decay Lo02 .
Regarding the 600-800 MeV distribution for 3He, one should note from Fig. 1 that the photon energy mean and distribution for this bin are markedly different than for 2H and 12C, and so substantial differences are to be expected. Because of the 60 MeV lower mean photon energy, the cross-section on 3He is reduced, and the data have poor statistical confidence. The large data error bars preclude any meaningful conclusions to be drawn with this analysis technique. Even with these limitations, the value of the cos coefficient for MeV/c2 indicates the presence of some contribution to the data. The maximum values of the 600-800 MeV 2H data are nearly double those of the background processes, and this can be accommodated by assuming a foreground/background proportion of 2:1 (Table 2). The background contribution to be subtracted (shaded region of the left panel of Fig. 16) has nearly the same invariant mass distribution as the data, and so the resulting distribution is not particularly sensitive to errors in the subtracted proportion normalization. The 600-800 MeV 12C data are fitted quite well by the sum of the MC simulations, and this is reflected in a substantially smaller uncertainty in .
As has been already discussed, the 800-960 MeV region is one of good statistical precision and one of high confidence in the -wave shape analysis. This is reflected in the fits of the simulations to the data, and the low uncertainties in the normalization factors. In all cases, the portion to be subtracted is approximately centered beneath the data, and so the background subtraction will appreciably alter neither the centroid nor the width of the extracted in-medium invariant mass distribution. While the 2H and 3He data are fit quite well, the 12C data display a ratio which is slightly larger than any of the MC predictions. Recall that for the simulations including FSI, this discrepancy was even larger. As the maximum value of the simulation equals that of the data, just at a different invariant mass value, the discrepancy could be in-part due to the free line-shape assumed in the simulations. The data indicate a very small non- proportion to be subtracted, and this is reflected in the near-unity value of the obtained factor.
The quality of the fits to 960-1120 MeV energy bin data are poorer than at 800-960 MeV. At this higher energy, decay is more likely to result in missing mass and opening angle values which do not pass the physics analysis cuts, resulting in the poorer statistics of the surviving data sample. The number of incident tagged photons for this bin also is smaller, especially for the CD2 experiment. With the exception of the extreme tails of the distribution, the fit to the 2H distribution generally follows the trend of the data, given the size of its error bars. For the purpose of estimating the size of the background to be subtracted, the level of agreement is more than adequate. The earlier discussion for the 12C distribution applies here as well; the data are consistent with a negligible background contribution.
V.3 Self-consistency checks
It is of interest to investigate the validity and self-consistency of the analysis followed above. Our method is to check whether the fit coefficient values, used to determine the background contribution to be subtracted, are able to reproduce the cos data distributions for a number of different bins. For example, if was not a sufficiently accurate measure of the shape of the data’s cos distributions, the , , coefficient values determined from fits to them would not provide good descriptions of the data, and the validity of the background subtraction just performed would be in doubt. The 800-960 MeV photon energy region was chosen for this check, as it has the best statistical precision, and so any systematic deviations from the data may be most easily discerned.
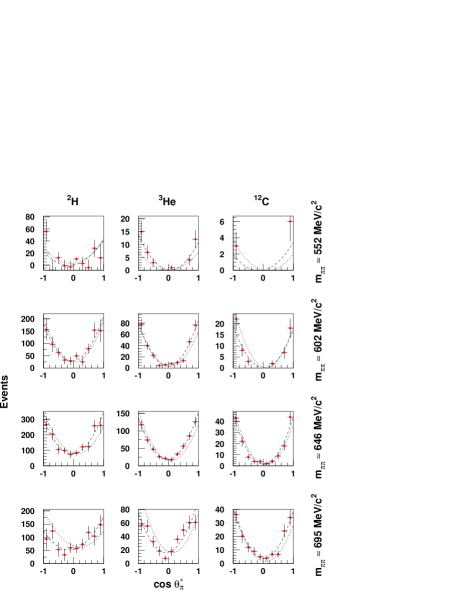
Fig. 19 shows the distributions for four bins centered at approximately 552, 602, 646 and 695 MeV/c2. As discussed earlier, each invariant mass bin is 90 MeV/c2 wide, and so there is partial overlap between adjoining bins. The long-dashed line in each panel is the best fit to the data with the coscos function. The short-dashed line is a result of the sum of the and background contributions, as discussed in the previous section. The agreement of the two curves is a direct measure of the reliability of the identification of the foreground and background components in the data. For all three nuclei, the curves agree quite well throughout the range. While it is to be expected that the long-dashed curves will be better descriptions of the data, as they have been directly fit to them, the deviations of the short-dashed curves from the data are comparable to the size of the data error bars. The 602 and 646 MeV/c2 bin data have the smallest statistical error, and the two curves are in the best agreement. The 552 and 695 MeV/c2 bins have significantly fewer events, and the discrepancy between the curves is larger, as expected. The overall conclusion is that there is no systematic deviation of the short-dashed curves from the data which is outside the statistical error of the data and analysis, and so the reliability of the background subtraction method is validated. The overall self-consistency achieved for the 12C data is quite impressive. This is a direct result of the very effective suppression of the background processes by the two cuts.
VI Comparison of the extracted in-medium invariant mass distributions with model calculations
Before our extracted invariant mass distributions can be compared to any model, a number of effects must be taken into account in its prediction. Because of the sub-threshold nature of the experiment, the role of the limited kinematic phase-space is significant, and must be accounted for. In addition, although every effort has been made to quantify and remove non- background contamination from the data, the effect of the TAGX spectrometer acceptance and detection thresholds still remain. Similarly, the model prediction should be subjected to the same and cuts as the experimental data. The best way to take these effects into account is to embed the model calculation within a MC simulation of the experiment, and analyze the simulated events in the same manner as the data. Only by following a procedure of this manner can reliable comparisons be made to the data.
In this section, we will first present a comparison of our data to two kinematic models utilizing the free line-shape obtained from PWA analysis of the reaction Be93 . This free line-shape provides a superior description of the low mass tail, significantly better than the standard parameterization of Ref. pdg . This will investigate the roles of kinematic phase-space and Fermi momentum and will provide the first indication of the reaction mechanism responsible for the significant longitudinal polarization observed here. Then, we will compare our data to three phenomenological models of the in-medium . We believe this will provide the most rigorous comparison to date between model and observation of the in-medium characteristics. In all cases, the simulated events were tracked through the simulated TAGX spectrometer and have all acceptance and threshold effects applied. The simulated events were then analyzed in exactly the same manner as the data, and the quadratic fit coefficient to the cos distribution extracted, just as for the data.
VI.1 Comparison with the kinematic model
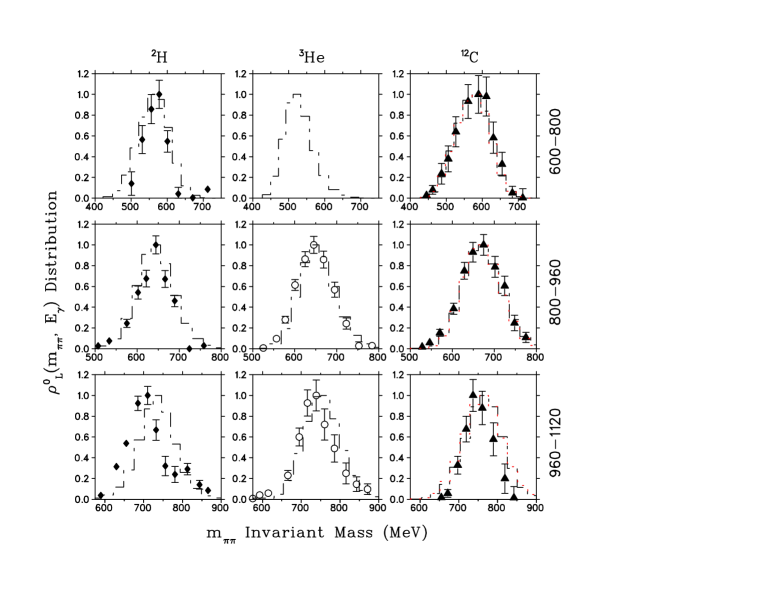
In Fig. 20, the extracted invariant mass distributions for all three nuclei are shown together with the quasi-free MC simulation discussed earlier [long-dash lines]. Overall, we see that the simulation provides a good description of the data for all three nuclei and all tagged photon energy bins. This is a convincing statement that indeed the -wave signatures isolated are those of sub-threshold production. The probability that uncorrelated pairs from unrelated production processes could result in an invariant mass distribution similar to the partial-wave analysis and respond in the same manner to the applied kinematic cuts, is simply too remote to be credible.

Upon closer inspection, we observe deviations between the data and quasi-free model distributions. The agreement between data and simulation is best for 12C. For the 600-800 MeV bin, the agreement between the 12C MC simulations and the data is excellent for the whole range of the invariant mass values. For the 800-960 MeV bin, the width of the simulated distribution is the same as that of the data, but it is peaked at slightly higher mass. In the case of the 960-1120 MeV bin, the quasi-free distribution is slightly broader than the data and peaked at a higher invariant mass. It appears that the trend barely discernible in the 800-960 MeV bin, has become more pronounced in this energy region.
The same broad conclusions are also true for the comparison between MC and data for 3He. Here, the widths of the data and MC distributions are nearly the same, but the data are consistently peaked at about 20 MeV/c2 lower mass. Surprisingly, the deviations between data and simulation are greatest for 2H. In both the 600-800 and 800-960 MeV bins, the data distributions are narrower than those of the simulations, and there is a progressive shift in the centroids of the data distributions away from the simulations as the photon energy is increased.
In conclusion, while there is qualitative agreement between the data and the calculated invariant mass distributions, the deviations merit further study. The higher centroids and broader widths of the quasi-free MC distributions may indicate more phase-space available to the assumed production and decay reaction than the data justify.
VI.2 Comparison with the kinematic model
Fig. 20 also compares the data distributions to the quasi-free mechanism MC presented earlier [short-dash lines]. The assumed free line-shape is the same, but the effects of kinematic phase-space and Fermi momentum are different, due to the more constrained reaction mechanism. For the 2H 600-800 MeV energy bin, the agreement between data and the simulation is much improved from the quasi-free MC and it is now quite impressive. The different phase-space available to the resulting has narrowed the calculated distribution and the overall agreement extends throughout the range. It is the strongest evidence yet that decay is the dominant production mechanism in this energy range for this nucleus.
The improved agreement between the -based production mechanism and the 2H data carries over to the 800-960 MeV energy range. In comparison to the MC, the simulated distribution has a more similar width to the data, although the centroids disagree. For the 960-1120 MeV energy bin, the data and MC distributions appear shifted by approximately 40 MeV/c2 from each other, with the data being lower than the model distribution. The precise reason for this is not clear but it may be related to the quasi-free assumption, admixture of coherently produced and/or admixture of quasi-free production. We conjecture that this admixture may also be responsible for the small bump near MeV/c2 in this energy bin.
Now moving on to the 3He distributions, we see that the production mechanism gives a much better description of the 800-960 MeV data than the quasi-free simulation. As expected from the experience with 2H, the -based distributions are both narrower and shifted to lower values compared to the quasi-free simulation. For the 960-1120 MeV energy region, the 3He data are also in better agreement with the process, but the level of agreement is less impressive than for the lower energy bin.
Finally, for 12C the level of agreement with the -based production mechanism is worse than with the quasi-free mechanism for the 600-800 and 800-960 MeV bins. For the 960-1120 MeV bin, the centroid of the distribution is given better by the simulation, but the width is given better by the quasi-free simulation. While the two lighter nuclei are broadly consistent with dominance of the channel, for 12C, only in the 960-1120 MeV energy regime can some evidence for the channel be found.
VI.3 Conclusions from comparison to kinematic models
The general agreement of the experimental invariant mass distributions with the expectations from the PWA-based parameterization verify that the analysis has indeed identified pions originating from decay. The small Fermi momentum distribution of a single nucleon in 2H allows sub-threshold production of the , while the small nuclear density is expected to result in minimal, if any, medium modifications. As such, 2H is an ideal nucleus to use as proof of principle of the analysis that indeed the has been identified and been isolated in the event sample. This analysis, then, should lay to rest any question whether the has been indeed identified at sub-threshold energies.
The 2H and 3He data invariant mass distributions favor production via the quasi-free mechanism. The two quasi-free mechanisms investigated here have invariant mass distributions that are significantly different from each other, allowing these comparisons to be meaningful. The comparison with the kinematic models has thus given a strong experimental indication of the likely production mechanism at these photon energies. Regarding the lack of evidence in the 12C data to support even a modest content of the latter mechanism, we note that the role the plays in nuclei, and its in-medium mass and width, is an ongoing debate. Our simulation made use of free parameters from Ref. pdg . While there is good evidence to suggest that the is significantly broadened in complex nuclei, more recent results from photo-absorption studies on carbon and more massive nuclei shed new light on this subject Kr01 . Even though the photon energies did not exceed 800 MeV in that work, its primary subject was the excitation and its possible medium modifications, including broadening, in nuclei. The lack of experimental signatures of the resonance in total photo-absorption cross sections in nuclei like carbon, thus remains a not-understood phenomenon.
Finally, a detailed comparison of the data with the simulation results indicate deviations from the simple kinematic models considered here, which are likely due to higher and resonances and/or reaction mechanism admixtures. The comparison of the data with the phenomenological models to follow may shed further light on these discrepancies. Of the three models presented, two are based on established hadronic interactions that do not involve quark or QCD elements. While both models share a similar philosophy and share some common elements, there are substantial differences between them. The third model is also phenomenological in nature, but it is based on quark degrees of freedom and its foundations are thus completely different from the other two.
VI.4 Comparison with the Rapp - Chanfray - Wambach (RCW) Model
This model Ra97 has two main contributions to the in-medium spectral shape of the . First, the interactions of the pions with the surrounding nucleons and ’s accumulate substantial strength in the spectral function for the lower regions of the invariant mass. This renormalization of the pion propagation in a gas was first proposed in Ch93 ; Ch96 . Second, the contributions to the spectral shape from in-medium -baryon scattering are evaluated. This model reproduces the experimental data on -wave scattering in free space as well as the pion electromagnetic form factor in the time-like region.
The first element of the model accounts for medium modifications of the by considering the interaction of the intermediate two pion states, in other words, the is “dressed” by the two pion intermediate state. The single pion self energy in these intermediate states is evaluated within the particle-hole excitations at finite temperature. Specifically, the pions interact with the surrounding nucleons and with the thermally excited states through excitations of the type , , and . Evaluation of these type of interactions lead to substantial broadening of the spectral function. The peak is shifted to slightly higher values for the invariant mass, however, significant strength is added to the low mass region below 600 MeV/c2.
The second element of the model treats the scattering of the in-medium. The sizable strength of the and coupling constants, and the large branching ratios of and decays to final states, led the authors to consider and particle-hole-like states called “rhosobars”. Such states have been extended to include the resonance. The calculated contributions of the overlapping states of such “rhosobars” result in an appreciable enhancement of the invariant mass distribution below 600 MeV/c2 while, at the same time, leading to a depletion of the invariant mass peak.
These two main sources of medium modifications lead to an enhancement of the two-pion invariant mass spectrum below the region accounted for by free and mesons and they appear to account very well for the experimental data on di-lepton production in high energy heavy ion collisions CERES and Ra99 . As such, the model provides an alternate explanation of the di-lepton spectra to that of the chiral phase transition Ca95 ; Li96 . Although the model is particularly suited to conditions of nuclear matter at high densities and temperatures (heavy ion collisions at high energies), it can also find application to nuclear matter at lower densities such as those found in the nuclear core. It is a non-relativistic model and this is the main difference from the model of Post - Leupold - Mosel Po01 .
Details on how the RCW-model was implemented in the TAGX simulation are discussed in App. A.1. The RCW-model simulation is compared to the data in Fig. 21. In comparison to the two kinematic models in Fig. 20, the RCW model provides a good description of the data over the full energy range and for all three nuclei. Its description of the 12C data is similar to the quasi-free kinematic model while at the same time its description of the 3He data is similar to the kinematic model. For the 2H data, it does better than the quasi-free model, but still not as good as the model. This could be due to the limited number of spectral functions provided (see App. A.1), which are insufficient to describe the high density regions of the deuteron. As with the kinematic models, the agreement with the data is worst for the 960-1120 MeV bin. The model curves give broader distributions than the data justify and this is perhaps indicative of the lack of the in the model. Although ’s and ’s are included, the latter are of higher mass than the and play little, if any, role at our relatively low photon energies.
VI.5 Comparison with the Post - Leupold - Mosel (PLM) Model
This model is made in the low-density approximation, where the in-medium self energy of the is completely determined by the forward scattering amplitude. This is a critical element of the model and the forward scattering amplitudes are extracted from processes Ma92 . The model is relativistic and it thus avoids the problems of various components of the theory being evaluated in different frames of reference, as in other phenomenological models. In addition, the problem of the non-coupling of longitudinal states to -wave resonances in non-relativistic models is resolved in this model.
An essential ingredient of this model is the connection via unitarity between the matrix element for the decay of a resonance into a nucleon and a of a given polarization to the imaginary part of the forward scattering amplitude : . All the baryon resonances with sizable couplings to the channel have been included with relevant parameters from Ma92 . For transversely polarized mesons, the resonance plays a dominant role. In the longitudinal channel, the is the main contributor. For some of the resonances, there is considerable variation among different parameterizations of the coupling strength to the decay channel.
This model concludes that the plays a large role on the propagation of mesons in nuclei. While in the longitudinal channel the differences between relativistic and non-relativistic calculations are small, in the transverse channel and at large momenta there are significant differences and this model leads to pronounced broadening of the invariant mass peak.
Details on how the PLM-model was implemented in the TAGX simulation are discussed in App. A.2. The PLM model authors felt that the model could only be applied reliably to 12C, and so a comparison will only be made to the data for that nucleus, in Fig. 22. For the 600-800 MeV tagged photon energy bin, the PLM model provides a good description of the width of the data distribution, but the centroid is shifted to slightly lower values. No other model has under-estimated the centroid of this data distribution. The agreement between the PLM model and the 800-960 MeV data is improved, but is not nearly as good as that provided by the RCW model. The agreement with the MeV data is not as good as for the mid-energy region, with the model distribution being broader and shifted to higher invariant mass values.

Nuclear absorption of one or both pions may distort the spectral shape due to different absorption rates in different density regions of the nucleus, while medium modifications also depend on nuclear density. The effect of pion absorption in the medium was considered via the method described in section III.1.4 and is shown via the dotted curve in the figure. The simulation indicates that after the and cuts are applied, the effect of pion absorption in 12C is to remove events in an equal proportion from all parts of the distribution, resulting in an invariant mass distribution which is almost indistinguishable from the simulation in which pion absorption is not considered.
VI.6 Comparison with the Saito - Tsushima - Thomas (STT) Model
The foundations of this model lie in the quark-meson coupling (QMC-II) version of the original QMC model of Ref. Sa95 ; Sa97 utilizing the MIT quark-bag model. Here, quarks in non-overlapping nucleon bags interact self-consistently with both scalar and vector mesons in the mean-field approximation. The vector mesons are themselves described by meson (quark) bags, and the bag parameters are fixed to reproduce the free nucleon mass and radius. Since the vector mesons are described by quark bags as well, additional parameters have been introduced to fit their free (vacuum) masses. The in-medium masses are then given in terms of the mean-field value of the meson at that density, which is given by a parameterized (phenomenological) function.
It is worth noting that no pion or interactions with the nucleons in the nuclear medium, and excitations included, are incorporated in this model. The interacts with the scalar field of the nucleus and the two pions emerge with their original four momenta. Thus, this model provides a description of the modification of the mass due to nuclear binding effects only.
Details on how the STT model was implemented in the TAGX simulation are discussed in App. A.3. The simulation is compared to the data in Fig. 23. There is a slight shift between the 2H and 3He data and model distributions, but overall the agreement is impressive, especially given the model’s lack of any in-medium width or shape modification. Ref. Sa97 was the only work to provide specific predictions for our experiment; their predicted result for 3He was a 40 MeV reduction in the mass of the . The mean of the 800-960 MeV data distribution is lower than the predicted value by approximately 20 MeV. The STT model is the only one to provide a good description of the 3He data distribution at 960-1120 MeV. As the model has no sensitivity to spectral shape modifications, this agreement would imply that the line shape is largely unaffected by the nuclear medium, a fact consistent with the good agreement with our PWA-based kinematic models.
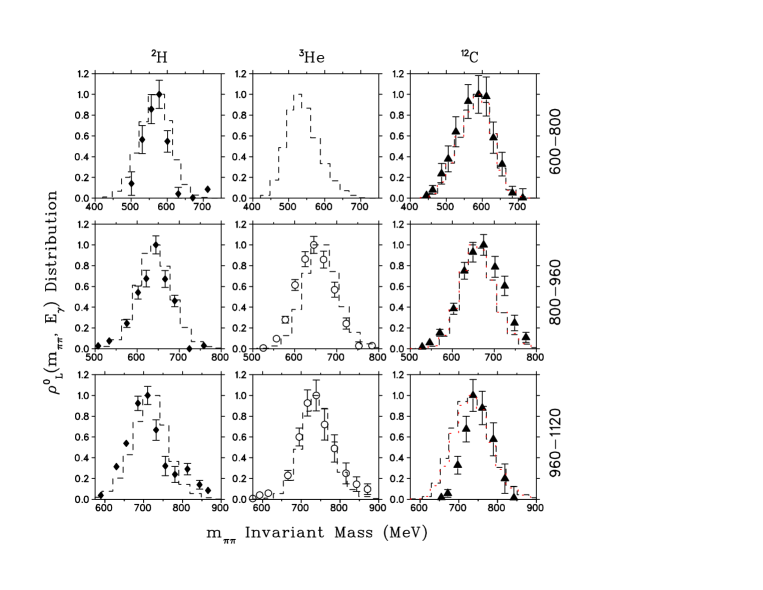
For 12C, the agreement between model and data is also quite good. At 800-960 MeV, the theoretical curve has shifted to slightly lower values compared to the data, and has a narrower distribution. This is the only case where a model distribution is sharper than the data indicate. This trend becomes more pronounced in the 960-1120 MeV range and, at the same time, the distribution has become significantly broader than the data. This behavior is unlike all other theoretical or calculated responses and it is unique in its energy dependence. It is interesting to note that, in comparison to the 960-1120 MeV data distribution, the STT and RCW-PLM models exhibit shifts in opposite directions. A model which incorporates both the nuclear binding effect of STT as well as the spectral function modifications of RCW-PLM has the potential to provide the best description of the 12C data.
VI.7 Conclusions from comparison to phenomenological models
The first model compared to the data, RCW, provides a reasonable description of the data from all three nuclei over all energy bins. Despite the fact that the is not explicitly included in the RCW model, the invariant mass distributions from this simulation exhibit some of the characteristics of the quasi-free and quasi-free kinematic simulations, presumably a reflection of the “rhosobar” nature of the model.
The second model, PLM, is more sophisticated, as it is fully relativistic. Where they can be directly compared, the differences between the RCW and PLM model simulations are small. While the RCW-simulated distribution for 12C tracks the changing shape of the data distribution with energy, the PLM model predicts a larger energy dependence than the data portray. The better agreement between the PLM model and the data at MeV is due, in part, to the fact that it is bracketed by two energy ranges where the simulated distributions are respectively at too low and too high mass compared to the data. Given the inputs and complexity of both models, the identification of possible factors that allow one model to give a better description than the other is not an easy task. However, the clear superiority of the quasi-free kinematic simulation over the for 12C may provide a helpful indication of why the RCW model does better. The RCW model does not include the , while in the PLM longitudinal channel model it has significant importance. Since the higher mass resonances in both models are largely suppressed due to phase-space in this experiment, we conjecture that the PLM model may over-estimate the role the plays in 12C.
Given its simplicity, the STT model does a surprisingly good job of describing the data. Because the free width is assumed in our simulation, the good agreement of the STT-simulated distribution with the 3He data, for example, raises the possibility that what is observed for this nucleus is the combination of a free spectral function and a central mass shift. For 12C, the STT model under-predicts the mass, and it might seem reasonable that the combination of the STT and RCW-PLM models will together provide a good description of the data, i.e. a central mass shift in addition to a spectral function modification.
VII Comparison with our previous results
This work reports new results on 2H and 12C and a re-analysis of our 3He data in light of the helicity analysis reported in Ref. Lo02 . Our earlier work on 3He Ka99 ; Lo98 ; Hu98 ; Ma00 reported significant mass modifications and, in the process, it proved to be controversial. It is of interest then to compare the older results with the analysis reported here and investigate their differences.
The 3He analysis in Refs. Ka99 ; Lo98 ; Hu98 was based on the simultaneous fitting of a number of quasi-free simulations resulting in production to data for five different kinematic observables. Ref. Hu98 was for the tagged photon energy range of 380-700 MeV, while Refs. Ka99 ; Lo98 reported results for 800-1120 MeV. In comparison to this work, these analyses used relatively loose cuts to enhance the contribution relative to the background channels. For example, the analysis of Ref. Ka99 was based on a simultaneous fit to the observables from the entire data sample (no physics cuts) as well as to a set of observables to which a set of enhancement cuts ( and MeV/c2) were applied. Because nearly the entire data sample was used in the analysis, a mass modification result could even be extracted for the MeV range, while this was not possible for the more restrictive helicity analysis reported here. On the other hand, because the conclusions were explicitly based on the fit of a series of MC simulations to the data, the results of Ref. Ka99 ; Lo98 ; Hu98 are more model-dependent than the helicity analysis reported here. So, the two independent analyses have their respective strengths and weaknesses, and taken together they can provide a more complete view of the properties of the in-medium meson.
Refs. Ka99 ; Lo98 ; Hu98 restricted their attention to the ‘best fit’ effective mass value, after accounting for background process contributions, free-mass production, and kinematic phase-space effects. Since the emphasis was only on the extraction of the most-probable reduced-mass value, a Gaussian line shape was taken for the , using the free width. This choice of line shape has been criticized, but the use of a Lorentzian line shape was investigated in Ref. Ka99 and yielded almost identical results. Even though these two line shapes have quite different low and high tails in unresctricted (free) phase space, when the TAGX thresholds and imposed phase space are taken into consideration, the resulting distributions are nearly identical. The conclusion of these studies was that the “effective” mass in 3He was reduced substantially from its free value.
Ref. Hu98 found an effective mass of MeV/c2 for MeV. However, no further comparisons to the present analysis can be pursued. For the higher energy 3He data, Ref. Lo98 found the largest improvement in the relative fit to the kinematic distributions at 800-880 MeV, with the next largest improvement for the 880-960 MeV bin. Ref. Ka99 , which included several improvements, concluded that these two energy regimes are the only ones where mass modification could be reliably extracted, with effective mass values of MeV/c2 for MeV and MeV/c2 for MeV. The 960-1040 MeV data were marginally supportive of an effective mass value of MeV/c2, whereas the data in the 1040-1120 MeV region were consistent with no mass modification. A change in the width of the was briefly investigated in Ref. Ka99 and it was concluded that “these exploratory fits verify the preference for a reduced mass, but are inconclusive, within the sensitivity of the data, as to whether a width modification is supported in addition.” Finally, in Ref. Pa99 we suggested that the observed effective mass could either be due to the proximity of the to the struck nucleon and the shorter mean decay length at lower energy, or due to the collective excitation of a state.
An independent analysis of the 3He data was published in Ref. Ma00 . Cuts were placed to identify the exclusive production () and the quasi-free production regions ( for further analysis. The line-shape was taken as a Breit-Wigner form and non- background was modeled via a phase-space mechanism. The interferences between free-mass , reduced-mass and non- contributions were taken into account via the Soding So66 model. For the exclusive production region, the extracted invariant mass distribution was consistent with free parameters, presumably these events originated near the periphery of the nucleus. The analysis of the quasi-free production region, expected to correspond to production deeper within the nucleus, yielded a line-shape significantly at odds with the free parameters, implying a reduced-mass value of MeV/c2.
For comparison with the present work, we restrict our attention to 3He. The good agreement of the free PWA line-shape-based simulations with the data (e.g. Fig. 20) support the conclusion that the width has not been substantially changed from its free value. This is consistent with the theoretical expectations of the RCW and PLM models, where the dominant width modification is restricted to transversely polarized . Comparison of the PWA line-shape-based simulations with the 960-1120 MeV data support a mass shift. Similarly, comparison of the RCW model Ra97 with the data (Fig. 21), indicate that the data support a slightly lower mass value than the model predicts. This conclusion is also reinforced by the comparison of the STT model Sa97 with the data (Fig. 23), which support a reduction of the mass while using the free width. The STT model predicts Sa97 a 40 MeV reduction in the mass in 3He, and essentially agrees with the 960-1120 MeV data in Fig. 23, confirming MeV/c2. For the 800-960 MeV bin, the STT model distribution is MeV high compared to the data, giving a reduced mass value no higher than MeV/c2. Although these values are obtained with reference to the STT model, they are consistent with our expectations from the kinematic and RCW models, and so are listed in Table 3 as representative ‘effective masses’ for this work. It is difficult to place an error bar on these masses within the context of the STT model, and so we refrain from doing so.
| STT model | Yield-weighted | |
|---|---|---|
| This Work | Ref. Ka99 | |
| 800-960 MeV | 700-710 MeV | MeV |
| 960-1120 MeV | 730 MeV | MeV |
To compare the old and present analyses, we must not only use the same tagged photon energy bin limits, but we must also keep in mind that the old analysis separated the free-mass and reduced-mass components, while the present results are for the total observed yield. At 800-960 MeV, free-mass production is very small, consistent with the 971 MeV threshold for production one below nominal mass on the proton, and then its contribution grows rapidly thereafter. Yield-weighted averages of the Ref. Ka99 results, including the observed free-mass component, are listed in Table 3.
Given their substantially different analysis techniques, the two sets of results in Table 3 are in broad agreement. The values from the present work are slightly higher than our earlier results from Ref. Ka99 , but agree within 1 . While the results of the present work are intrinsically less model-dependent, they rely on tight cuts upon the data, and so we were unable to extract any result for the 600-800 MeV energy bin, unlike our earlier works. This work verifies the conclusions from Refs. Ka99 ; Lo98 ; Ma00 that there is significant medium modification observed on the 3He target as a result of the sub-threshold production technique. A second conclusion regards the issue of width modification. While our old analysis was unable to make any statement on this issue, the agreement of the PWA-based simulations with the data distributions appear to rule out any substantial width modification, in accordance with model expectations.
VIII Discussion and Conclusions
Employing the unique signature of longitudinally polarized in the cos distributions established in Ref. Lo02 , this work has identified and isolated events from tagged photo-production on 2H, 3He and 12C in the MeV energy region. The analysis led to the extraction of the invariant mass distributions of the for all three nuclei over three bins of tagged photon energy. For 2H and 12C, this is the first time such results are reported. The 3He data were re-analyzed in the same manner and the results compared with our previously published results in Refs. Lo98 ; Ka99 ; Ma00 .
The effects of the two cuts used in the helicity analysis have been studied by comparison to a series of MC simulations with the same cuts applied. It has been shown that these cuts cannot create artificial longitudinal helicity signatures mimicking a contribution to the data. A -wave-like component from non- residual background was identified with the assistance of a -wave shape ratio and then subtracted, yielding the experimental in-medium distributions. This background component was found in most cases to be quite small, and its subtraction yielded distributions nearly indistinguishable from the unsubtracted distributions. Thus, the systematic uncertainty in the extracted distributions due to the background subtraction is small.
The 600-960 MeV 2H target data favor production via the production mechanism. For the MeV bin, neither of the kinematic production mechanism models account for the observed distribution. The agreement of the data with models based on the PWA-line-shape for the free is a conclusive statement of the identification of the events in the data sample, and of the reliability of the analysis.
The 3He distributions are also consistent with production via the mechanism, over the full observed photon energy range of 800-1120 MeV. Two phenomenological models Ra97 ; Sa97 are quite successful in describing the data. Comparison with the STT model simulation, using the free width and line-shape indicates that the data provide no evidence of an in-medium distribution that is broader than the free distribution. This is consistent with model expectations, which predict that the in-medium distribution will be significantly wider than the distribution. The STT model Sa97 predicts a modified mass of approximately 730 MeV/c2 in 3He, and it is in excellent agreement with the 960-1120 MeV data. For the 800-960 MeV bin, the data support a somewhat lower mass, MeV/c2. These results are slightly higher than the older analyses of the same data in Ref. Lo98 ; Ka99 ; Ma00 , but they confirm the observation of medium mass modifications in the 3He case.
The 12C distributions are consistent with quasi-free (PWA) production over all three tagged photon energy bins. The data are in excellent agreement with the RCW model Ra97 for the two lower energies, but RCW predicts a wider distribution in the 960-1120 region than the data support. The PLM model Po01 does well overall, but results in a larger variation in the distribution with energy than the data show. The STT model Sa97 predicts distributions narrower than the 12C data for the two lower energy bins and it is the only one of the three phenomenological models that predicts a lower mass value than the data exhibit. This indicates that a model which incorporates both the nuclear binding effect of STT as well as the spectral function modifications of RCW-PLM has the potential to provide the best description of the 12C data.
This very line of argument has already been raised by Brown and Rho Br02 in the context of recent results from RHIC. The Brown-Rho scaling of medium-dependent masses is combined with the spectral function modification of RCW in a unified picture. In this case, the mass in the phenomenological Lagrangian used by RCW is replaced with what is essentially the Brown-Rho scaling mass . For the temperatures and densities appropriate to this work, the two mechanisms push the -mass in the same direction, and so result in a lower mass than either model alone predict, nearly doubling the density effect BrPC .
The physical mechanism for the dramatic helicity flip remains an open issue. These data do not support either transversely polarized or unpolarized production. Either would have manifested as a -like background associated with some strength at the central region of the cos distribution. In Ref. Lo02 , one explanation offered for the observed longitudinally polarized was the large in that work associated with production 333The data range of values given in Ref. Lo02 is incorrect, the actual range displayed by the data is 0.2 to 1.1 (GeV/c)2. Rapidly increasing helicity-flip amplitudes had been observed in Ba72 for values of larger than 0.4 GeV/c. An alternate explanation is that the sub-threshold reaction mechanism may be responsible for the observed helicity flip.
Finally, the production mechanism seems to depend on the nucleus in question. Even though excitation in 2H is both broader and quenched with respect to the free proton, it constitutes a well-identified contribution to the second resonance group in pion photo-production studies Kr01 (and references therein). For the energies of this work, one expects significant excitation. The strong decay channel into pdg makes this a favorable production mechanism of the low invariant mass part of the . The data are consistent with this expectation.
IX Acknowledgments
The authors wish to thank the staff of INS-ES for their hospitality and help during the experiments, and G.R. Smith for the use of the CD2 targets. We also acknowledge the valuable interactions with G.E. Brown, W. Cassing, M. Post, U. Mosel and R. Rapp. Their assistance and theoretical insight have contributed much to this work. This work has been partially supported by grants in aid of research by NSERC and INS-ES.
References
- (1) G.Q. Li, Prog. Part. Nucl. Phys. 43 (1999) 619-682.
- (2) G.E. Brown and M. Rho, Phys. Rev. Lett. 66 (1991) 2720.
- (3) X. Jin and D.B. Leinweber, Phys. Rev. C 52 (1995) 3344.
- (4) R. Rapp, G. Chanfray and J. Wambach, Nucl. Phys. A617 (1997) 472.
- (5) M. Post, S. Leupold and U. Mosel, Nucl. Phys. A689 (2001) 753.
- (6) CERES Collaboration, Th. Ulrich et al., Nucl. Phys. A610 (1996) 317c.
- (7) E.J. Stephenson et al., Phys. Rev. Lett. 78 (1997) 1636.
- (8) K. Ozawa et al., Phys. Rev. Lett. 86 (2001) 5019.
- (9) N. Bianchi et al., Phys. Rev. C 60 (1999) 064617.
- (10) G.J. Lolos et al., Phys. Rev. Lett. 80 (1998) 241.
- (11) M.A. Kagarlis et al., Phys. Rev. C 60 (1999) 025203.
-
(12)
K. Maruyama, Proceedings of the Second KEK-Tanashi International
Symposium on Hadron and Nuclear Physics with Electromagnetic Probes, Tokyo,
October 1999. Edited by K. Maruyama and H. Okuno, published by Elsevier
(2000).
K. Maruyama, Nucl. Phys. A 629 (1998) 351c. - (13) G.M. Huber, G.J. Lolos, Z. Papandreou, Phys. Rev. Lett. 80 (1998) 5285.
- (14) G.J. Lolos et al., Phys. Lett. B528 (2002) 65.
- (15) G.M. Huber, Proceedings of the Ninth International Conference on the Structure of Baryons, Newport News, Virginia, March 2002. Edited by C. Carlson and B. Mecking, published by World Scientific (2003).
- (16) D.G. Watts et al., Phys. Rev. C 55 (1997) 1832.
- (17) K. Yoshida et al., IEEE Trans. Nucl. Sci. NS-32 (1985) 2688.
- (18) K. Maruyama et al., Nucl. Instr. and Meth. A376 (1996) 335.
-
(19)
M. Harada et al., Nucl. Instrum. Methods
Phys. Res. A 276 (1989) 451;
S. Kato et al., ibid. 290 (1990) 315;
S. Kato et al., ibid. 307 (1991) 213. - (20) G. Garino et al. Nucl. Instr. and Meth. A388 (1997) 100.
- (21) A. Shinozaki, Ph.D. thesis, University of Regina, 2002, unpublished.
- (22) P. Estabrooks, A.D. Martin, Nucl. Phys. B79 (1974) 301.
- (23) M. Benayoun, et al., Z. Phys. C58 (1993) 31.
- (24) D.V. Bugg, A.V. Sarantsev, B.S. Zou, Nucl. Phys. B471 (1996) 59.
- (25) M. Benayoun, et al., Eur. Phys. J. C 2 (1998) 269.
- (26) Particle Data Group, Eur. Phys. J. C 15 (2000) 1.
- (27) M. Bernheim et al., Nucl. Phys. A 365 (1981) 349.
- (28) A. Saha and P.E. Ulmer, private communication.
- (29) R. Schiavilla, V.R. Pandharipande, R.B. Wiringa, Nucl. Phys. A449 (1986) 219.
- (30) J.W. van Orden and P.E. Ulmer, private communication.
- (31) G. Rowe, M.Salomon, and R.H. Landau, Phys. Rev. C 18 (1978) 584.
- (32) D. Ashery, J.P. Schiffer, Ann. Rev. Nucl. Part. Sci 36 (1986).
- (33) M.K. Jones, et al., Phys. Rev C 48 (1993) 2800.
- (34) GEANT Detector Description and Simulation Tool, CERN Laboratory, Geneva, copyright 1993.
- (35) B. Krusche et al., Phys. Rev. Lett. 86 (2001) 4764.
- (36) G. Chanfray and P. Schuck, Nucl. Phys. A555 (1993) 329.
- (37) G. Chanfray, R. Rapp and J. Wambach, Phys. Rev. Lett. 76 (1996) 368.
- (38) R. Rapp and J. Wambach, arXiv: hep-ph/9907502 v1.
- (39) W. Cassing, W. Ehehalt and C.M. Ko, Phys. Lett. B363 (1995) 35.
- (40) G.Q. Li, C.M. Ko and G.E. Brown, Nucl. Phys. A606 (1996) 568.
- (41) R. Rapp, private communication.
- (42) R. Hofstadter, Ann. Rev. Nucl. Sci. 7 (1957) 231.
- (43) K. Saito, K. Tsushima and A.W. Thomas, Phys. Rev. C 56 (1997) 566.
- (44) J.L. Forest, et al., Phys. Rev. C 54 (1996) 646.
- (45) D.M. Manley and E.M. Saleski, Phys. Rev. D 45 (1992) 4002.
- (46) M. Post, private communication.
- (47) K. Saito, A.W. Thomas, Phys. Rev. C 51 (1995) 2757.
- (48) Z. Papandreou, G.M. Huber, G.J. Lolos, E.J. Brash, B.K. Jennings, Phys. Rev. C 59 (1999) R1864.
- (49) P. Soding, Phys. Lett. B19 (1966) 702.
- (50) G.E. Brown, M. Rho, arXiv: nucl-th/0206021.
- (51) G.E. Brown, private communication.
- (52) J. Ballam et al., Phys. Rev. D 5 (1972) 545.
Appendix A The implementation of the phenomenological models in the TAGX simulation
A.1 The Rapp-Chanfray-Wambach model
In-medium spectral functions were obtained RaPC for cold nuclear matter at three matter densities, and 1.0, where indicates the standard nuclear density of 0.155 fm-3. Longitudinal, transverse and spin-averaged functions were provided, but as the data strongly support the production of , only the longitudinal spectral function was used here. The in-medium propagator for each density is given in matrix form as functions of invariant mass and three momentum , where is the momentum of the with respect to the nuclear medium,
For each simulated event, the tagged photon energy, mass , and reaction location within the nucleus were randomly chosen and an event generated via the quasi-free mechanism , where is the participating struck proton with initial Fermi momentum and the remainder of the nucleus is a spectator. It should not be necessary to consider any other kinematic channel, such as , as these are already taken into account via the in-medium spectral function. To do otherwise would lead to “double counting” of resonance effects. The Fermi momentum distributions of Saha ; Sch86 ; VanO were used.
The nuclear density at the production location was calculated in the following manner:
- 12C:
-
3He:
We followed the parameterization given in Ref. Sa97 , which assumed 3He has a Gaussian density profile with core density of and of 1.11 fm.
-
2H:
It is perhaps not quite meaningful to consider 2H a dense enough nucleus to expect theoretical models of medium modifications to be applicable. However, several theoretical models have all the right ingredients of medium modifications due to the interactions of pions and resonances with the nucleons and pions in the nucleus and these models do reproduce the vacuum spectral shape correctly. Furthermore, while the average density of the deuteron is low, recent models utilizing modern potentials indicate that the deuteron is primarily a toroidal structure with a nearly hollow core and a maximum density of nearly 2 at fm. Here, the and -wave deuteron wave-functions from Ref. Fo96 using the Argonne AV18 potential were parameterized and used to calculate the state .
This density information was used two ways. First, it is used to select the appropriate spectral function for the event. Second, the generated event is weighted according to the density at the reaction vertex, so that production at the diffuse edge of the nucleus is less probable than from the denser core, consistent with the requirement of a quasi-free reaction mechanism.
To determine , the produced is Lorentz-transformed to the struck proton plus recoil-fragment rest frame, thus specifying the propagator value for the event, . This value was incorporated into the statistical weight for the simulated event. As the spectral function varies rapidly with but slowly with and , the propagator was interpolated from the closest bin, but no interpolation was performed either over or . The simulated events were then tracked through the simulated experimental detectors and analyzed in the same manner as the data.
A.2 The Post-Leupold-Mosel model
The PLM model was implemented in a manner similar to the RCW model. In this case, 15 in-medium propagators were provided PoPC in matrix form for nuclear densities from 0.1 to 1.5 . As with the RCW model, longitudinal, transverse and spin-averaged functions were provided, but only the result using the longitudinal spectral function is shown here. The propagators were provided as a function of energy in the nuclear medium rest frame, as well as invariant mass,
and was interpolated from the closest bin, but no interpolation was done over or . The same 12C density profile and Fermi momentum distributions were used as before.
A.3 The Saito-Tsushima-Thomas model
In the STT model, the mass is a function of the local density at its production point. We use their parameter set for the mean-field value of the -meson
where , and and is in MeV. The mass is then given by
The complex manner in which the mass and width are incorporated into the PWA parameterization of Ref. Be93 preclude its use here, and so the simpler parameterization of the line-shape of Ref. pdg is used, instead. In all other respects, are randomly generated within the nuclear medium via the quasi-free mechanism already described.