Proton induced reaction cross section measurements on Se isotopes for the astrophysical process
Abstract
As a continuation of a systematic study of reactions relevant to the astrophysical process, the cross sections of the 74,76Se(p,)75,77Br and 82Se(p,n)82Br reactions have been measured at energies from 1.3 to 3.6 MeV using an activation technique. The results are compared to the predictions of Hauser-Feshbach statistical model calculations using the NON-SMOKER and MOST codes. The sensitivity of the calculations to variations in the optical proton potential and the nuclear level density was studied. Good agreement between theoretical and experimental reaction rates was found for the reactions 74Se(p,)75Br and 82Se(p,n)82Br.
pacs:
25.40.Lw, 26.30.+k, 27.50.+e, 97.10.TkI Introduction
Details of the nature of the astrophysical process woosley90 ; rayet95 producing the rare, proton-rich, stable isotopes of elements beyond Ni still remain elusive. It has been shown that such proton-rich isotopes can be produced by photodisintegrations in massive stars rau02 ; arn03 , involving (,n), (,p), and (,) reactions at stellar temperatures exceeding 109 K. Depending on intricate details of the stellar structure and evolution, nuclides are mostly produced in the final explosion of a massive star () as a core-collapse supernova or in pre-explosive oxygen burning episodes rau02 ; arn03 . Despite the fact that nuclei can be produced consistently with solar ratios over a wide range of nuclei in such scenarios, there remain deficiencies in a few regions, for mass numbers and . The problem is especially pronounced in the Mo-Ru region where the isotopes are strongly underproduced. This fact motivates the search for alternative or additional ways to produce these nuclides. Proton capture and photodisintegration processes in exploding carbon-oxygen white dwarfs have been suggested as a source how91 ; jose02 , or thermonuclear explosions in the proton-rich layer accreted on the surface of a neutron star in a binary system with mass flow from the main-sequence companion star schatz ; schatz01 .
Common to all approaches is that the modelling requires a large network of hundreds of nuclear reactions involving stable nuclei as well as unstable, proton-rich nuclides. It is well known that (,) reactions are important at higher masses, whereas (,p) or proton capture is important for the production of the less massive nuclei. The relevant astrophysical reaction rates calculated from the cross sections are inputs to this network, therefore their knowledge is essential for process calculations. While there are compilations of neutron capture data along the line of stability, there are still very few charged-particle cross sections determined experimentally ful96 ; sau97 ; som98 ; bork98 ; chlo99 ; haris01 ; gyurky01 ; ozkan02 ; galanopulos03 , despite big experimental efforts in recent years. Thus, the process rates involving charged projectiles are still based mainly on (largely untested) theoretical cross sections obtained from Hauser-Feshbach statistical model calculations.
The aim of our systematic study is to contribute to the existing database of measured cross sections relevant to the astrophysical process, and to check the reliability of the statistical model calculations over an extensive set of nuclides. This way the uncertainties in the process abundance calculations arising from nuclear physics input can be constrained.
In this paper we present measurements of the 74Se(p,)75Br, 76Se(p,)77Br, and 82Se(p,n)82Br reactions in the astrophysically relevant energy range using an activation technique. The two proton capture reactions and their inverses are directly playing a role in the synthesis of 74Se, whereas the (p,n) reaction can be used as a further test of statistical model calculations. The choice of these reactions is further elaborated in Sec. II and the experimental method is described in Sec. III. The resulting cross sections and astrophysical factors (given in Sec. IV) are compared with results obtained with the two Hauser-Feshbach statistical model codes NON-SMOKER nonsmoker ; nonsmoker0 ; nonsmoker1 and MOST most in Sec. V. Both codes are based on the statistical theory of Hauser and Feshbach hau but use different models for the nuclear ingredients of the calculations. By using both codes we are able to investigate the effects of a broader range of nuclear level densities and optical model potentials. The astrophysical reaction rates derived from our new experimental data are given in the concluding Sec. VI.
II Investigated reactions
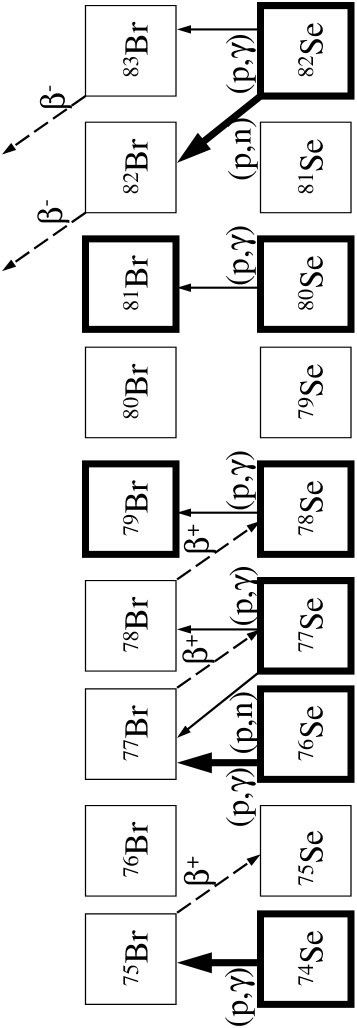
The element Se has six stable isotopes with mass numbers , 76, 77, 78, 80 and 82 having isotopic abundances of 0.89%, 9.36%, 7.63%, 23.78%, 49.61% and 8.73%, respectively. Proton capture reactions on these isotopes lead to Br isotopes among which 79Br and 81Br are stable. Therefore the cross sections of the 78,80Se(p,)79,81Br reactions cannot be measured using an activation technique. The half life of 78Br, i.e. the reaction product of 77Se(p,)78Br, is too short (T1/2 = 6.49 min.) for our experimental method (see experimental details). Thus the aim of the measurement was to determine the proton capture cross section of three reactions: 74,76,82Se(p,)75,77,83Br. However, in the case of 82Se the (p,n) channel opens already at = 891 keV and, therefore, competes strongly with the (p,) reaction in the whole energy range investigated in the present work. Moreover, the strongest transition following the decay of 83Br has a very low relative intensity (only 1.2 % of the decays lead to the emission of this 529.6 keV -ray). The latter two facts made it impossible to observe the decay of 83Br and to measure the 82Se(p,)83Br cross section. However, the 82Se(p,n)82Br cross section could be determined.
In summary, the cross sections of three reactions have been measured: 74,76Se(p,)75,77Br, and 82Se(p,n)82Br. The astrophysically relevant energy range (Gamow–window) for these reactions in the temperature range from T = 1.8K to 3.3K spans from 1.25 to 3.87 MeV. This energy region was covered by the experiment. The relevant part of the chart of nuclides can be seen in Fig. 1 where the proton induced reactions and the decay of the reaction products can also be seen. The decay parameters used for the analysis are summarized in Table 1.
| Product nucleus | Half life [hour] | Gamma energy [keV] | Relative intensity per decay [%] | Reference |
|---|---|---|---|---|
| 75Br | 1.612 0.002 | 286.6 | 88 5 | farhan90 |
| 141.3 | 6.6 0.5 | |||
| 77Br | 57.036 0.006 | 239.0 | 23.1 0.5 | farhan97 |
| 520.6 | 22.4 0.6 | |||
| 297.2 | 4.16 0.21 | |||
| 82Br | 35.3 0.02 | 776.5 | 83.5 0.8 | king95 |
| 554.3 | 70.8 0.7 | |||
| 619.1 | 43.4 0.4 |
III Experimental procedure
III.1 Target properties
The targets were made by evaporating metallic Se with natural isotopic abundance onto a thick Al backing. Natural targets have the advantage that the three investigated reactions can be studied simultaneously in a single activation procedure. Aluminum is ideal as backing material because no long-lived activity is produced during its bombardment with protons in the investigated energy range. Moreover, Al can easily be distinguished from the Se in the RBS spectrum (RBS was used to monitor the target stability, see below).
The target thickness was measured with the proton induced X-ray emission (PIXE) technique at the PIXE set-up of the ATOMKI PIXE . According to PIXE results, the target thickness was ranging from 200 to 700 g/cm2, corresponding to a proton energy loss of 10 keV (at 3.6 MeV) to 60 keV (at 1.3 MeV), respectively. The thicker targets (500-700 g/cm2) were used at the lower part of the bombarding energy range, where the low cross section results in very low induced -activity. The proton energy loss has been calculated with the SRIM code SRIM .
III.2 Activation
The activations were carried out at the 5 MV Van de Graaff accelerator of the ATOMKI by irradiating the Se targets with a proton beam. The energy range from Ep=1.3 to 3.6 MeV was covered with 100 – 300 keV steps. The schematic view of the target chamber can be seen in Fig. 2. After the last beam defining aperture the whole chamber served as a Faraday-cup to collect the accumulated charge. A secondary electron suppression voltage of V was applied at the entrance of the chamber. Each irradiation lasted about 10 hours with a beam current of typically 5 to 10 A. Thus, the collected charge varied between 180 and 360 mC. The current was kept as stable as possible but to follow the changes the current integrator counts were recorded in multichannel scaling mode, stepping the channel in every minute. This recorded current integrator spectrum was then used for the analysis solving the differential equation of the population and decay of the reaction products numerically (see eqs. 5-10 in ref sau97 ).
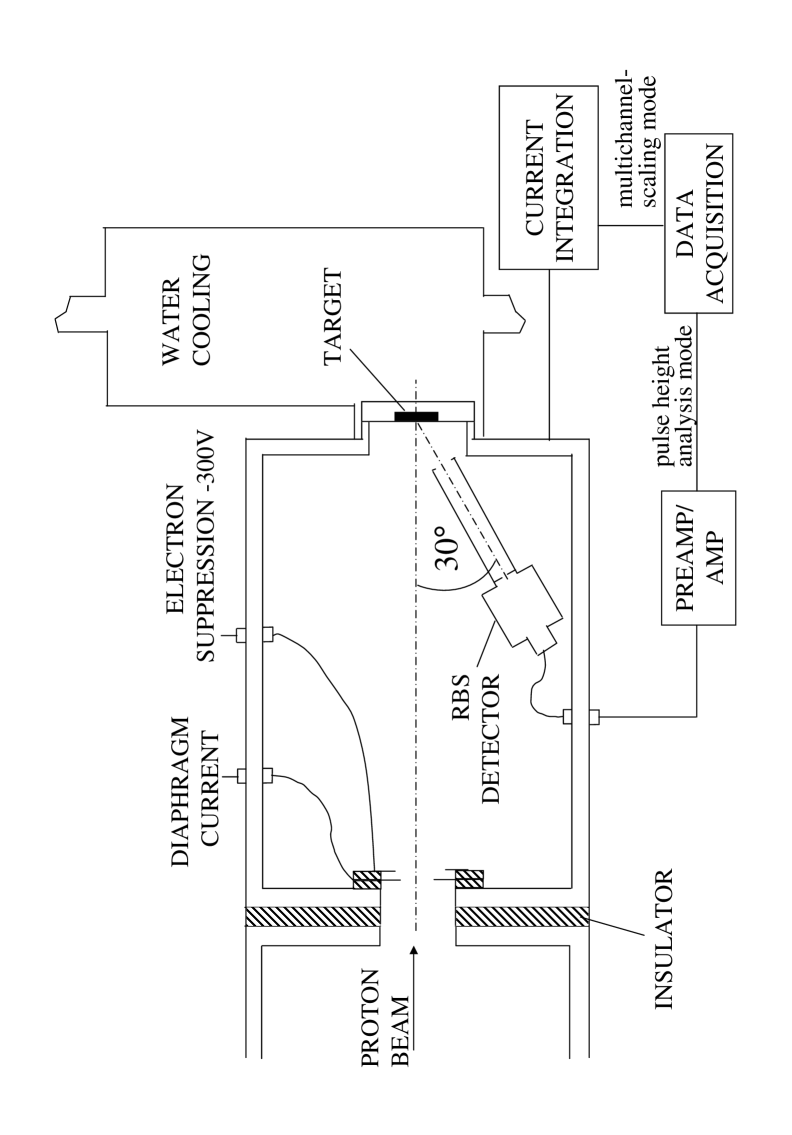
A surface barrier detector was built into the chamber at =150∘ relative to the beam direction to detect the backscattered protons and to monitor the target stability this way. The RBS spectra were taken continuously and stored regularly during the irradiation. In those cases when target deterioration was found, the irradiation was repeated with another target. Final cross section results were derived only from those measurements where no noticable target deterioration was found, i. e. the growth of the Se peak area in the RBS spectrum was uniform with collected charge within the statistical uncertainty (below 1%).
The beam was wobbled across the last diaphragm to have a uniformly irradiated spot of diameter of 8 mm on the target. The target backing was directly water cooled with an isolated water circulating system.
Between the irradiation and -counting, a waiting time of 30 minutes was inserted in order to let the disturbing short lived activities decay.
III.3 Detection of induced -radiation
The radiation following the -decay of the produced Br isotopes was measured with a HPGe detector of 40% relative efficiency. The target was mounted in a holder at a distance of 10 cm from the end of the detector cap. The whole system was shielded by 10 cm thick lead against laboratory background.
The spectra were taken for at least 12 hours and stored regularly in order to follow the decay of the different reaction products.
The absolute efficiency of the detector was measured with calibrated 133Ba, 60Co and 152Eu sources in the same geometry used for the measurement. Effect of the finite sample size (beam spot of 8 mm in diameter) was measured by moving the point-like calibration sources over this surface and measuring the difference in efficiency. This was then included in the 7% error of detector efficiency.
Fig. 3 shows an off-line -spectrum taken after irradiation with 2.5 MeV protons in the first 1h counting interval. The lines used for the analysis are indicated by arrows.
Taking into account the detector efficiency and the relative intensity of the emitted gamma-rays, coincidence summing effects were for all three reactions below 1% and were neglected.

IV Experimental results
Tables 2 – 4 summarize the experimental results for the three studied reactions. The quoted errors of the center-of-mass energies given in the first column correspond to the energy loss in the targets calculated with the SRIM code. The error of the cross section ( factor) values is the quadratic sum of the following partial errors: efficiency of the HPGe detector (7%), number of target atoms (6%), current measurement (3%), uncertainty of the level parameters found in literature (6%), counting statistics (0.1 to 15%).
At = 2.176 MeV proton bombarding energy the 77Se(p,n)77Br reaction channel opens, having the same final nucleus as 76Se(p,)77Br. Thus, above this energy these two reactions cannot be distinguished with the activation technique using targets with natural isotopic abundance. The measured cross section and S–factor values above the threshold are actually the weighted sum of the two cross sections: = + 0.82, where and are the cross sections of 76Se(p,)77Br and 77Se(p,n)77Br, respectively and 0.82 stands for the isotopic ratio of 77Se and 76Se: 7.63%/9.36%.
| Ec.m. | Cross section | factor | |||
|---|---|---|---|---|---|
| [keV] | [barn] | [106 MeVb] | |||
| 1455 | 27 | 3.6 | 0.7 | 5.6 | 1.1 |
| 1569 | 12 | 10.8 | 1.9 | 6.6 | 1.2 |
| 1658 | 22 | 20.8 | 3.2 | 6.4 | 1.0 |
| 1766 | 12 | 41.7 | 6.7 | 6.1 | 1.0 |
| 1858 | 20 | 60.7 | 9.0 | 5.0 | 0.8 |
| 1954 | 22 | 94.0 | 14 | 4.4 | 0.7 |
| 2057 | 18 | 119 | 18 | 3.2 | 0.5 |
| 2159 | 14 | 191 | 28 | 3.1 | 0.5 |
| 2310 | 11 | 366 | 55 | 3.0 | 0.5 |
| 2456 | 13 | 467 | 69 | 2.1 | 0.3 |
| 2752 | 13 | 1039 | 154 | 1.6 | 0.2 |
| 3049 | 12 | 1561 | 231 | 0.98 | 0.15 |
| 3348 | 8 | 1888 | 282 | 0.54 | 0.08 |
| 3547 | 6 | 2966 | 483 | 0.53 | 0.09 |
| Ec.m. | Cross section | factor | |||
|---|---|---|---|---|---|
| [keV] | [barn] | [106 MeVb] | |||
| 1456 | 27 | 9.5 | 0.8 | 14.8 | 1.3 |
| 1569 | 12 | 10.4 | 0.9 | 6.3 | 0.6 |
| 1658 | 22 | 21.8 | 2.2 | 6.8 | 0.7 |
| 1767 | 12 | 59.6 | 6.2 | 8.8 | 0.9 |
| 1859 | 20 | 53.8 | 5.3 | 4.4 | 0.4 |
| 1954 | 22 | 93.1 | 9.2 | 4.4 | 0.4 |
| 2058 | 18 | 147 | 14 | 4.0 | 0.4 |
| 2160 | 14 | 207 | 20 | 3.4 | 0.3 |
| 2311 | 11 | 796 | 78 | 6.5 | 0.7 |
| 2457 | 13 | 1182 | 116 | 5.3 | 0.5 |
| 2753 | 13 | 3200 | 312 | 4.9 | 0.5 |
| 3050 | 12 | 6467 | 631 | 4.0 | 0.4 |
| 3349 | 8 | 11529 | 1143 | 3.3 | 0.3 |
| 3548 | 6 | 17252 | 2044 | 3.1 | 0.4 |
| Ec.m. | Cross section | factor | |||
|---|---|---|---|---|---|
| [keV] | [barn] | [106 MeVb] | |||
| 1258 | 31 | 0.75 | 0.14 | 8.2 | 1.5 |
| 1457 | 27 | 3.6 | 0.3 | 5.6 | 0.5 |
| 1571 | 12 | 11.8 | 1.2 | 7.2 | 0.7 |
| 1660 | 22 | 17.6 | 1.7 | 5.5 | 0.5 |
| 1768 | 12 | 44.1 | 4.3 | 6.5 | 0.6 |
| 1860 | 20 | 79.8 | 7.6 | 6.6 | 0.6 |
| 1956 | 22 | 137 | 13 | 6.5 | 0.6 |
| 2060 | 18 | 219 | 21 | 5.9 | 0.6 |
| 2162 | 14 | 367 | 35 | 6.0 | 0.6 |
| 2313 | 11 | 742 | 71 | 6.1 | 0.6 |
| 2459 | 13 | 1142 | 109 | 5.1 | 0.5 |
| 2755 | 13 | 3330 | 317 | 5.1 | 0.5 |
| 3052 | 12 | 6778 | 647 | 4.2 | 0.4 |
| 3352 | 8 | 12448 | 1208 | 3.6 | 0.4 |
| 3552 | 6 | 19329 | 2257 | 3.5 | 0.4 |
V COMPARISON WITH PREDICTIONS
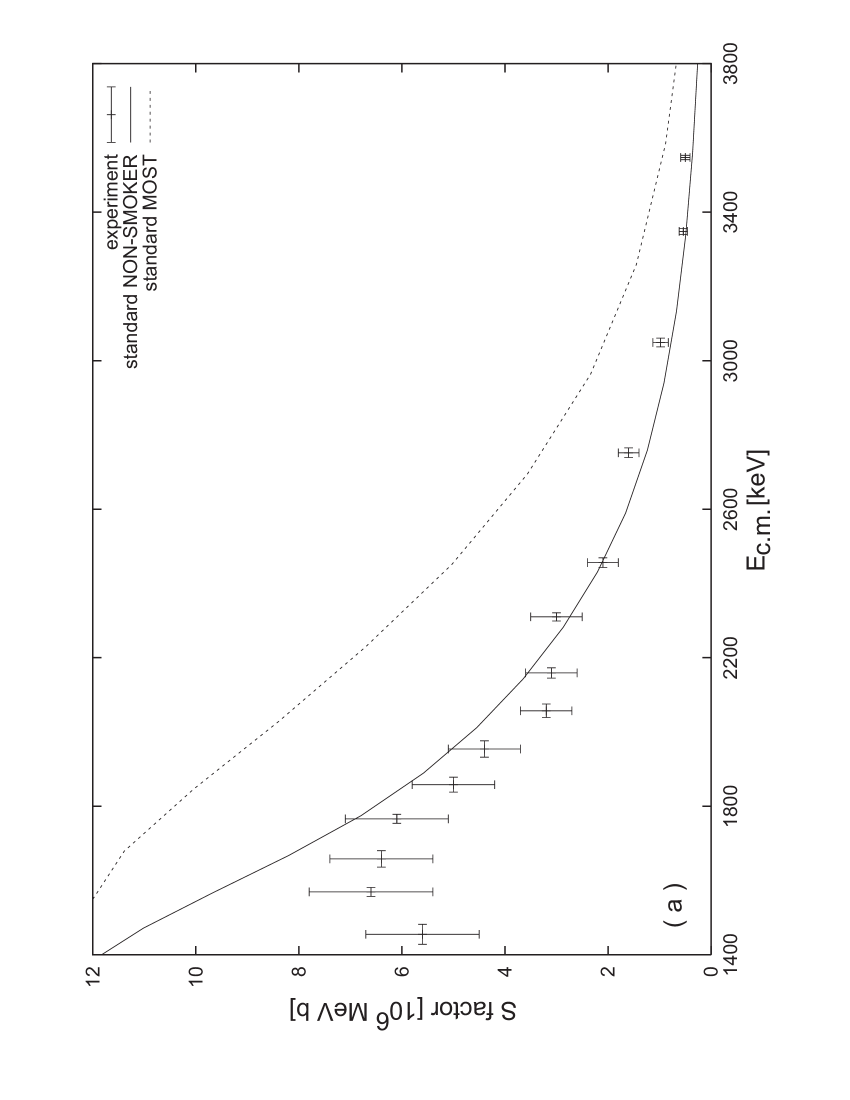
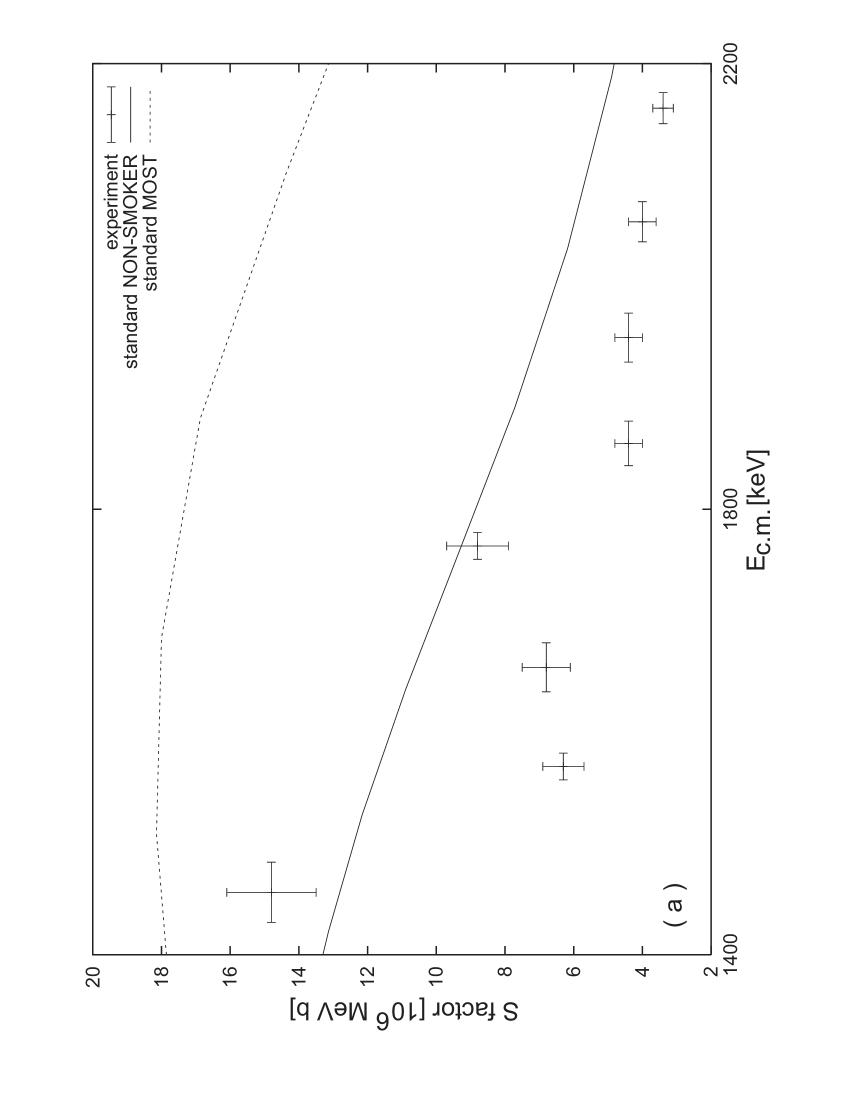
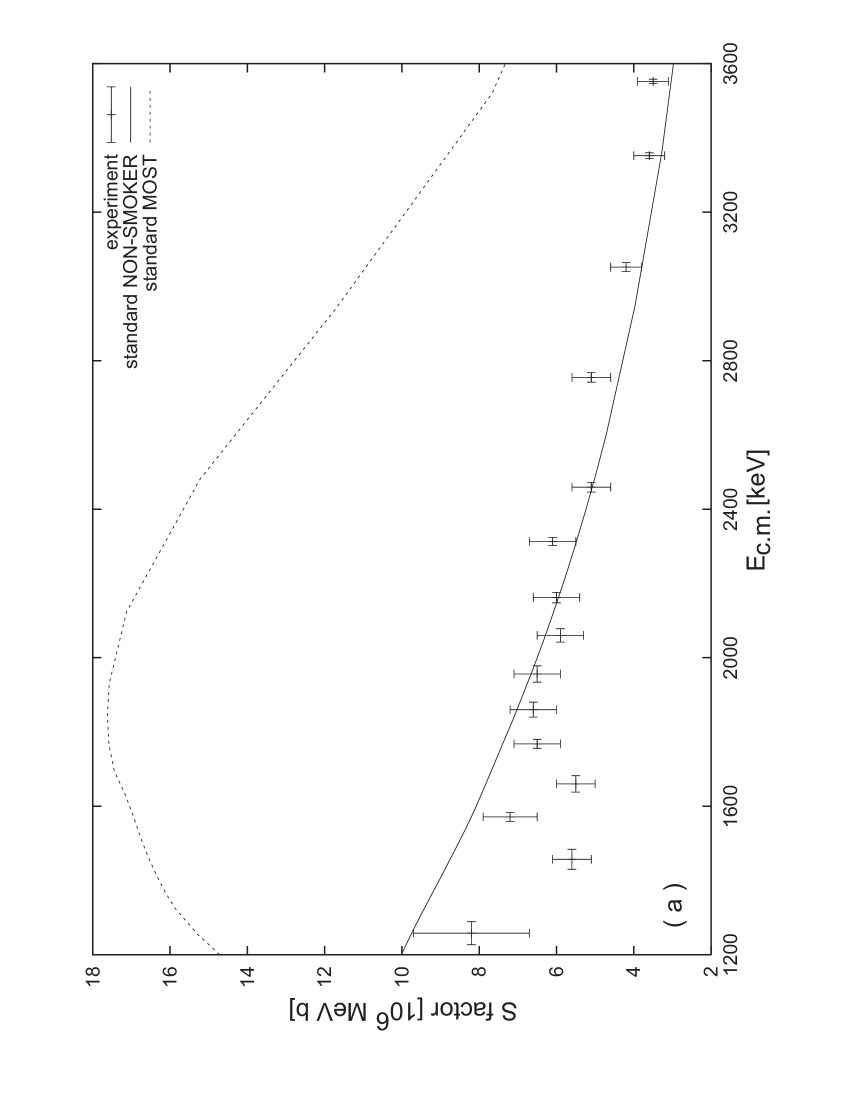
In Figs. 4–6 we show the comparison of the experimental data with theoretical results. At first, we discuss the standard predictions of the Hauser-Feshbach codes MOST and NON-SMOKER, shown in the part (a) of each figure. Two different combinations of nuclear level densities (NLD) and optical potentials (OMP) are used by each code, the OMP of bau with the NLD of dem in MOST, and the OMP of jeu with the NLD of rau in NON-SMOKER. From the figures it is apparent that for the Se isotopes studied herein, the results of the former combination are systematically higher (by a factor of 2) than the latter at all studied energies. Concerning the energy dependence, a decrease at low energy is seen for 82Se(p,n)82Br which seems not to be present in the data. The predictions of the latter input combination are in very good agreement with the data for energies larger than 1.7 MeV in 74Se(p,)75Br, but cannot reproduce the observed energy dependence at smaller energies. They are higher than experiment by factors 1.25–2 for 76Se(p,)77Br above 1.8 MeV and cannot reproduce the experimental variation in the factor at lower energies. They are able to reproduce the data very well for the 82Se(p,n)82Br reaction above 1.7 MeV. Again, the features in the experimental factors below that energy cannot be reproduced. However, the deviations do not exceed a factor of 1.5. As will become evident in Sec. VI, these deviations at the lower end of the measured energy range do not contribute significantly to the astrophysical reaction rate for the temperatures given there.
In summary, contrary to some previous measurements of (p,) reactions (see e.g. gyurky01 ), the standard predictions using the nuclear inputs of jeu ; rau are in good agreement with the present experimental data and most of other proton capture data111Note: Ref. bork98 points out that the theoretical values in sau97 were mistakenly given too high. Using the correct value, there is good agreement also with the experiment of sau97 .. Even more so, if one considers that the calculations use global parameters which are not fine-tuned to the specific nuclei involved. For such global calculations, a 30% deviation averaged over all nuclei is not unusual, similarly to what was found for neutron capture rau . Locally, larger errors are possible, of course. Within this range of uncertainty the predictions agree very well, especially regarding the astrophysical rates as given in Sec. VI. However, as can already be seen from the comparison of the standard predictions, the results are sensitive to the nuclear inputs, even though the reaction mechanism, and thus the reaction model to be applied, is unambiguous. Therefore, to better understand the contributions of different model inputs it is necessary to disentangle the effects of mainly the NLD and the OMP. This will also help to constrain future, improved parametrizations of these nuclear properties. For this purpose, additional calculations were performed using both codes and varying the NLD and OMP models. The combination of NLDs and OMPs used in each calculation are summarized in Table 5. In the following sections, we discuss each reaction separately.
| Label | Level density | Optical potential |
|---|---|---|
| INP-1 111Calculated with MOST 222Standard prediction as available at http://www-astro.ulb.ac.be/Html/hfr.html (version 09/12/2002) | Demetriou & Goriely (2001) dem | Bauge et al. (2001) bau |
| INP-2 11footnotemark: 1 | Demetriou & Goriely (2001) dem | Jeukenne et al. (1977) jeu |
| INP-3 11footnotemark: 1 | Demetriou & Goriely (2001) dem | Koning (2002) kon |
| INP-4 11footnotemark: 1 | Thielemann et al. (1986) thi | Jeukenne et al. (1977) jeu |
| INP-5 333Calculated with NON-SMOKER 444Standard prediction as published in nonsmoker0 ; nonsmoker1 ; also available at http://nucastro.org/reaclib.html | Rauscher et al. (1997) rau | Jeukenne et al. (1977) jeu |
| INP-6 33footnotemark: 3 | Rauscher et al. (1997) rau | equivalent square well holm |
| INP-7 33footnotemark: 3 | Rauscher et al. (1997) rau | Becchetti & Greenlees (1969) bec |
| INP-8 33footnotemark: 3 | Rauscher et al. (1997) rau | Perey (1963) per |
| INP-9 33footnotemark: 3 | Holmes et al. (1976) holm | Jeukenne et al. (1977) jeu |
| INP-10 33footnotemark: 3 | Thielemann et al. (1986) thi | Jeukenne et al. (1977) jeu |
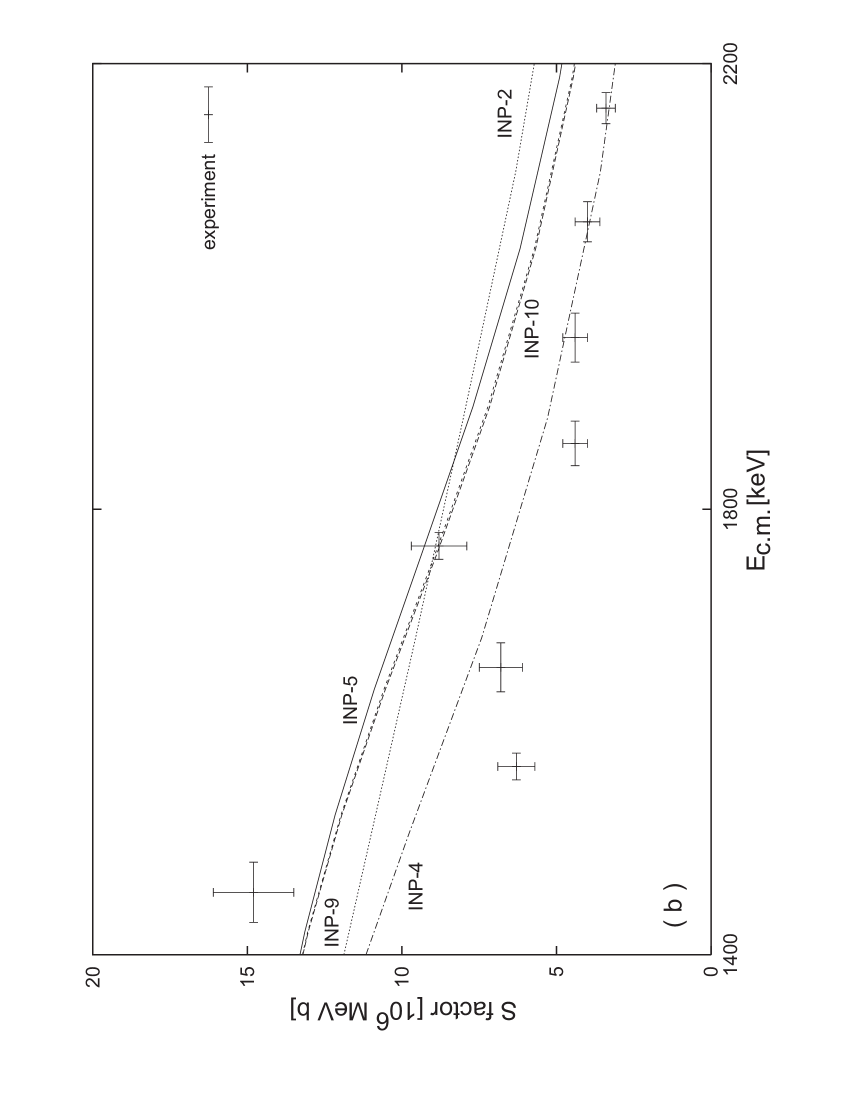
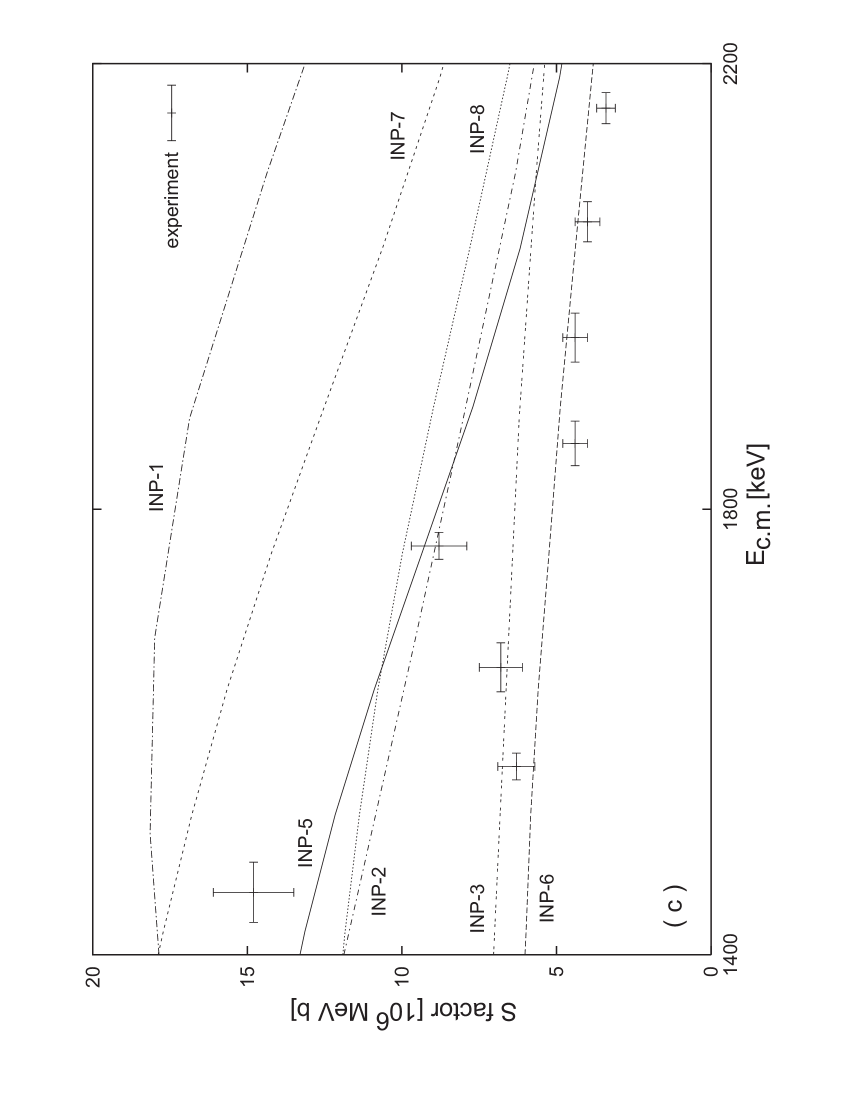
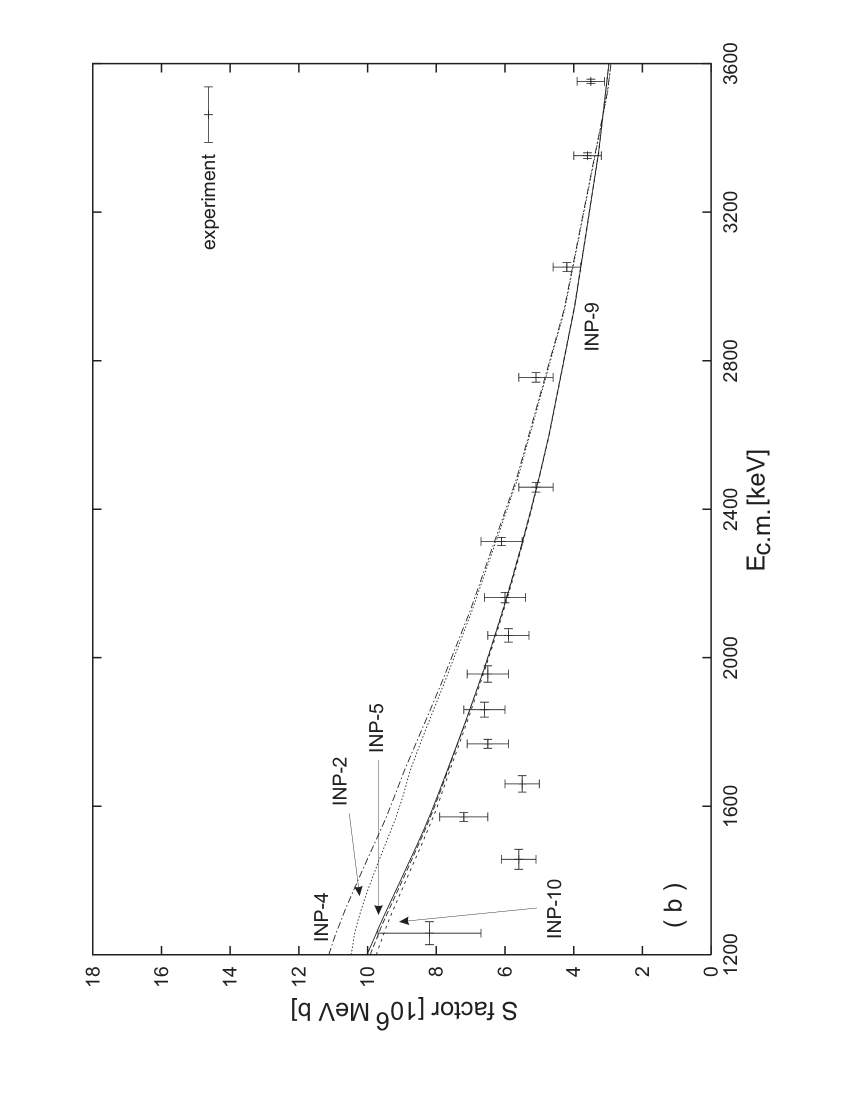
V.1 74Se(p,)75Br
The comparison of the results for different NLDs and OMPs is shown in the parts (b) and (c) of Fig. 4. The labels are explained in Table 5. It should be noted that INP-1 and INP-5 are the default predictions also shown on part (a) in Fig. 4. Moreover, INP-4 and INP-10 both use the same level density and optical potential. The remaining difference between them has to be attributed to further differences in other nuclear inputs (such as the photon width) because the basic approach is the same in both calculations. One has to keep in mind this additional small difference when comparing results obtained from the two codes (results INP-1 to INP-4 and INP-5 to INP-10, respectively).
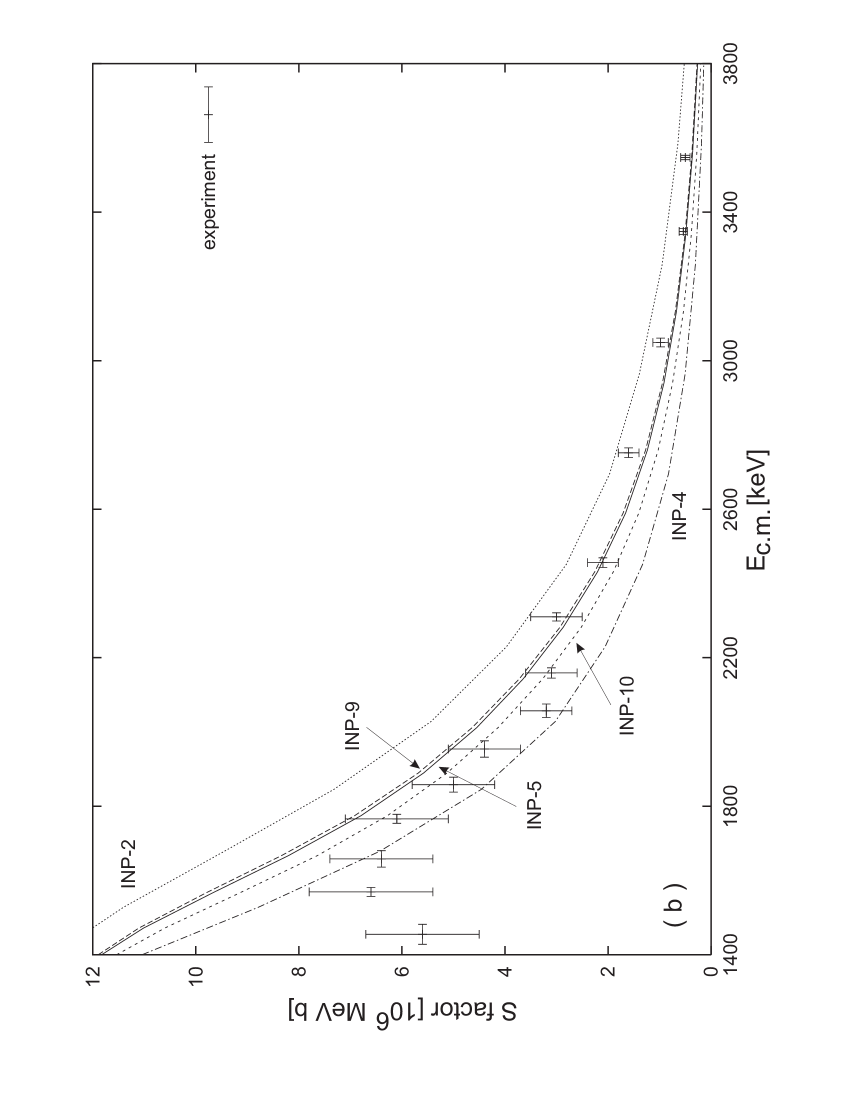
As can be seen from the figure, the dependence on the OMP is much stronger than the sensitivity to the NLD, especially at the lower end of the studied energy range. All of the calculations with the same OMP but different NLDs show a similar energy dependence whereas a change in the potential not only leads to different absolute values but also to different excitation functions. At the low energies studied here, with no other open channels than (p,), the cross section depends only on the incident proton transmission coefficients, the NLD in the compound nucleus determining the photon widths, and the NLD in the target entering the compound-elastic proton channel. The effect of the NLD in the latter channel is small, as transitions with higher proton energies to low-lying states will be dominating and because these states are experimentally and explicitly included in the calculation. From Fig. 4 part (c) it is evident that none of the OMPs are able to reproduce the data at low energies, except for the ones of kon (INP-3) and holm (INP-6). The equivalent square-well potential of holm and the phenomenological OMP of kon are able to give the most satisfactory overall description of the data. The latter phenomenological potential has been obtained for energies from 1 keV up to 200 MeV, using a unique, flat functional form for the energy dependence. This may be the reason why it gives a relatively flatter variation with energy compared to the other OMPs. What is somewhat surprising, is the good agreement obtained with the simple equivalent square-well potential.
The OMPs with the largest deviation are the ones of bec (INP-7) and bau (INP-1). The former OMP has been derived for energies above 20 MeV, so it is not surprising that it fails. The latter is based on microscopic nuclear matter calculations to start with, but has been subsequently re-adjusted to reproduce an extensive database of reaction observables. However, the reliability of the resulting renormalization coefficients has only been tested for energies in the 10–30 MeV range. The overprediction of the data could thus be attributed to inappropriate values of the renormalization coefficients at low energies. Another important effect might be caused by deformation which we further discuss in Sec. VI.
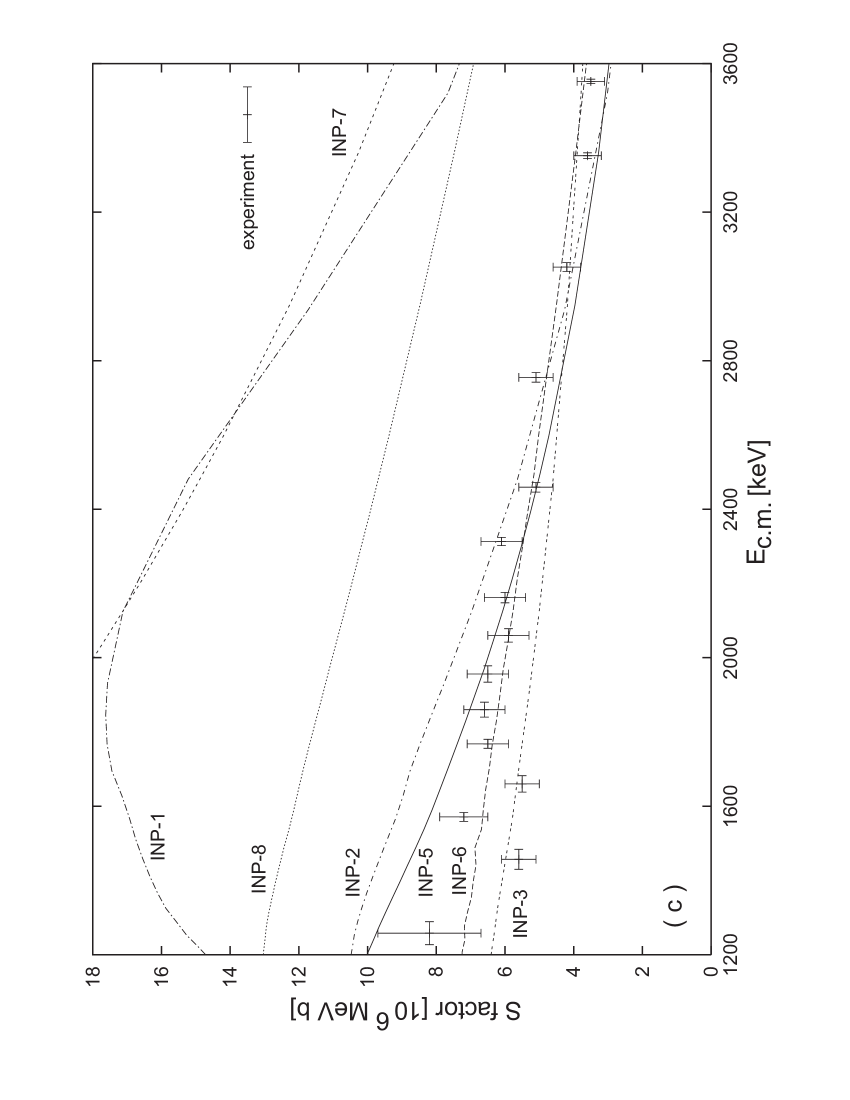
V.2 76Se(p,)77Br
In this case, the data cannot be straightforwardly compared with the predictions because of the complication with the 77Se(p,n) channel. As discussed in Sec. IV, the experiment was not able to distinguish between 76Se(p,) and 77Se(p,n) because they have the same final nucleus 77Br. Therefore, only the points measured below the (p,n) threshold at = 2.176 MeV, are included in the comparison.
The effect of varying the NLDs and the OMPs is shown in Fig. 5. The labels are explained in Table 5. What was said for 74Se(p,) applies equally here. Again, the dependence on the OMP is the strongest one and a large spread in absolute values and energy dependence is found. The OMPs of bec and bau significantly overestimate the data, for the possible reasons mentioned in the previous section. The OMPs of holm and kon give a very flat energy dependence which describes the data well over most of the energy region. On the other hand, the slightly steeper excitation functions obtained with the OMPs of per and jeu are able to give an overall reasonable account of the data.
The low-energy structure found in the experiment (first and fourth data point at the lowest energies) cannot be reproduced by any of the OMPs and it is doubtful whether such a behavior of the factor could be found in a statistical model calculation at all.
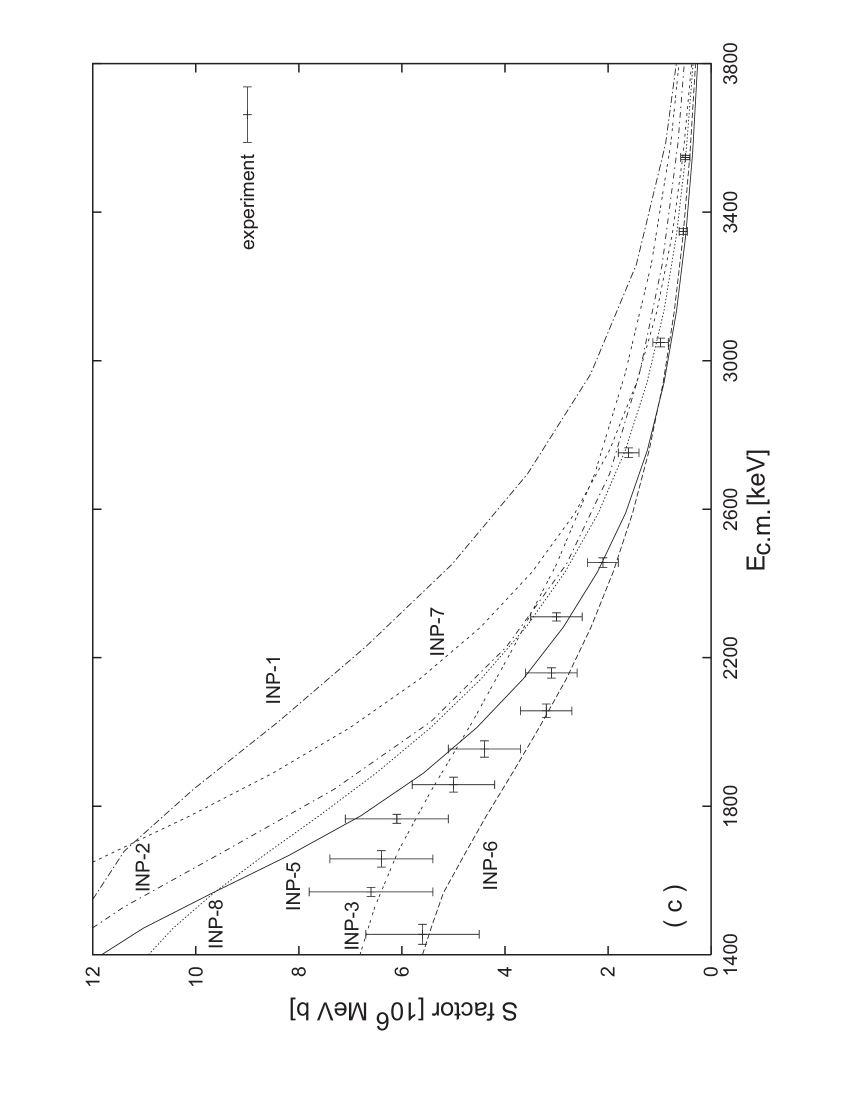
V.3 82Se(p,n)82Br
The effect of different NLDs and OMPs is shown in Fig. 6. The labels are explained in Table 5. What was said for 74Se(p,) in Sec. V.1 applies similarly here.
For this case, the dependence on the optical potential is much stronger than the sensitivity to the NLDs over the whole energy region. The neutron emission channel opens at the energy of 0.8 MeV and rapidly becomes the most dominant channel at all measured energies. In such a case, the HF cross section depends mainly on the incident proton transmission coefficients which is exactly what is observed in the figures. Similar to the results obtained for the other Se isotopes, the OMP of bau (INP-1) and bec (INP-7) overpredict the data by at least a factor of 2. Here, also the potential of per (INP-8) yields a significantly higher factor although the shape of the energy dependence agrees well. Much better is the agreement of the OMP of kon (INP-3). However, its energy dependence is slightly too flat. Again, very good agreement with the data over the whole energy range is found with the equivalent square-well potential of holm (INP-6). The microscopic potential of jeu (INP-2, INP-5) describes well the data above 1.7 MeV but shows a different energy dependence below that energy.
VI Summary and conclusions
We have measured three proton-induced reactions in the astrophysically relevant energy range: 74,76Se(p,)75,77Br, and 82Se(p,n)82Br. Using an activation technique we were able to obtain reaction cross sections and factors in the energy range relevant to the astrophysical process. The new data were compared with predictions of the Hauser-Feshbach statistical theory using global models of OMPs and NLDs. An extensive investigation of the sensitivity of the theoretical calculations to the different inputs was presented. As expected, in this astrophysically relevant low-energy region the results are more sensitive to the OMP than to the NLD. The best overall agreement is obtained with the global microscopic optical potential of jeu and an equivalent square-well potential holm . The latter, somewhat surprising, observation seems to be in contradiction with a previous comparison of rates using these two potentials hoff , where the largest deviations between them were found in the mass range . However, this is strongly energy dependent since in Fig. 4 of hoff the largest deviations arise at even lower proton energies and the differences vanish quickly at higher energies. Likewise, we expect to find larger differences between the predictions with the two potentials when going to even lower energy.
Further good agreement with absolute values of the present data is found with the potential of kon . However, the obtained energy dependence of the factor remains slightly too flat. This is caused by the functional dependence on the energy assumed in the definition of this potential.
The Se isotopes considered here are deformed and therefore deformation effects might be important. For the calculations using the OMPs of jeu ; bec the well-known approach of employing a spherical equivalent to a deformed potential (with a larger diffuseness parameter) was used. However, from our analyses above it can be seen that even a purely spherical potential, such as the equivalent square well, can yield satisfactory results. On the other hand, deformation is important for interpreting the results obtained with the OMP of bau . A significant fraction of the shown deviations is due to the spherical treatment. A further investigation of dependencies on the OMP parameters and how to include deformation effects in OMPs, and more particularly coupled channels calculations, is beyond the scope of this paper.
Reaction rates are the relevant quantities in astrophysical applications. In Tables 6–8 we give such astrophysical reaction rates computed from our data including errors. The temperature range for each reaction was chosen numerically so that all significant contributions to the integration over the proton energy came from within the energy range of our data. Also shown is a comparison to the rates from the standard NON-SMOKER prediction nonsmoker1 ; reaction rates for the cases INP-1 to INP-10 can be derived considering the fact that rates from slowly varying factors scale approximately with the factor. Excellent agreement is found for 74Se(p,)75Br and 82Se(p,n)82Br. This illustrates how deviations with respect to the data are averaged out by the integration involved in the calculation of the reaction rate, especially at the edge of the respective Gamow window. The prediction overestimates the rate of 76Se(p,)77Br + 77Se(p,n)77Br (Table 7) by factors of 1.18–1.77, with better agreement at lower temperature. Thus, the present work confirms the trend seen in previous investigations of proton-induced reactions for intermediate mass targets, namely that there is overall acceptable or good agreement between data and global predictions. Apart from a few cases where some deviations seem to persist independent of nuclear input (Sr isotopes studied in gyurky01 ), the discrepancies between theoretical calculations are not as large as those observed for different optical potentials (see, e.g., som98 ; gled ; dem02 ). This seems to hold for the mass range ful96 ; sau97 ; som98 ; bork98 ; chlo99 ; haris01 ; gyurky01 ; ozkan02 ; galanopulos03 . Nevertheless, more measurements are required to completely cover the relevant mass region and provide constraints on the nuclear input used in Hauser-Feshbach calculations.
| Experimental rate | Prediction nonsmoker1 | ||
|---|---|---|---|
| [109 K] | [cm3 s-1 mol-1] | [cm3 s-1 mol-1] | |
| 2.00 | 2.720 | 5.301 | 3.75 |
| 2.50 | 2.177 | 3.978 | 2.55 |
| 3.00 | 9.454 | 1.663 | 1.02 |
| 3.50 | 2.813 | 4.843 | 2.92 |
| 4.00 | 6.490 | 1.104 | 6.75 |
| 4.50 | 1.251 | 2.115 | 1.33 |
| 5.00 | 2.117 | 3.566 | 2.36 |
| 6.00 | 4.616 | 7.764 | 5.79 |
| Experimental rate | Prediction nonsmoker1 | ||
|---|---|---|---|
| [109 K] | [cm3 s-1 mol-1] | [cm3 s-1 mol-1] | |
| 2.50 | 4.540 | 5.671 | 6.05 |
| 3.00 | 2.189 | 2.590 | 3.17 |
| 3.50 | 7.237 | 8.343 | 1.14 |
| 4.00 | 1.821 | 2.078 | 3.18 |
| 4.50 | 3.758 | 4.275 | 7.42 |
| Experimental rate | Prediction nonsmoker1 | ||
|---|---|---|---|
| [109 K] | [cm3 s-1 mol-1] | [cm3 s-1 mol-1] | |
| 1.50 | 1.610 | 1.541 | 2.07 |
| 2.00 | 4.561 | 4.639 | 4.91 |
| 2.50 | 4.377 | 4.515 | 4.45 |
| 3.00 | 2.231 | 2.333 | 2.32 |
| 3.50 | 7.519 | 7.982 | 8.52 |
| 4.00 | 1.907 | 2.054 | 2.45 |
Acknowledgements.
This work was partially supported by OTKA (T034259, T042733, F043408), the NATO CRG program (CRG961086), the Greek-Hungarian bilateral collaboration program (GSRT/Demokritos/E797), and the Swiss NSF (2000-061031.02). The authors are grateful to I. Borbély-Kiss for carrying out the PIXE measurements. Gy. Gy. and Zs. F. are Bolyai fellows. T. R. is a PROFIL professor (Swiss NSF 2024-067428.01).References
- (1) M. Rayet, M. Arnould, M. Hashimoto, N. Prantzos, and K. Nomoto, Astron. Astrophys. 298, 517 (1995).
- (2) S. E. Woosley and W. M. Howard, Astrophys. J. 354, L21 (1990).
- (3) T. Rauscher, A. Heger, R. D. Hoffman, and S. E. Woosley, Astrophys. J. 576, 323 (2002).
- (4) M. Arnould and S. Goriely, Phys. Rep. 384, 1 (2003).
- (5) W. M. Howard, B. S. Meyer, and S. E. Woosley, Astrophys. J. 373, L5 (1991).
- (6) S. Goriely, J. José, M. Hernanz, M. Rayet, and M. Arnould, Astron. Astrophys. 383, L27 (2002).
- (7) H. Schatz et al., Phys. Rep. 294, 167 (1998).
- (8) H. Schatz et al., Phys. Rev. Lett. 86, 3471 (2001).
- (9) Zs. Fülöp, Á. Z. Kiss, E. Somorjai, C.E. Rolfs, H.P. Trautvetter, T. Rauscher, and H. Oberhummer, Z.Phys. A355, 203 (1996).
- (10) T. Sauter and F. Käppeler, Phys. Rev. C 55, 3127 (1997).
- (11) E. Somorjai, Zs. Fülöp, Á. Z. Kiss, C. Rolfs, H-P. Trautvetter, U. Greife, M. Junker, S. Goriely, M. Arnould, M. Rayet, T. Rauscher, and H. Oberhummer, Astron. Astrophys. 333, 1112 (1998).
- (12) J. Bork, H. Schatz, F. Käppeler, and T. Rauscher, Phys. Rev. C 58, 524 (1998).
- (13) F. R. Chloupek, A. St J. Murphy, R. N. Boyd, A. L. Cole, J. Görres, R. T. Guray, G. Raimann, J. J. Zach, T. Rauscher, J. V. Schwarzenberg, P. Tischauser, and M. C. Wiescher, Nucl. Phys. A652, 391 (1999).
- (14) S. Harissopulos, E. Skreti, P. Tsagari, G. Souliotis, P. Demetriou, T. Paradellis, J. W. Hammer, R. Kunz, C. Angulo, S. Goriely, and T. Rauscher, Phys. Rev. C 64, 055804 (2001).
- (15) Gy. Gyürky, E. Somorjai, Zs. Fülöp, S. Harissopulos, P. Demetriou, and T. Rauscher, Phys. Rev. C 64, 065803 (2001).
- (16) N. Özkan, A. St. J. Murphy, R. N. Boyd, A. L. Cole, M. Famiano, R. T. Güray, M. Howard, L. Şahin, J. J. Zach, R. deHaan, J. Görres, M. C. Wiescher, M. S. Islam, and T. Rauscher, Nucl. Phys. A710, 469 (2002).
- (17) S. Galanopoulos, P. Demetriou, M. Kokkoris, S. Harissopulos, R. Kunz, M. Fey, J. W. Hammer, Gy. Gyürky, Zs. Fülöp, E. Somorjai, and S. Goriely, Phys. Rev. C 67, 015801 (2003).
- (18) T. Rauscher and F.-K. Thielemann, in ”Stellar Evolution, Stellar Explosions, and Galactic Chemical Evolution”, ed. A. Mezzacappa (IOP, Bristol 1998), p. 519.
- (19) T. Rauscher and F.-K. Thielemann, At. Data Nucl. Data Tables 75, (2000) 1.
- (20) T. Rauscher and F.-K. Thielemann, At. Data Nucl. Data Tables 79, (2001) 47; see also http://nucastro.org/reaclib.html
- (21) S. Goriely, in Nuclei in the Cosmos V, Edition Frontières Paris, 314 (1998); see also http://www-astro.ulb.ac.be
- (22) W. Hauser and H. Feshbach, Phys. Rev. 87, 336 (1952).
- (23) A. R. Farhan and S. Rab, Nucl. Data Sheets 60, 735 (1990).
- (24) A. R. Farhan and B. Singh, Nucl. Data Sheets 81, 417 (1997).
- (25) M. M. King and W.-T. Chou, Nucl. Data Sheets 76, 285 (1995).
- (26) I. Borbély-Kiss, E. Koltay, S. László, Gy. Szabó, and L. Zolnai, Nucl. Instr. Meth. in Phys. Res. B12, 496 (1985).
- (27) J. F. Ziegler and J. P. Biersack, Code SRIM, Version 2003.20.
- (28) E. Bauge et al., Phys. Rev. C 63, 024607 (2001).
- (29) P. Demetriou and S. Goriely, Nucl. Phys. A695, 95 (2001).
- (30) J. P. Jeukenne, A. Lejeune, and C. Mahaux, Phys. Rev. C 16, 80 (1977).
- (31) T. Rauscher, F.-K. Thielemann, and K.-L. Kratz, Phys. Rev. C 56, 1613 (1997).
- (32) A. Koning, in Reference Input Parameter Library, IAEA-Tecdoc, in press
- (33) F.-K. Thielemann, M. Arnould, and J. W. Truran, in Advances in Nuclear Astrophysics, ed. E. Vangioni-Flam et al., Edition Frontieres, Gif-sur-Yvette, 525 (1986).
- (34) J. Holmes, S. E. Woosley, W. Fowler, and B. Zimmerman, At. Data Nucl. Data Tables 18, 305 (1976).
- (35) F. D. Becchetti and G. W. Greenlees, Phys. Rev. 182, 1190 (1969).
- (36) F. G. Perey, Phys. Rev. 131, 745 (1963).
- (37) R. D. Hoffman, S. E. Woosley, T. A. Weaver, T. Rauscher, and F.-K. Thielemann, Astrophys. J. 521, 735 (1999).
- (38) Yu. M. Gledenov, P. E. Koehler, J. Andrzewskij, K. H. Guber, and T. Rauscher, Phys. Rev. C 62, 042801 (2000).
- (39) P. Demetriou, C. Grama, and S. Goriely, Nucl. Phys. A707, 253 (2002).