Measurement of Electron Backscattering
in the Energy
Range of Neutron -Decay
Abstract
We report on the first detailed measurements of electron backscattering from low targets at energies up to 124 keV. Both energy and angular distributions of the backscattered electrons are measured and compared with electron transport simulations based on the Geant4 and Penelope Monte Carlo simulation codes. Comparisons are also made with previous, less extensive, measurements and with measurements at lower energies.
I Introduction
Backscattering of electrons from the surfaces of bulk materials has been studied at low energies largely in relation to materials science applications (e.g. Auger electron spectroscopy and scanning and transmission electron microscopy). For this reason, most detailed studies have been conducted for incident electron energies less than 40 keV Gérard et al. (1995); Massoumi et al. (1992, 1993). At higher energies ( 1 MeV) sophisticated Monte Carlo calculations exist Agostinelli et al. (2003) that are constrained to reproduce data obtained for nuclear or particle physics applications. However in the intermediate regime () there is little data to constrain the simulations. This intermediate energy regime can be important for various beta spectroscopy applications, in particular neutron beta-decay ().
Most of the data that exists in this energy region is based on measurements using electron beams and detecting the backscattering from bulk targets using electrical currents in Faraday cups (for a recent review, see Ref. T. Tabata and Shinoda (1999)). In particular, for carbon and aluminum targets, extensive measurements using this technique exist. We have made measurements for beryllium and silicon targets using this technique, and have investigated the effects of secondary electron emission on these types of measurements. In addition, we have conducted measurements using ion-implanted silicon detectors to detect the energy and angle of backscattered electrons, extending the work of Refs. Gérard et al. (1995); Massoumi et al. (1992, 1993) to higher energies. In this way, we can evaluate the reliability of existing models to reproduce the dependence of the backscattering process on energy and emission angle of the backscattered electrons.
The results of these measurements can have a variety of nuclear and particle physics applications. For example, an upcoming measurement of the electron correlation in polarized neutron decay Bowles and Young co-principal investigators (2000) will require an understanding of electron backscattering at the 10-20% level. In this experiment plastic scintillator and silicon multi-strip detectors will be used, thus requiring detailed information on backscattering for low targets. As a first step in addressing this problem, we have carried out detailed measurements of the energy and angular distributions of backscattered electrons from light materials (Be and Si) for incident electron energies between 43.5 and 124 keV.
II Experiment Overview
The experiment consisted of an electron gun and a scattering chamber containing a movable target. Two modes of running were used where backscattering data could be acquired. In one mode the silicon detector was used to detect the energy and angle of backscattered electrons. In a second higher-current mode the electrical current due to the backscattered electrons incident on the chamber walls was detected. These two modes will be referred to as silicon detector mode and current integration mode, respectively. Each component of the experiment will be described in greater detail.
II.1 The Electron Gun
The Kellogg Electron Gun was constructed in order to perform these measurements. A schematic of the gun is shown in Fig. 1.

Electrons were extracted from a hot filament by a potential of typically 6 kV, in the source head. The electrons were focused by an Einzel lens before passing through an additional acceleration potential of up to 130 kV minus the extractor voltage.
The electron beam current could be varied from a few electrons per second to several A, by adjusting the current passed through the filament. The resultant beam current remained stable after allowing the filament to warm up for typically half an hour.
After the acceleration column, two magnetic coils allowed steering of the beam in the horizontal and vertical directions.
A Faraday cup could be inserted into the beam to monitor the total current of the beam. A beam position monitor, consisting of a rotating wire which sweeps through the beam twice along two orthogonal axes, could be used to locate the beam within the beam pipe.
The energy of the electron gun was stable and reproducible. The energy was absolutely determined to the 1% level using a novel Helmholtz coil spectrometer. This spectrometer is iron-free and has a momentum resolution of 0.3% Yuan et al. (2001). The energy of the electron gun was found to be monochromatic to better than the resolution of the spectrometer.
II.2 Chamber, Targets and Detector
A schematic of the chamber and detector arrangement used to perform the backscattering measurements is shown in Fig. 2.

The chamber contained a target and a silicon detector on separately rotatable feedthroughs. The chamber, target, and detector were each separately isolated from ground. The electric currents detected by the chamber and the target were integrated using two Ortec model 439 current digitizers.
The targets The Goodfellow Corporation, 800 Lancaster Avenue, Berwyn, PA 19312-1780 were multiple stopping lengths of beryllium and silicon. Two different beryllium targets of nominal thicknesses 1.0 mm and 2.0 mm were used. Two different silicon targets of thickness 1.0 mm were used. The targets were 25 mm by 25 mm square, and were held at one corner in a slotted rod by a set screw. The beryllium targets were nominally 99.0% pure, and had a metallic appearance and the polycrystalline silicon target was nominally 99.999% pure.
The energy and angular distribution of the backscattered electrons was measured using an Ortec ion-implanted silicon detector (Ortec model BU-13-25-300, 25 mm2 nominal active area and 300 m nominal depletion depth at 100 V bias). The detector was mounted on a rotatable arm which allowed it to be placed at an arbitrary angle with respect to the target. The target to detector distance was typically 8.5 cm. The detector linearity and resolution was calibrated by placing the detector in the electron beam at very low beam current ( 100 Hz). The detector linearity was confirmed to the sub-kilovolt level for these experiments. The energy resolution of the silicon detector was found to be typically to 3.5 keV, and the resolution was independent of energy to less than 0.1 keV.
For fixed filament current, the current detected on the target was maximized in order to tune the beam. The beam tunes for each energy were stored on the computer that controlled the power supplies of the accelerator. In addition, tunes were checked using a scintillator target coated with graphite which produced a visible spot ( 3 mm 3 mm) indicative of the beam spot size when struck with sufficient current (typically 1 nA).
III Backscattering Measurements
Backscattering measurements were performed for normal incidence upon the target. Measurements were performed for incident electron energies of 43.5, 63.9, 83.8, 104, and 124 keV. For each energy, both silicon detector mode and current integration mode measurements were taken.
III.1 Silicon Detector Mode
In the silicon detector mode, silicon detector spectra were acquired for backscattered electron angles of 20 to 80 degrees in steps of 10 degrees. The backscattered angle was defined with respect to the normal of the target, as shown in Fig. 2.
When the beam was off, the detector rate was typically 100 Hz, due to low energy noise. The detector rate with beam on was typically 5 kHz, and was always kept below 20 kHz, to limit ADC pile-up to below 3% on average across the spectrum. The beam current for each target and detector angle was therefore different, due to the different levels of backscattering. For Si, the current was typically 40 pA, while for Be, it was 300 pA.
Fig. 3 shows normalized spectra taken using the silicon detector for a variety of detector angles for 124 keV electron beam energy and the beryllium target.
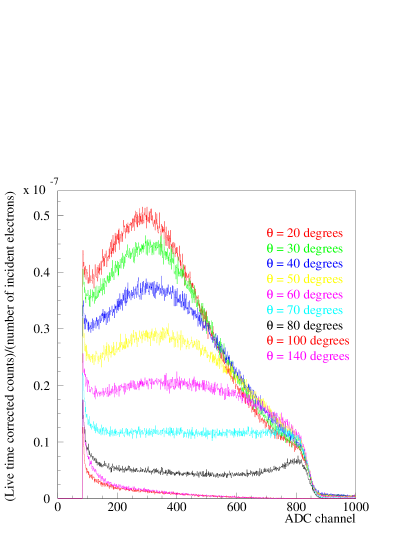
The data are plotted as a function of the digitized pulse height (ADC channel), which is proportional to the energy deposited in the silicon detector. The data are not corrected for the response of the silicon counter, which had a resolution of about 2.5 keV, and itself suffered from backscattering. Below about 20 keV, contributions from noise in the detector and electronics contributed to the count rate at the few percent level, and so no data is shown beneath that threshold.
A detector rate above electronic noise was also detected for angles , where the detector is shielded from any direct backscattering. It can be seen that the rates at and are significant, especially compared to e.g. the measurements. The flux found at was determined to be due to rescattering from the walls of the chamber, and was confirmed in Monte Carlo studies. In these studies, backscattering from the steel walls and lid of the chamber were included. The chamber floor, dominantly aluminum, had relatively little effect on the chamber background and was not included. The Monte Carlo calculations showed that electrons at could be produced, and that the result was numerically about 50% larger than the observed chamber background. The disagreement is attributed to the use of a simplified geometry in the Monte Carlo, and uncalibrated treatment of backscattering from these sources.
Motivated by the simulation, experimental studies were carried out lining the chamber walls with stopping thicknesses of aluminized mylar (which has a much lower backscattering fractions). This was found to reduce the chamber background by roughly 50%, a figure in agreement with expectations based on the Monte Carlo.
Based on the Monte Carlo simulations, the data is expected to represent most closely the chamber background for the data, and to represent an upper bound on the chamber background for the other angles. So the data was subtracted from the data to arrive at the background-subtracted spectrum. The systematic error in using this subtraction scheme is 3-5% for 124 keV beam energy, peaked at low energy deposition, and is smaller for lower beam energy (as more of the chamber background is moved into the unmeasured region dominated by detector noise).
From Monte Carlo studies and analytical estimations, it was also determined that contributions from X-rays were negligible in both flux (compared to electron backscattering) and in detection efficiency (for the 300 m thick detector used). Therefore no corrections were made for X-rays.
III.2 Systematic uncertainties for silicon detector measurements
Table 1 summarizes the systematic uncertainties for the silicon detector measurements.
| Effect | Uncertainty |
|---|---|
| reproducibility | 7% |
| active area | 4% |
| beam spot size | 5% |
| deadtime | 3% |
| alignment | 2% |
| current detection | 3% |
| Total | 12% average |
Each effect in the table will now be described in more detail.
Measurements of the backscattered electron yield in the silicon detector were found to be reproducible at the 7% level. The detector active area was measured using an alpha source and various collimators, and found to be consistent with the geometry of the detector to about 4%. The beam spot size and detector size were also measured by scanning the beam across the detector. The detector size was again found to be in agreement with the directly measured value. At the same time, it was observed that no significantly different response for electrons could be seen for the detector as one varied the position of the beam on the detector surface. A simple silicon response function including only normal-incidence backscattering was therefore used to convolute Monte Carlo predictions for comparison with the data (see section V). The beam spot radius was found to be about 1.7 mm, and the beam was always well-centered on the target to this level, limiting a solid angle correction from finite spot size to less than . Deadtime corrections varied between and . However, ADC pile-up was kept below 3% and the deadtime corrections could be performed reliably at that level, using information from fast scalers counting the triggers.
The relative alignment of the beam, target, and detector in the plane of rotation of the detector was measured to the level of 0.5 degrees. This was confirmed by taking measurements of electron backscattering at both positive and negative . The residual systematic error due to alignment problems was estimated to be about 2%.
The silicon measurements were normalized to the total current detected by the chamber and target. The detection of current was calibrated using a precision picoampere source, and comparison among several well-calibrated picoammeters. The calibration agreed each time at the level 0.3 pA, giving a worst case contribution to the normalization uncertainty of 3%. Integration of low-energy secondary electrons was not a factor for this measurement of current, since the total charge on the chamber and target was collected.
The total normalization systematic uncertainty after background subtraction was therefore 12%, dominated by reproducibility and detector solid angle uncertainties.
III.3 Current Integration Mode
For each energy, current integration mode measurements were also performed. By separately sensing the currents on the target () and the chamber (), the total normal-incidence backscattered fraction was determined via:
| (1) |
Low energy secondary electrons may be emitted from the surfaces of materials after higher energy electrons strike the surface. In previous experiments, secondary electrons were typically defined to have eV. If the fraction of secondary electrons produced per high-energy interaction is large, the sensed currents will give an erroneous measure of the high-energy backscattered fraction.
To suppress and quantify the effects of secondary electrons, a cylindrical “cage” of wires (referred to as the grid) was inserted into the setup to provide a potential wall between the chamber and the target. This grid was made of 50 m tungsten wire, wrapped on a cylindrical copper frame of radius 6 cm and height 8 cm. The grid had 22 vertical wires evenly spaced on the sides. The wires met at the bottom, but had an opening at the top so that the target rod (which holds the target) could be inserted. The grid, target, and chamber could each be biased at different voltages up to a difference of 200 V with leakage currents between elements kept to below 1 pA.
III.4 Systematic Uncertainties for Current Integration Measurements
Table 2 summarizes the systematic uncertainties encountered for the current integration measurements.
| Effect | Uncertainty |
|---|---|
| target rod correction | 7% |
| grid secondaries | 1% |
| reproducibility | 5% |
| current dependence | 3% |
| Total | 9% |
Each of these uncertainties will now be described in more detail.
It was found that biasing the grid at roughly -50 V relative to the chamber and target caused secondaries created on the chamber and target to be recollected by the chamber and target. When the target was biased to +50 V, and the chamber held at ground, the effect of changing the grid voltage from zero to -50 V resulted in changes of 10-30%, depending on the target material and the beam energy. This agreed well with estimates of the effect based on the Penelope Monte Carlo code, and based on measurements of secondary electron emission summarized in Refs. Joy (1995); Bronshtein and Denisov (1965b, a).
Due to a small piece of the conducting target rod (held at the same potential as the chamber) penetrating into the top of the grid, there was a residual correction still to be made for secondaries. In the data, this showed up as a residual dependence of on the relative target/chamber voltage, even when the grid was set to very large voltages. It was found that a correction could be made using the solid angle subtended by that piece of the target rod, and the value of determined when the grid was not used. This correction amounted to a 7% contribution to the systematic uncertainty in the determination of .
Secondaries due to high-energy electrons striking the grid could be accounted for at the 1% level. Measurements of under widely varying beam conditions showed that it was reproducible at the 5% level.
The current dependence of was also studied from pA to A in incident beam current, and found to vary at the 3% level. This indicated that electrostatic charging of various non-conducting components in the setup contributed at a small level.
The total fractional systematic uncertainty in determined from these current-mode measurements was therefore 9%.
IV Results
IV.1 Silicon Detector Mode
The normalized, background-subtracted spectra accumulated for various detector angles for 124 keV electrons normally incident on silicon and beryllium bulk targets are shown in Fig. 4.
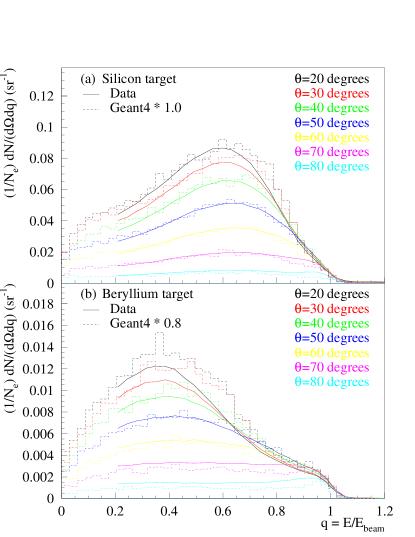
The Monte Carlo curves will be described in Section V. The data are plotted as a function of the dimensionless energy , where is the energy detected by the silicon detector and is the energy of the incident electrons, in this case 124 keV. On the vertical axis, , the number of counts per incident electron, per unit , per unit solid angle is plotted. In the absence of the effects of detector response (resolution and backscattering), this would be the normal-incidence backscattered fraction per unit , per unit solid angle.
In Fig. 4a., for silicon, for small backscattered angles (), a peak is found near , and a shoulder found near . As the backscattered angle increases, the peak at tends to disappear and shift slightly to higher , while the shoulder at tends to become more pronounced as events at lower disappear.
The same trends can be seen in the spectra for a beryllium target, shown in Fig. 4b. However, in this case, the low-energy peak appears closer to . This can be explained by the beryllium having smaller Rutherford scattering cross section. Electrons therefore penetrate more deeply into the material before scattering.
The silicon results compare well qualitatively with the results of Refs. Gérard et al. (1995); Massoumi et al. (1992, 1993), which were acquired at lower energies on silicon and aluminum targets. It is difficult to compare directly with these measurements. For Ref. Massoumi et al. (1992, 1993), no data is published above 35 keV and more data are displayed for oblique incidence. Ref. Gérard et al. (1995), while providing data at 40 keV, gives no absolute normalization.
The dependence on beam energy was also investigated. Fig. 5 shows the dependence of the backscattered fraction on both the beam energy and the energy of the backscattered electron, integrated over all possible backscattered angles.
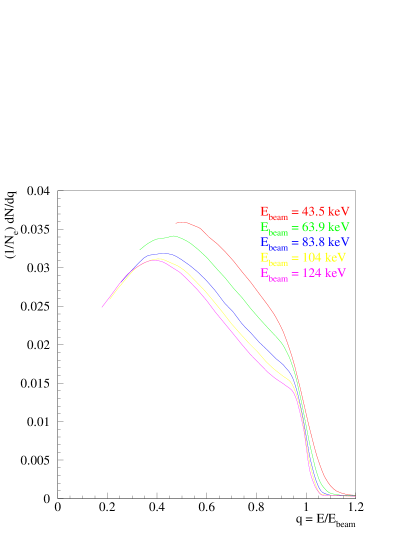
The integration over angle was performed using a finite sum with bins centered on each measured angle, and the appropriate solid angle weighting. A small correction due to the unmeasured regions at small and large angles was included. The systematic uncertainty in approximating the integral by the sum was typically 4%, from comparison with analytical forms. Angular bin centering corrections were found to be negligible, due to the smoothness of the angular behavior. The overall systematic uncertainty was consequently increased to 13%.
As seen in Fig. 5, when plotted in terms of the dimensionless variable , the curves nearly overlap. The same qualitative behavior can be seen as a function of beam energy for individual backscattered angles. The data are therefore observed to follow a near-scaling behavior. The overall normalization follows the energy dependence of the total normal-incidence backscattered fraction.
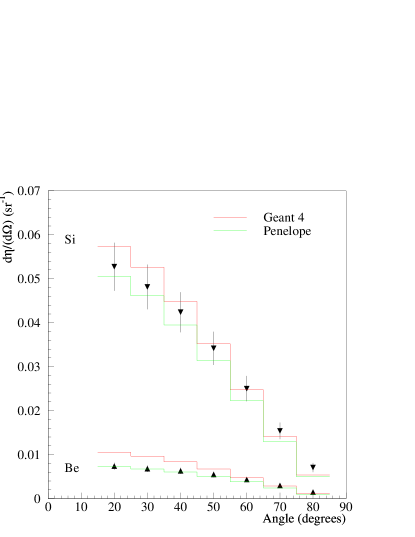
The angular dependence of the missed backscattered fraction can be determined by integrating over energy the data of Fig. 4. The result is shown in Fig. 6.
A linear fit based on the first 20 keV of data above the analysis cut was used to extrapolate to 50 eV (the defined threshold for secondary electrons), so that these integrals and subsequent integrals could be compared with the current integration measurements. In order to estimate the reliability of the fit, an additional systematic uncertainty was assigned to the extrapolation, based on comparison of this fit to a fit constrained to pass through zero at zero energy. For 124 keV beam energy, this extra systematic uncertainty was of order a few percent.
In order to better estimate the systematic uncertainty in this extrapolation, simulations were performed using Geant4 and Penelope in the unmeasured region 50 eV to 20 keV. In the Geant4 simulation, the backscattered fraction was found to tend toward zero at small backscattered electron energy, in fair agreement with the linear extrapolation method. In the Penelope simulation, the backscattered fraction was found to rise steadily as the threshold of the simulation was reduced. In the range 100 eV to 10 keV, Penelope gave about 10% extra contribution to the integral compared to linear extrapolation, for beryllium, and an extra 4% for silicon. To average between the extrapolations implied by Geant4 and Penelope, an additional 5% contribution was added to the beryllium data, and an additional 2% contribution was added to the silicon data. The additional uncertainty in each case was taken to be the size of the correction.
The data were integrated over angle, using the same method described in relation to Fig. 5, to determine the total normal-incidence backscattered fraction. The results of this integration are shown in Fig. 7 and are compared with current integration measurements (described in section IV.2) and Monte Carlo simulations (described in Section V).
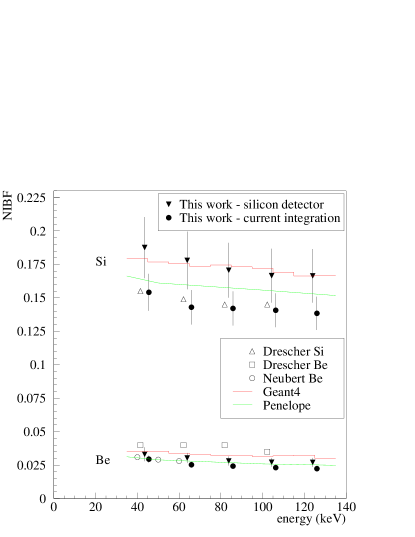
In Fig. 7, the total systematic uncertainty, including extrapolation to 50 V and extrapolation over unmeasured angles, is plotted.
IV.2 Current Integration Mode
The results for based on our current integration measurements are also shown in Fig. 7.
The silicon detector measurements are found to be systematically higher than the current-mode measurements; however, the two methods of are found to agree within the systematic uncertainties. In the case of the current integration method, this systematic uncertainty is dominated by residual correction for secondary electron collection due to the penetration through the grid of the target rod. In the case of the silicon detector measurements, it is dominated by reproducibility of the measurements under varying conditions, and by uncertainties in alignment and solid angle effects.
The data are also compared with previous data on Be and Si targets due to Drescher et al. H. Drescher and Seidel (1970) and with data on Be due to Neubert et al. Neubert and Rogashewski (1980). Both groups used current integration techniques to arrive at their results. Neubert et al. Neubert and Rogashewski (1980) in particular used a second target apparatus to study the effects of secondary electrons, as opposed to the grid used in this work. Only the subsets of their data that overlap the region 43.5 to 124 keV are plotted. The Drescher data on Be are systematically higher than the Neubert data. However, due to the lack of additional data on this element, it is impossible to say which is more accurate. Our data tend to agree with the Neubert data, as do the data of Massoumi et al. Massoumi et al. (1992, 1993) taken below 40 keV.
Our data on Si is in good agreement with those of Drescher, and tend to suggest that there could be some systematic effect in either the current integration or silicon detector data for that element. Given the current level of the systematic uncertainties, it is difficult to make a firm statement.
V Comparison with Monte Carlo
Monte Carlo simulations were conducted using the Geant4 Monte Carlo Agostinelli et al. (2003) and the Penelope Monte Carlo Sempau et al. (1997).
The version of Geant4 used was 4.4.0. In order to achieve a reasonable description of backscattering, it was found that three parameters had to be changed from their default values: the maximum step size, the threshold to create secondaries, and a parameter originally introduced into Geant4 to tune low-energy EM processes. For all our simulations, the maximum step size was set to the range of a 1 keV electron; the threshold to create secondaries was set to 1 m; and the tuning parameter was set to zero. The step size and threshold parameters were chosen by reducing them until the integral backscattered fraction was relatively stable under variation of those parameters, and to be as small as possible for reasonable running time. The threshold parameter additionally was checked to give good results at low energy for thin targets. The tuning parameter had to be changed to zero, as it had been found to be erroneously set to 1.5 in this version of Geant4. Examples of how to make these modifications were supplied by the Geant4 Electromagnetic Physics and Low-Energy Electromagnetic physics groups Urban and Ivantchenko (2003).
The version of Penelope used was 2002b. Penelope was studied in detail under the variation of several simulation parameters and was found to be stable. The simulation parameters were therefore chosen to optimize simulation speed consistent with a full detailed simulation. For the comparison with our silicon detector data, the most suitable simulation parameters were found to be: , , DSMAX = 0.005 cm, and Hoedl (2003). These parameters control energy cut-offs, the maximum step size, and the description of elastic and inelastic scattering in the medium. Particles identified as secondaries by Penelope were included. Secondaries were also studied in separate simulations related to our current-integration measurements, as mentioned earlier.
In both Monte Carlo models, backscattering is defined as any electron which exits the surface of the target. The Monte Carlo simulations included silicon detector response in a simple model including normal-incidence backscattering from the front face. This was validated by the fact that the detector response to mono-energetic electrons did not vary with beam position on the detector face, as discussed in Section III.2. Energy smearing based on a 2.5 keV energy-independent energy resolution of the silicon detector was also included. Chamber background effects were studied in separate Penelope-based simulations, as described earlier.
The main difference between Penelope and Geant4 relevant to backscattering is in the treatment of scattering from nuclei. Penelope treats these as Rutherford scattering events exactly using a relativistic screened Rutherford scattering cross section. Multiple electron-atom scattering events, with energy loss (dominated by electron-electron interactions in the target) are found to dominate backscattering at these energies in this model, for thick targets. Geant4, on the other hand, has no exact treatment of Rutherford scattering, relying on sampling from a multiple scattering distribution.
Fig. 4 compares the Geant4-based Monte Carlo with our silicon detector measurements at 124 keV. It can be seen that Geant4 somewhat overestimates the beryllium data, while having relatively good agreement with the silicon data. The beryllium data is globally overestimated by roughly 20%, hence a scale factor of 0.8 was applied to the Monte Carlo for this comparison so that the differences between the distributions can be more easily seen. In all cases, it is also apparent that the peak near is systematically underestimated. However the positions of the low-energy and elastic peaks are rather well-described by the Monte Carlo. In the case of a silicon target, the Geant4 low-energy peak is at a slightly higher than the data, while for beryllium this peak appears at slightly lower relative to the data.
Fig. 8 compares Penelope-based Monte Carlo with our measurements using the silicon detector.
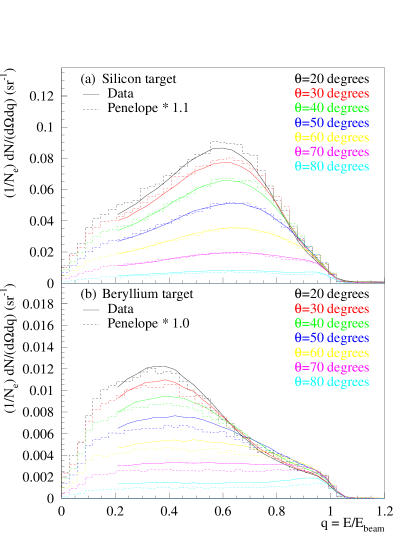
A scale factor of 1.1 is applied to the Penelope simulation in the case of silicon. No scaling is applied to the beryllium simulation. The Penelope simulation in general somewhat underestimates the beryllium measurements by 5% and underestimates the silicon measurements by roughly 10%. When the Monte Carlo is rescaled, it is apparent that trends in both energy and angle are well represented by Penelope. Since the systematic uncertainty is larger than these discrepancies, the overall agreement is good.
Fig. 6 shows the Geant4 and Penelope simulations compared with data for the energy-integrated angular distributions (). No Monte Carlo scale factors are applied for this comparison. The same discrepancies in overall magnitude of backscattering can be seen. As noted previously, the Penelope simulation tends to better describe the angular distribution (aside from the overall scale factor). The Geant4 distributions are somewhat narrower compared to the data and Penelope. Additionally, the Geant4 simulation gives systematically larger backscattering from each material than does the Penelope simulation.
Fig. 7 compares the integrated results for different beam energies with Geant4 and Penelope simulations. The same discrepancies in normalization are again observed. Both Penelope and Geant4 adequately describe the reduction of as the beam energy increases.
Comparisons of other Monte Carlo models to Geant4, Penelope, and the existing backscattering data were also carried out and were reported elsewhere Hoedl (2003).
VI Conclusion
A detailed data set for normal incidence backscattering from beryllium and silicon bulk targets has been acquired for incident electron energies from 43.5 to 124 keV. Two methods of determining the total normal-incidence backscattered fraction were compared, and found to agree within systematic uncertainties. The data agree qualitatively with previous measurements of the doubly-differential distributions of backscatter done at lower energy. They also agree quantitatively with previous measurements using current integration techniques. The data agree well with models implemented in the Geant4 and Penelope Monte Carlo codes. In terms of overall normalization, Geant4 is found to give a good description of the data. Penelope is found to give good agreement in terms of both overall normalization and relative distributions of backscattered electrons in angle and energy.
In future measurements, we plan to investigate non-conducting targets such as scintillator (particularly interesting for a variety of nuclear physics applications) and active targets (such as scintillator and silicon detectors). We also plan to extend this data set to higher energy (up to 1 MeV) using the same setup with a higher energy electron source. This will allow further tests of the available Monte Carlo models. The comparison of these data to Monte Carlo models will provide an important constraint on a part of the systematic uncertainty for future high precision measurements of neutron beta decay. Future work will also include investigation of thin films and oblique-incidence backscattering which are both important in understanding systematic effects in these experiments.
We gratefully acknowledge the technical support of Robert Carr. This work was supported by the National Science Foundation.
References
- Massoumi et al. (1992) G. R. Massoumi et al., Phys. Rev. Lett. 68, 3873 (1992).
- Massoumi et al. (1993) G. R. Massoumi et al., Phys. Rev. B47, 11007 (1993).
- Gérard et al. (1995) P. Gérard et al., Scanning 17, 377 (1995).
- Agostinelli et al. (2003) S. Agostinelli et al. (The Geant4 Collaboration), Nucl. Instrum. Meth. A506, 250 (2003).
- T. Tabata and Shinoda (1999) P. A. T. Tabata and K. Shinoda, Radiation Physics and Chemistry 54, 11 (1999).
- Bowles and Young co-principal investigators (2000) T. Bowles and A. R. Young co-principal investigators, A proposal for an accurate measurement of the neutron spin, electron angular correlation in polarized neutron beta-decay with ultracold neutrons (2000).
- Yuan et al. (2001) J. Yuan et al., Nucl. Instrum. Meth. A465, 404 (2001).
- (8) The Goodfellow Corporation, 800 Lancaster Avenue, Berwyn, PA 19312-1780.
- Joy (1995) D. C. Joy, Scanning 17, 270 (1995).
- Bronshtein and Denisov (1965a) I. Bronshtein and S. S. Denisov, Soviet Physics - Solid State 7, 1484 (1965a).
- Bronshtein and Denisov (1965b) I. M. Bronshtein and S. S. Denisov, Soviet Physics - Solid State 6, 2106 (1965b).
- H. Drescher and Seidel (1970) L. R. H. Drescher and H. Seidel, Zeit. Angewandte Physik 29, 331 (1970).
- Neubert and Rogashewski (1980) G. Neubert and S. Rogashewski, Phys Stat. Sol. (a) 59, 35 (1980).
- Sempau et al. (1997) J. Sempau et al., Nucl. Instrum. Meth. B 132, 377 (1997).
- Urban and Ivantchenko (2003) L. Urban and V. Ivantchenko, private communications (2003).
- Hoedl (2003) S. Hoedl, Princeton Ph.D. Thesis (unpublished) (2003).