The NIMROD collaboration
Reaction Dynamics and Multifragmentation in Fermi Energy Heavy Ion Reactions
Abstract
The reaction systems, 64Zn + 58Ni, 64Zn + 92Mo, 64Zn + 197Au, at 26A, 35A and 47A MeV, have been studied both in experiments with a 4 detector array, NIMROD, and with Antisymmetrized Molecular Dynamics model calculations employing effective interactions corresponding to soft and stiff equations of state (EOS). Direct experimental observables, such as multiplicity distributions, charge distributions, energy spectra and velocity spectra, have been compared in detail with those of the calculations and a reasonable agreement is obtained. The velocity distributions of particles and fragments with Z 3 show distinct differences in calculations with the soft EOS and the stiff EOS. The velocity distributions of particle and Intermediate Mass Fragments (IMF’s) are best described by the stiff EOS. Neither of the above direct observables nor the strength of the elliptic flow are sensitive to changes in the in-medium nucleon-nucleon (NN) cross sections. A detailed analysis of the central collision events calculated with the stiff EOS revealed that multifragmentation with cold fragment emission is a common feature predicted for all reactions studied here. A possible multifragmentation scenario is presented; after the preequilibrium emission ceases in the composite system, cold light fragments are formed in a hotter gas of nucleons and stay cold until the composite system underdoes multifragmentation. For reaction with 197Au at 47A MeV a significant radial expansion takes place. For reactions with 58Ni and 92Mo at 47A MeV semi-transparency becomes prominent. The differing reaction dynamics drastically change the kinematic characteristics of emitted fragments. This scenario gives consistent explanations for many existing experimental results in the Fermi energy domain.
pacs:
25.70PqI. INTRODUCTION
One of the main aims of the study of heavy ion reactions is to explore the properties of nuclear matter at various densities and temperatures. In intermediate heavy ion reactions (a few tens of MeV/nucleon to a few hundreds of MeV/nucleon), it is generally expected that the composite system of projectile and target nuclei is compressed and excited in the early stage of the reaction, and that the hot-dense nuclear system expands and breaks up by a multifragmentation process. Recently many studies have been undertaken to elucidate possible critical behaviors for such matter Chomaz01 . In many of these studies, thermal and/or chemical equilibrium is assumed Bonasera00 . However in order to reach high enough in excitation energy and/or in density, the collisions become very violent and the collision processes become very complicated. Therefore it is indispensable to establish reliable microscopic dynamical models for the study of the properties of the highly excited matter produced in heavy ion reactions.
In order to elucidate the reaction mechanism many microscopic dynamical models for nuclear collisions have been proposed Bonasera00 ; Moretto93 . Among such models, the molecular dynamics models are well suited to deal with the multifragmentation process. In the Classical Molecular Dynamics model, particles are treated as point particles and their transport is governed by a classical equation of motion in a given mean field Bondorf76 ; Wilets77 ; Bodmer77 . Nucleon-Nucleon collisions are taken into account and treated as hard-sphere scatterings without Pauli-blocking. In the Quantum Molecular Dynamics (QMD) model, each particle is described by a Gaussian wave packet QMD ; QMD1 . Initial nuclei are constructed by ensuring that there is less than one nucleon in each phase space cell of 1/h3. During the time evolution of the wave packets the Pauli principle is respected only by the Liouville theorem of classical mechanics. In the model nucleon-nucleon (NN) collisions are allowed and the Pauli blocking is treated in an approximate manner. During the propagation of the wave packets, however, the time evolution based on the classical equation of motion eventually leads the initial state into a Pauli-forbidden zone and the occupation number of nucleons in phase space often significantly exceeds 1/h3 CoMD .
There have been several attempts to respect the Pauli principle more strictly during the propagation of the wave packets within the classical mechanics. Introduction of a Pauli potential is one such approach Boal ; EQMD ; CHIMERA . The Pauli potential is a non-physical repulsive potential introduced to avoid the overlap of the wave packets in the phase space during the time evolution. However, when it is applied in heavy ion collisions, the Pauli potential operates as a spurious repulsive force to increase the nuclear stopping, especially during the early stages of the collisions wada00 . Recently, Papa et al. introduced a new procedure to remove such overlaps of the wave packet in the phase space at each time step, without introducing the Pauli potential. The model is called the Constraint Molecular Dynamics model CoMD . Although the idea is interesting and the computation time is short, no extensive application has yet been made for comparisons with experimental results.
In order to resolve the problem from the quantum mechanical side, the Fermionic Molecular Dynamics model (FMD) and the Antisymmetrized Molecular Dynamics (AMD) model have been proposed FMD ; ono92 . In both models the total wave function of the system is antisymmetrized and described by a Slater determinant of Gaussian wave packets. The time evolution of the centroid of the wave packets is treated in a classical manner. In FMD the width of the wave packets is treated as variable in time and NN collisions are treated as potential scatterings. Until now the calculations have only been made with a harmonic oscillator potential and no application to heavy ion collisions has yet been made FMD1 .
In AMD-V, an improved version of AMD used in this study, the quantum nature of nucleons in the wave packet propagation is incorporated as follows ono96 ; ono99 :
-
•
The total wave function of the system is antisymmetrized and therefore the Pauli principle is respected at all times.
-
•
The Pauli blocking in stochastic NN collisions is taken into account in an unambiguous manner.
-
•
The probabilistic nature of the wave packet is taken into account as a diffusion process during the wave packet propagation. The diffusion process is formulated in a manner to take into account the quantum branching to many final states of multifragmentation channels.
AMD-V has been applied for intermediate heavy ion collisions and found to reproduce reasonably well the experimental results wada00 ; wada98 ; ono02 . For example in the previous study of the 64Zn + 58Ni reactions at 35A-79A MeV wada00 , the calculated multiplicity, charge distribution and energy spectra of the reaction products were in good agreement with the experimental results. In that study it is pointed out that nuclear semi-transparency plays an important role in the multifragmentation process. In the present paper we extend the earlier study with both experiments and model calculations on additional systems. Experimental reaction measurements have been extended both to heavier systems and to lower incident energies. For the AMD-V calculations, the effective interaction and in-medium nucleon-nucleon (NN) cross section are the two important ingredients. In this work two different effective interactions with different stiffnesses of the equation of state (EOS) and two different formulations of the in-medium NN cross sections have been employed.
A goal of the present work is to elucidate the reaction mechanisms, especially focusing on the equilibration and multifragmentation processes, using a reliable dynamical model for intermediate heavy ion reactions. For this purpose, the best parameter set for AMD-V calculations is chosen by comparing different calculations to the experimental results. Then employing the best parameter set in AMD-V, the reaction mechanisms are studied in detail for the calculated events. Along these lines this paper is organized as follows; In Sec.II the experiment is described. In Sec.III a brief description of the AMD approach, effective interactions and in-medium NN cross sections is presented. In Sec.IV some remarks on the data analysis both for experimental and calculated results are given. In Sec.V detailed comparisons between the experimental results and calculated results are presented. In Sec.VI, a detailed analysis of the underline reaction mechanisms is presented and possible multifragmentation scenarios are proposed. In Sec.VII, the proposed multifragmentation mechanisms and existing data are discussed. In Sec.VIII a summary is given.
In this paper nine reactions, 64Zn + 58Ni, 64Zn + 92Mo, 64Zn + 197Au, at 26A, 35A and 47A MeV, have been studied. In order to refer to each reaction system in the text, the target name and the incident energy are used throughout the paper for simplicity, thus the 64Zn + 58Ni reaction at 47A MeV becomes 58Ni at 47A MeV.
II. EXPERIMENT
The experiment was performed at the K-500 super-conducting cyclotron facility at Texas A&M University, using the 4 detector array, NIMROD, (Neutron Ion Multi-detector for Reaction Oriented Dynamics). 64Zn projectiles were incident on 58Ni, 92Mo and 197Au targets at energies of 26A, 35A and 47A MeV. NIMROD consists of a charged particle array set inside a neutron ball. The charged particle array is made of 166 segments in 12 concentric rings around the beam axis. Eight forward rings have the same geometrical design as the INDRA detector, but have less granularity INDRA . The angle, number of segments in each ring and solid angle of each CsI segment are given in Table I.
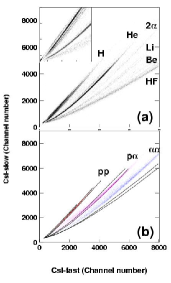
The eight forward rings are covered by ionization chambers (IC). Furthermore in each of these rings two of the segments have two Si detectors between the IC and CsI detectors (super telescopes) and three have one Si detector. Each super telescope is further subdivided into two parts. The CsI detector is a Tl doped crystal read by a photo-multiplier tube. A pulse shape discrimination method is employed to identify particles, using different responses of fast and slow components of the light output of the CsI crystals for different charged particles CsI-detector . The ionization chambers were made of fiber-glass (G10) and were filled with 30 Torr of CF4 gas. Front and back windows were made of 2.0 m aluminized Mylar foil. The signals were read by 5 to 10 fine wires, arranged perpendicular to the particle direction in the active volume. In the CsI detector Hydrogen and Helium isotopes are clearly identified and Li fragments are also isolated from the heavier fragments. In the super telescopes, all isotopes with atomic number Z 8 are clearly identified and in all telescopes, particles are identified in atomic number.
| Ring | Angle | No. of segments | Solid Angle |
|---|---|---|---|
| (deg.) | (msr) | ||
| 1 | 4.3 | 12 | 0.96 |
| 2 | 6.4 | 12 | 2.67 |
| 3 | 9.4 | 12 | 4.26 |
| 4 | 12.9 | 12 | 7.99 |
| 5 | 18.2 | 12 | 16.1 |
| 6 | 24.5 | 24 | 12.7 |
| 7 | 32.1 | 12 | 33.6 |
| 8 | 40.4 | 24 | 27.6 |
| 9 | 61.2 | 16 | 154.0 |
| 10 | 90.0 | 14 | 207.0 |
| 11 | 120.0 | 8 | 378.0 |
| 12 | 152.5 | 8 | 241.0 |
The energy calibration of the Si detectors was made with a 228Th source and the observed punch through energies of identified particles. The punch through energies are calculated using a Range-Energy table ORSAY-table . Since the energy losses of light particles, especially high energy Hydrogen isotopes, are rather small in the Si detectors, evaluation of the energy deposited in the CsI crystal requires special care. Therefore an additional energy calibration was performed as a separate run using a few telescopes in an 80 cm diameter scattering chamber. In the calibration run, the reaction of 64Zn + 92Mo at 47A MeV was chosen as the standard. Si-Si telescopes backed by CsI detectors of three different lengths (1 cm, 3 cm and 5 cm) were used to measure the inclusive energy spectra of light charged particles. The energy spectra were measured at all angles corresponding to those of the 12 rings and solid angles were adjusted to be similar to those in Table I at each angle. The energy calibrations for high energy particles were made using the punch-through energies of different lengths of the CsI crystals. The energy calibration for heavier fragments were made, using the Si detector calibration. The extracted energy spectra of fragments with atomic charge between 4 to 10 have been compared with those in reference wada00 for the 64Zn + 58Ni reaction at 35A MeV, in which Si detectors were used as E-E telescopes, and a good agreement is obtained.
Neutron multiplicity was measured with the 4 neutron ball surrounding the charged particle array. The neutron ball consists of two hemispherical end caps and a central cylindrical section. The hemispheres are 150 cm in diameter with beam pipe holes in the center and they are upstream and downstream of the charged particle array. The central cylindrical section is 1.25m long with an inner hole of 60 cm diameter and 150 cm outer diameter. It is divided into 4 segments in the azimuthal angle direction. Between the hemispheres and the central section, there are 20 cm air gaps for cables and a duct for a pumping station. The neutron ball is filled with a pseudocumene based liquid scintillator mixed with 0.3 weight percent of Gd salt (Gd 2-ethyl hexanoate) Schmitt . Scintillation from a thermal neutron captured by Gd is detected by five 5-in phototubes in each hemisphere and three phototubes in each segment of the central section.
In the experiment, data have been taken in two different trigger modes. One is the minimum bias trigger in which at least one of the CsI detectors fired. The other is the high multiplicity trigger which required that at least 3-5 CsI detectors fired. The minimum bias trigger was scaled down, typically by a factor of 10, to reduce the rate of peripheral events. In order to reduce the neutron background, the beam was swept away in the injection line between the ECR source and the K-500 cyclotron for 1 msec following detection of an event.
III. MODEL CALCULATIONS
A brief description of the AMD model, including recent improvements related to the present work, is given in this section. Two important ingredients, effective interactions and in-medium nucleon-nucleon (NN) cross sections, are also described. In order to show possible effects on the experimental observables resulting from different ingredients, changes in nuclear semi-transparency, a characteristic feature predicted by the model for intermediate heavy ion collisions, are explored.
A. AMD-V model
In AMD a reaction system with N nucleons is described by a wave function which is a single Slater determinant of N Gaussian wave packets ono92 ,
| (1) |
where the complex variables represent the centroids of the wave packets. Zi can be described by
| (2) |
The width parameter is taken as and represents the spin and isospin states of , , , or . For a dilute nuclear gas system, Di and Ki correspond to the position and momentum of each nucleon. Inside the nucleus, however, these quantities do not have physical meanings because of the antisymmetrization. The time evolution of is determined by the time-dependent variational principle and the two nucleon collision process. The equation of motion for derived from the time-dependent variational principle is
| (3) |
is a hermitian matrix defined by
| (4) |
and is the expectation value of the Hamiltonian after the subtraction of the spurious kinetic energy of the zero-point oscillation of the center-of-masses of fragments. Two nucleon collisions are introduced by the use of the physical coordinates W which are defined as
| (5) |
and Qij is defined as
| (6) |
In molecular dynamics models with Gaussian wave packets, the i-th nucleon at time t=t0 is represented in phase space by
| (7) |
with the centroid and . The total one-body distribution function is the sum of . In AMD, this representation of nucleon as a simple Gaussian wave packet is only approximately valid when the physical coordinate
| (8) |
is used for the centroids.
In order to properly treat reactions with many branching channels, such as multifragmentation processes, AMD has been extended by introducing the wave packet diffusion effect as a quantum branching process. This extended AMD is called AMD-V, since the wave packet diffusion effect is calculated with the Vlasov equation ono96 . The AMD-V code has been further improved in order to save CPU time in the numerical calculations and to be applicable to heavier reaction systems. In the newly developed code, used for all calculations in this paper, the calculation of the wave packet diffusion effect has been reformulated and a triple-loop approximation has been incorporated ono99 .
The calculations were performed in the VPP700E supercomputer facility in RIKEN, Japan. For the 64Zn + 58Ni and 64Zn + 92Mo reactions, about 5000 and 3000 events, respectively, were generated at each energy in the impact parameter range of 0-12 fm for a given parameter set. For the 64Zn + 197Au case, about 1000 events were generated in the impact parameter range of 0-14 fm. The calculations were started with a distance of 15 fm along the beam direction between centers of the projectile and the target. The calculation for each event was carried out typically up to t=300 fm/c for the reactions at 35A and 47A MeV and up to 500 fm/c for those at 26A MeV. In the following text, t=0 is set as the time at which the projectile and the target touch each other.
B. Effective interaction and in-medium NN cross section
| [fm] | [MeV] | [MeV] | [MeV] | [MeV] | [MeV fm3(1+σ)] | [MeV fm5] | ||
|---|---|---|---|---|---|---|---|---|
| 0.7 | ||||||||
| 1.2 | ||||||||
| 1.24 | 1896 | 75 |
The Gogny interaction Decharge has been used successfully in the previous analyses wada00 ; ono96 ; wada98 ; ono02 . This interaction gives a soft equation of state (EOS) with an incompressibility value K of 228 MeV for infinite nuclear matter and has a momentum dependent mean field. In the present work, a modified Gogny interaction with a stiff EOS with K=360 MeV is also applied ono00 . The parameter set adopted for K=360 MeV was that used by Haddad et al. Haddad and labeled as D1-G3. However this new interaction gives neither the proper charge radius nor the correct binding energy for the nuclear ground state in AMD. In order to get proper ground state properties of nuclei, it is necessary to add a surface term in the Hamiltonian. Furthermore we correct the two body interaction term, so that, the force produces a reasonable equation of state for asymmetric nuclear matter. The expectation value of our stiff Gogny force is given by
| (9) |
where
| (10) | |||||
| (11) | |||||
| (12) |
The indices and take four states of spin and isospin, , , , and . The parameters are shown in Table LABEL:StiffPara. This new effective interaction is used in all calculations with the stiff EOS in the present study. The incompressibility is still 360 MeV, because the surface term does not contribute to the incompressibility of infinite nuclear matter and the correction to the two-body part does not affect the symmetric nuclear matter.
Calculated binding energies for the soft EOS deviate from the experimental values, which were taken from MassTable , by about 0.5 MeV/nucleon for the mass number A 30 and about 0.2 MeV/nucleon for the heavier fragments with A 100. The agreement to the experimental values become better for the heavier fragments. The calculated binding energies for the stiff EOS, on the other hand, show larger deviations and they are up to 1 MeV/nucleon less bound for all fragments, comparing to the experimental values.
In the previous analyses, an empirical in-medium nucleon-nucleon cross section was used wada00 ; ono96 ; wada98 . This cross section is given by ono93
| (13) |
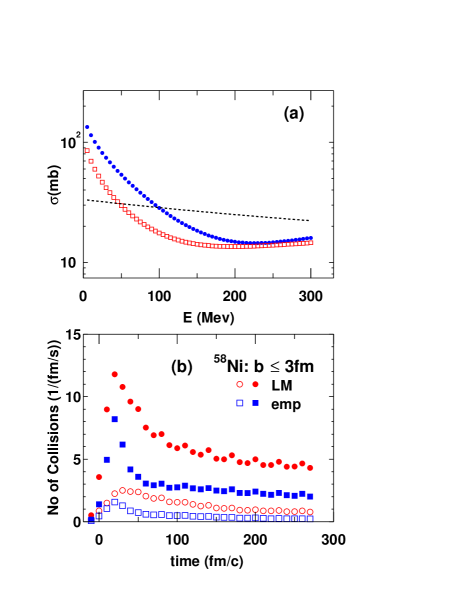
where is the nuclear density and is its normal value. The cross section is given in mbarn. The calculated cross section for the normal nuclear density is shown in Fig. 1(a) by a dashed line. In the cross sections no distinction was made between p-p(n-n) and n-p collisions. The density dependence is taken into account, but the dependence is rather small in the range of the density variation expected for the reactions studied in this work. For , the cross section decreases by about 10%.
Li and Machleidt calculated the in-medium NN cross sections based on the Dirac-Brueckner approach Li93 ; Li94 . For np collisions, the in-medium cross section is given by
| (14) |
and for pp, the cross section is given by
| (15) |
A normal nuclear density of 0.18 fm-3 is assumed in the paper. The calculated cross sections for normal nuclear matter are represented by symbols in Fig. 1(a). At low energies these cross sections are about two to four times greater than those resulting from the empirical formula previously employed. Above 100 MeV, both pp and np cross sections become smaller than that of the empirical prescription. For =1.5, the cross section decreases by about 35% at E=0 MeV and 25% at E=100 MeV.
In Fig. 1(b) the number of attempted and Pauli-allowed collisions are shown for actual calculations with the empirical cross section and with the Li-Machleidt cross section. The calculations were made for the central collision events ( b 3 fm) of 64Zn + 58Ni at 47A MeV. The soft Gogny interaction was used. For the empirical formula, the number of attempted collisions reaches 8 collisions/(fm/c) at a time of 30 fm/c when the two nuclei totally overlap and decreases quickly to 3-4 collisions/( fm/c). Only about 20% of the attempted collisions are Pauli-allowed during this process. For the Li-Machleidt cross sections, the number of attempted collisions increases by almost a factor of two. About 30% of the attempted collisions are Pauli-allowed in this case.
C. Nuclear semi-transparency
It has been reported that nuclear transparency plays an important role for the multifragmentation process in intermediate heavy ion collisions wada00 ; Nebauer . The stiffness of the effective interaction and the in-medium NN cross section are both important ingredients for determining the degree of the transparency in the calculations. In the present study three parameter sets have been investigated for the calculations. They are
-
•
soft EOS + NNemp (empirical NN cross section)
-
•
stiff EOS + NNemp
-
•
stiff EOS + NNLM (Li-Machleidt cross section).
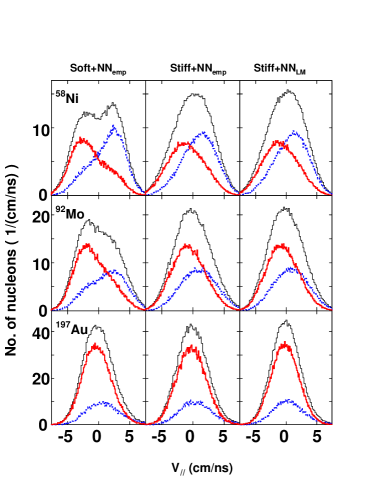
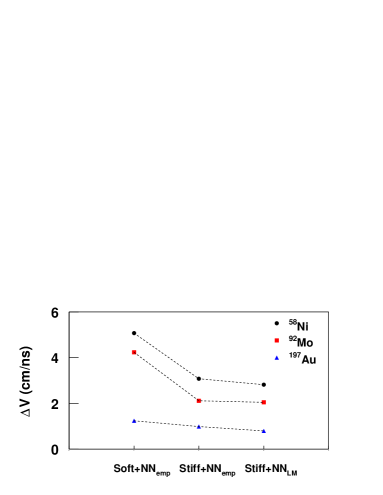
In order to show how much nuclear semi-transparency changes with the different parameter sets, parallel velocity distributions for all nucleons (free nucleons and nucleons bound in fragments) are shown in Fig. 3, at a time t = 280 fm/c, for central collisions in reactions at 47A MeV. In the case of 58Ni (top row), the majority of the projectile and target nucleons move in the same direction after the collisions. For the soft EOS (left column) the projectile nucleons exhibit a broad distribution, centered at about half of the incident velocity after penetrating through the target nucleus, indicating significant transparency. The transparency is reduced for the stiff EOS as seen in the right column of the figure. It is interesting that only a small difference is observed between the results calculated with NNemp (middle) and those with NNLM (right). Therefore, in the framework of the AMD-V, the transparency depends significantly on the stiffness of EOS, but depends only weakly on the in-medium NN cross sections. As the result the parallel velocity distributions of all nucleons show a two-peak structure for the soft EOS and these two peaks tend to merge into one peak for the stiff EOS. When the target becomes heavier, the two-peak structure for the soft EOS is also less prominent and becomes one peak for the 197Au target. In that case no notable difference is observed between the soft and stiff equation of state. The differences of the peak velocities between nucleons from the projectile and those from the target are also plotted in Fig. 3. Enhancement of the semi-transparency for the soft EOS is clearly seen as the sharp increases of the differences for 58Ni and 92Mo.
D. Afterburner and switching time
The fragments generated in AMD-V calculations are generally in an excited state at a time of 280 fm/c. AMD-V should properly treat the cooling of these fragments in a quantum statistical manner ono96_1 . However in order to cool the fragments down to the ground state, a great deal of CPU time is needed. Instead of continuing the AMD-V calculation for such a long time, we stopped the calculation at t = 280 fm/c (which corresponds to a realistic CPU time to get a few thousand events in the VPP700E) and the fragment cooling was followed, using a statistical decay code as an afterburner. A modified version of GEMINI Charity was used as the afterburner. In this modified version, discrete levels of the excited states of light fragments with Z 15 are taken into account and the Hauser-Feshbach formalism is extended to the particle decay of these fragments when the excitation energy is below 50 MeV. Each AMD-V event was used 100 times in the afterburner in order to sample all possible decay paths of the excited fragments. This also provides enough statistics for detailed comparisons to the experimental results. The switching time of t = 280 fm/c was chosen only for practical reason of the computation time in the VPP700E. In the AMD-V calculations, later switching times are preferable, because the particle evaporation occurs in the quantum statistical manner ono96_1 . As discussed in reference wada00 the switching time of t = 280 fm/c is late enough so that the final results do not depend significantly on this choice.
IV. DATA Analysis
In order to perform direct comparisons between the experimental results and the calculations, the efficiency of the experimental acceptance, such as the neutron ball efficiency and multi hit effects, have to be evaluated. Event classification is also crucial for the comparisons, because many observables change drastically depending on the impact parameter. In this section these experimental conditions and event classification are described in detail.
A. Neutron ball efficiency
Neutron balls have been applied to measure neutron multiplicity in heavy ion reactions for the last two decades Neutron-Ball . In order to simulate the neutron ball efficiency the program DENIS has been widely used DENIS . This code is designed for low energy neutrons and no secondary neutron generation is taken into account. Recently Trzcinski et al. developed a more sophisticated program MSX which takes into account secondary neutron generation Neutron-Ball . These codes have been applied to neutron energies up to a few tens of MeV for neutron balls containing a minimum amount of material inside the scattering chamber. However NIMROD has a large amount of material inside the chamber. This can result in scattering, absorption and generation of neutrons. To address these possibilities we have used the GCALOR code coupled to the GEANT-3 simulation package to simulate the neutron ball in NIMROD GCalor ; Geant . The GCALOR code is designed to simulate low energy neutrons. It makes use of the latest compilation of cross section data. In the program the geometry and material of the Neutron Ball and the charged particle array have been taken into account in detail. Only cables, phototubes and Si detectors are neglected. The calculations were made for neutrons emitted isotropically from the target with energies from 2 to 100 MeV in 2 MeV steps. For each event, one neutron is emitted at the target and one million events were generated for each case. Each neutron was followed until either it escaped from the neutron ball or became thermalized ( E 0.03 eV). If it thermalized inside the liquid scintillator, we assumed the neutron was captured by the Gadolinium. When additional neutrons are generated, all neutrons were followed until they were thermalized or escaped. The detection efficiency for a neutron of a given initial energy is determined by the ratio of all detected neutrons to primary neutrons. The light detection efficiency inside the neutron ball was also simulated separately by generating rays emitting from a point source scattered inside the neutron ball. For a threshold of 300 KeV the detection efficiency of a captured neutron was nearly 100%. The program was run in two modes, i.e., with the charged particle array and without the array to specify different contributions to the efficiency.
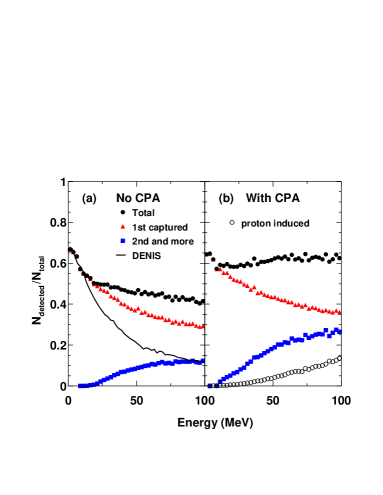
In Fig. 4 the calculated results for the neutron ball efficiencies are shown. For comparison the DENIS code predictions are also shown by a solid line for the case without the charged particle array Schmitt . Below 10 MeV both calculations agree reasonably well. For the higher energy neutrons, the efficiency calculated by DENIS drops below the results for the first detected neutrons in the GEANT simulation (triangles), because there is no neutron generation in DENIS. In other words, even for the first captured neutrons in the GEANT simulation, generated neutrons start to contribute to the detection efficiency above 10 MeV, as one can see in the figure. This indicates that a significant number of neutrons are generated in the liquid scintillator for these high energy neutrons. The contribution from the generation of more than two neutrons becomes significant above 20 MeV. Since the contribution of the third detected neutron is only 10% of that of the second detected neutron (not shown), the main contribution comes from one or two neutron generation in this energy range. With the charged particle array, the contribution of generated neutrons almost doubles. The total efficiency of the neutron ball slightly increases above 20 MeV as the neutron energy increases and becomes even approximately constant with respect to energy.
Protons also generate secondary neutrons at high energy. However the generation of neutrons by protons is much less efficient than that by neutrons. This is because protons lose their energy very quickly by ionization processes and the cross section for neutron generation decreases rapidly as the proton energy decreases. Only a 5% contribution to the neutron efficiency is observed at a proton energy of 50 MeV and 14% at 100 MeV.
The efficiencies shown above are those averaged over all angles. However in the intermediate heavy ion reactions the angular distribution of the neutrons has a significant forward peak, especially for higher energy neutrons. Since the charged particle array has more material at forward angles and two air gaps between the central part and the two hemispheres are not symmetric relative to the target position, the angular dependence of the neutron efficiency has to be taken into account for the actual application. Therefore the neutron efficiency was calculated as a function of both neutron energy and polar angle. The azimuthal angular dependence was neglected. Since the proton multiplicity is much smaller than that of neutrons, the proton contribution to the neutron ball efficiency was not taken into account in the present analysis.
B. Particle identification and multi-hit events
In NIMROD, light charged particles with atomic number Z 3 are identified by a pulse shape discrimination method in the CsI detector. A typical two dimensional plot of fast versus slow charge integrated signals is shown in Fig. 5(a). Each type of particle lies along a specific curve and one can clearly identify different particles as indicated in the figure. In the insert the spectrum is expanded for Hydrogen isotopes. The events along the far left line correspond to rays (and accidental cosmic muons). Hydrogen isotopes are clearly identified down to a few MeV/nucleon.
Special care has to be taken in the pulse discrimination method when more than one charged particle hits a CsI detector. In order to simulate double hit events in an actual detector, two experimental events were artificially mixed and the two outputs for a given combination of light charged particles were added both for the fast and slow components. The loci of double-hit events for pp, p and are plotted in Fig. 5(b). The pp events are scattered along the deuteron and triton lines. Therefore these double hits are identified as a single deuteron or a triton in the present experimental data analysis. The main part of p events lie near the alpha line. Most of these events, therefore, are identified as a single particle. When two particles hit a detector, these events lie between the and 6Li lines and are easily identified as two particles, though only their summed energy is given experimentally. This is clearly seen in the experimental spectrum in Fig. 5(a) and indicated by 2.
The rate of multiple hits has been simulated using AMD-V. Results are shown in Fig. 6(a) for the case of 92Mo at 47A MeV. The total number of each generated particle, the number of single hits and that of double hits are given by different histograms. For the double hits both of the particles are counted separately. According to this simulation, about 12% of protons and 20% of particles hit a CsI detector which is hit by other charged particles. The rate of two particles is larger, mainly because of the two decay of 8Be. The rate increases as the detector angle increases, because the solid angle of each segment increases rapidly as the angle increases as seen in Table I. The actual detected number of each particle as a single hit, after filtering through the experimental filter, is also given in the figure. About 85% of single-hit light charged particles were detected and identified.
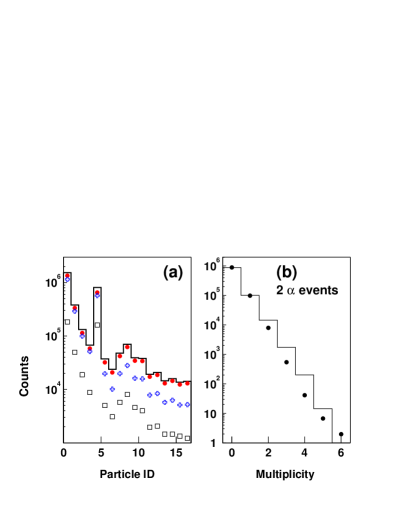
In order to verify the double-hit rate in the above simulation, a comparison was made between two- events in the experiment and in the simulation. The results are shown in Fig. 6(b). A reasonable agreement between the experimental and calculated results is obtained. About 10% of the events have one double hit, both in the experiment and in the simulation.
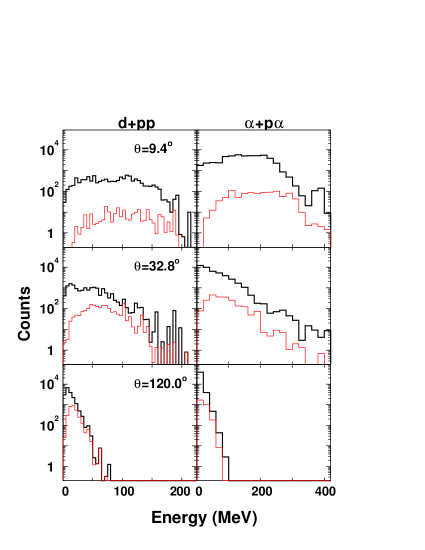
The effect of multi-hit events on the energy spectra of light charged particles has also been studied. In Fig. 7, deuteron and alpha spectra at three different detection angles are shown. In the calculation all pp-double hits are assigned as a deuteron hit with the summed energy and all p hits are assigned as a single hit. The contribution of the double hits at is a few percent in both cases, and gradually increases as angle increases. At backward angles, especially for deuterons, the contribution becomes of the same order as that of the single particle hits. The contributions for the spectra are slightly less.
For heavier fragments with Z 4, particle identification was made by the E-E method and no multi-hit problem in particle identification occurs. (The energy loss of a proton or an particle is much smaller than for a heavier fragment.) However heavier fragments from the target-like source have rather small kinetic energies and may be stopped in the E detector. In this experiment heavy particles emitted at angles larger than were not identified by charge. As seen in Fig. 6(a) heavy fragments with Z 3 were detected with an efficiency of 40-50%.
In the experimental filter applied to the calculated events, all pp hits are identified as a deuteron, all p are identified as an and events are treated as two- hits. A heavy particle ( Z 3) with light charged particles in one detector is identified as a single heavy particle hit and the light charged particles are not counted in the charged particle multiplicity. Events with more than two hits in a single detector are treated as not identified for the largest fragment with Z 2 and as a single hit for the largest with Z 3, though the rate of these events is very small in the reactions studied in this paper.
C. Event classification
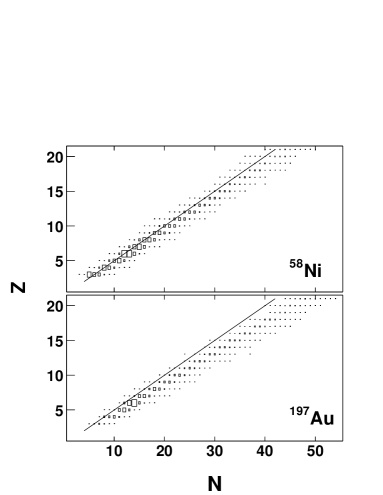
Detected events have been classified in four groups (Violent, Semi-Violent, Semi-Peripheral and Peripheral), depending on the violence of collisions. This assignment is based upon the neutron and light charged particle multiplicities and the total transverse energy of the light charged particles. In Fig. 8 typical two dimensional plots of the normalized total multiplicity MAsystem versus the normalized total transverse energy E/Ebeam are shown for 92Mo at 47A MeV, both for the experimental and the calculated results. In both cases the experimental inclusive distribution (top) shows a slightly broader distribution than the distribution calculated with AMD-V. For the multiplicity axis, this is mainly induced by the neutron multiplicity distribution as seen in the next section. The top 5% (3%) of the minimum bias events in the experiments were assigned to “Violent” collisions for 58Ni and 92Mo (197Au). The next 20% (10%) events were assigned as “Semi-Violent” collisions and the following 20% (10%) of events were assigned as “Semi-Peripheral”. The rest were assigned as ”Peripheral” collisions. The same boundaries were applied to the calculated events. The resulting distributions corresponding to these cuts are compared in Fig. 8.
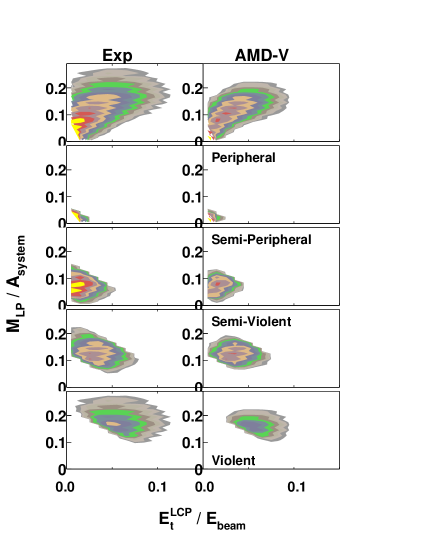
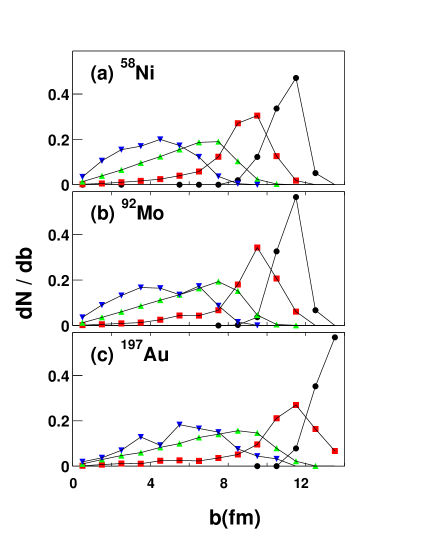
The distributions of impact parameter for the four different class of events were studied using AMD-V and are shown in Fig. 9. For the “Violent” and “Semi-Violent” classes the calculated distributions are very broad and about 50% of events of each class overlap with the distribution of another class. In the “Violent” class for 58Ni, the distribution reaches up to 8 fm and about 70% of events are distributed in the impact parameter range of b 5 fm. The distributions become broader for the heavier targets. In the “Violent” class for 197Au, the distribution reaches up to 10 fm and only about 35% of events originate from collisions with b 5 fm. On the other hand the events in the “Semi-Peripheral” and Peripheral classes show a rather localized distribution with a full width at a half maximum (FWHM) of 2-3 fm, indicating that most of these events actually originated from collisions with a large impact parameter. Therefore throughout this paper, the word “Violent” is used instead of ”Central” for the class of events with the highest multiplicity and the largest transverse energy. The word ”Peripheral” is used as is customary.
V. COMPARISON BETWEEN EXPERIMENT AND MODEL
Detailed comparisons of the experimental and calculated results are presented in this section for the direct observables, such as multiplicity distributions, charge distributions, energy and velocity spectra. Comparisons for the elliptic flow are also shown. In order to make these comparisons, all calculated results have been filtered through the experimental conditions, unless otherwise specified.
A. Multiplicity distributions
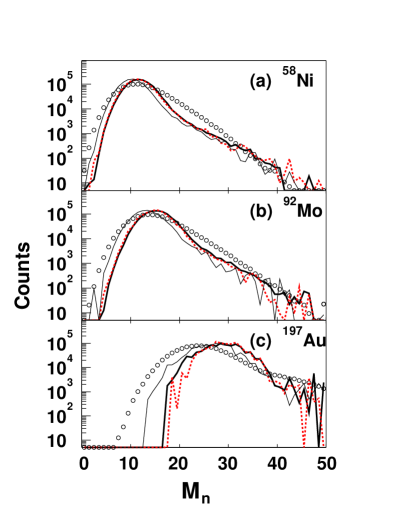
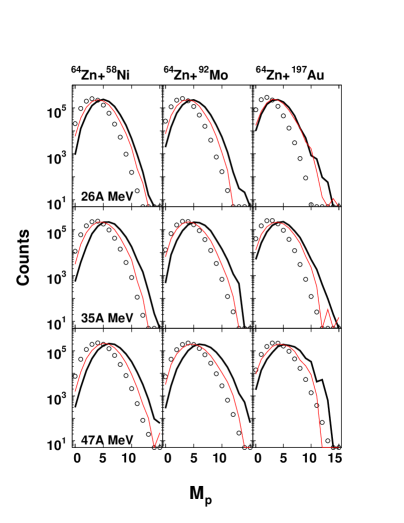
Neutron and charged particle multiplicity distributions are presented in Figs. 10 to 14. In Fig. 10 experimental neutron multiplicity distributions are compared with the calculated results for the “Violent” collisions of the reactions at 47A MeV. In each figure the experimental and the calculated results for the three different sets of parameters are shown. Overall the experimental results show broader distributions than those of the calculations for all reactions. For 197Au a shoulder is observed above the neutron multiplicity M. It originates from pile-up in which two reactions occur during the 10sec beam period before the shut-off of the beam. The pile-up is related to the reaction rate and is different for different reaction systems and incident energies (it can also fluctuate with time). Therefore in this work the pile-up effect is not taken into account in the experimental filter. The mean values of the calculated distributions for 58Ni and 92Mo agree with those of the experiments within 1-2 neutrons, whereas that for 197Au produces 3 additional neutrons for the soft EOS and 5 additional neutrons for the stiff EOS. While the mean value for 58Ni and 92Mo is slightly better reproduced by the calculations with the stiff EOS, that for 197Au is better fit with the soft EOS. For all reactions the calculated multiplicities for the stiff EOS, but different NN cross sections, show almost identical distributions.
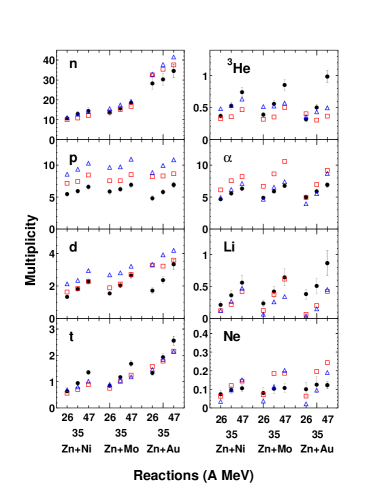
Similar trends are also observed for other reactions. In the top-left of Fig. 15, the mean multiplicities of neutrons, corrected for the efficiency, are summarized for “Violent” collisions for all reactions studied here. The calculated results for Soft+NNemp and Stiff+NNLM are compared to the experiment. The experimental mean values for 58Ni and 92Mo are reasonably well reproduced by the calculations but for 197Au the experimental mean values are exceeded by about 10-20% at all incident energies.
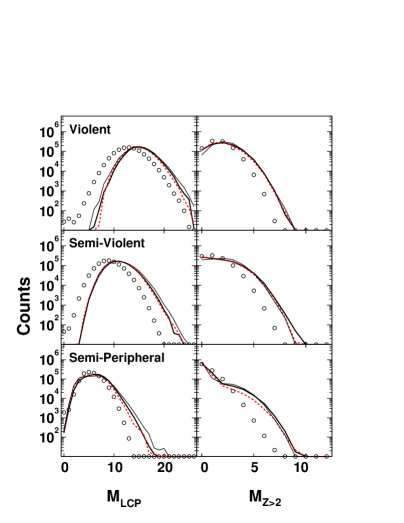
Typical charged particle multiplicity distributions for light charged particles (Z 2) and heavier fragments are shown separately in Fig. 11. For collisions in “Violent”, “Semi-Violent” and “Semi-peripheral” classes for 92Mo at 47A MeV, both experimental and calculated results are shown. Calculations with three different parameter sets lead to very similar distributions for all cases. For the “Violent” and “Semi-Violent” collisions the light charged particle multiplicity is overpredicted by 20% in the calculations. The heavier charged particle multiplicity is also overpredicted by about one unit in the mean value. The widths of the distributions are well reproduced for all cases. For the “Semi-Peripheral” collisions, the light charged particle multiplicities are well reproduced both in the mean value and width, but for the heavier charged particle multiplicities all calculations show a shoulder at the multiplicities around 4-5.
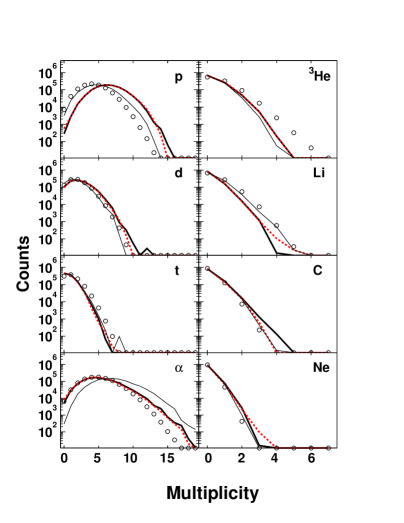
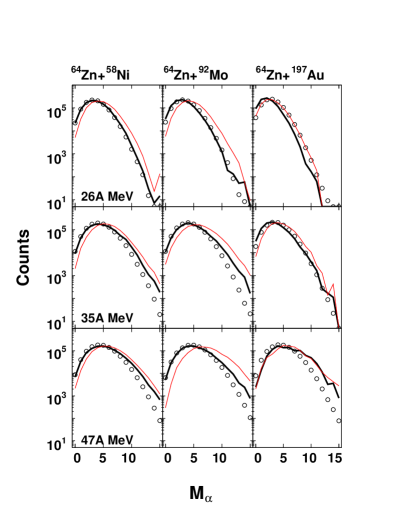
Typical individual charged particle multiplicities for the “Violent” collisions are shown in Fig. 12 for the same reaction. There is an interesting connection between the multiplicity of protons and particles. For the soft EOS, the proton multiplicity distribution is reproduced quite well, both in the mean value and width. On the other hand the mean value of the distribution is overpredicted by more than 2 units. On the contrary, for the stiff EOS the multiplicity distribution is well reproduced, but the proton multiplicity distribution is overpredicted by more than two units. Since the differences are small for the other light charged particles and their experimental distributions are reasonably reproduced, the overprediction of the calculated multiplicity distributions for light charged particles seen in Fig. 11 is mainly caused by alpha particles for the soft EOS and by protons for the stiff EOS. For Li fragments the calculated distributions show slightly smaller values than the experimental values for all three calculations. Those for Be fragments, not shown, also show a similar trend. For heavier IMF with 5 Z 15, all calculations overpredict the experimental multiplicities by 1-2 units, as seen in Carbon and Neon cases in Fig. 12. Here also one can see that the calculated results for the stiff EOS with different NN cross sections show almost identical distributions for all cases.
Proton and multiplicities for all reactions are shown in Figs. 13 and 14 for “Violent” collisions, respectively. For most reactions, calculations with the soft EOS are favored for the proton multiplicity distributions and those with the stiff EOS are favored for the multiplicity distributions. For 197Au at 26A and 35A MeV, however, the calculated proton multiplicities are overpredicted for both EOS’s while the experimental multiplicity distributions are rather well reproduced by the calculations with the soft EOS.
For the “Violent” class the results are also shown in Fig. 15. In the figure the efficiency corrected experimental multiplicities and non-filtered calculated multiplicities are shown. The experimental detection efficiency for each particle is evaluated from the calculated events. The differences between calculations for a given particle agree within a few %. The error bars in the figure include the systematic errors. The increase of the experimental multiplicity with energy and target mass is reasonably reproduced for all particles by both calculations, whereas the calculated absolute mean values deviate from the experimental multiplicities by about 20-30% for some cases. For Li, the experimental mean values are overpredicted for most cases and the deviation becomes significant for 197Au. For the heavier fragments the calculated mean values become larger than the experimental ones in general. For Ne, the experimental mean values are well reproduced at 26A MeV, but overpredicted at 47A MeV by both calculations.
B. Charge distributions
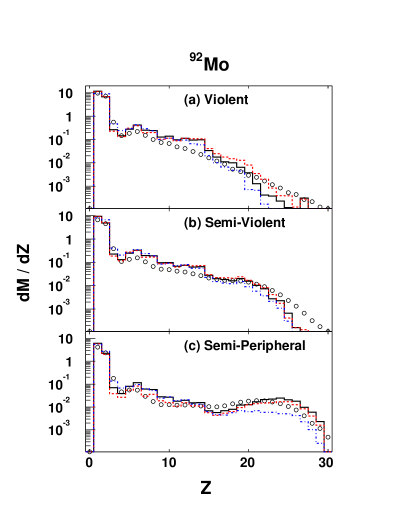
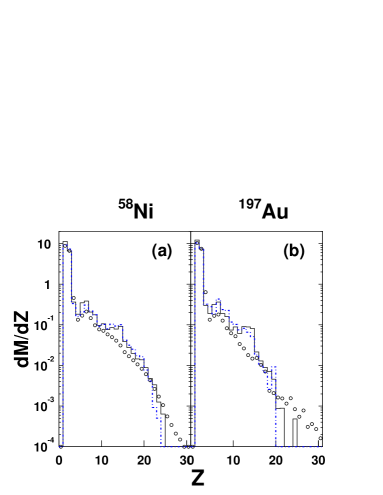
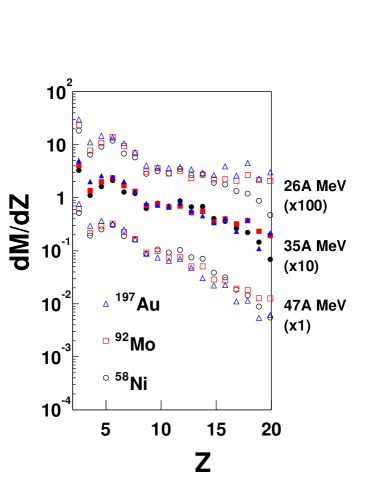
Charge distributions for different classes of centrality for 92Mo at 47A MeV are shown in Fig. 16. The experimental charge distributions evolve to the larger Z side when collisions become less violent. This trend is well reproduced by all calculated results, as one can see in the figure. No significant difference is observed between the calculated results with different parameter sets, except for fragments with 20 Z 30 in the “Semi-Peripheral” class. For most of the cases the calculated fragment multiplicities with are overpredicted by a factor of 1.5-2. A similar discrepancy is observed at lower incident energies. In Fig. 18, the charge distributions for 58Ni and 197Au are compared with the calculations. For 58Ni the discrepancy is similar to 92Mo and, for 197Au, the discrepancy becomes larger. For 197Au all calculated results are overpredicted by a factor of 2-3. As one can recognize in the figure, the charge distributions for the two targets are quite similar both in the experiments and calculations. This is also true, in some extent, for all different reactions studied in the present work. In Fig. 18, experimental efficiency corrected charge distributions are compared with each other for light fragments with 3 Z 20. The detection efficiency correction is made by comparing the calculated results with and without the experimental filter. Each group shows results for the three different targets at a given incident energy. For 197Au fragment multiplicity tends to be slightly smaller at 35 and 47A MeV, but the shapes of the global distributions are rather similar to each other, even for different incident energies. A similar trend is also seen in the calculated events. The resemblance of the relative charge distributions is quite interesting because the reaction mechanisms are quite different as discussed later.
C. Energy spectra
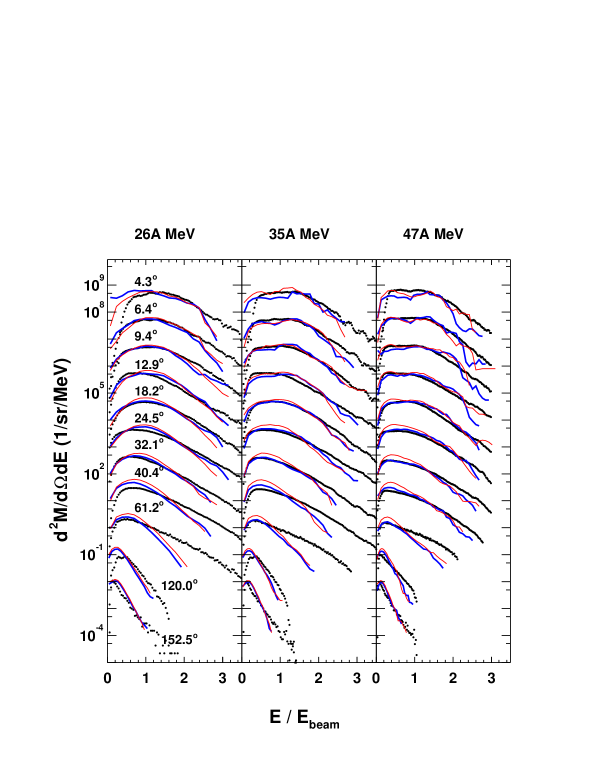
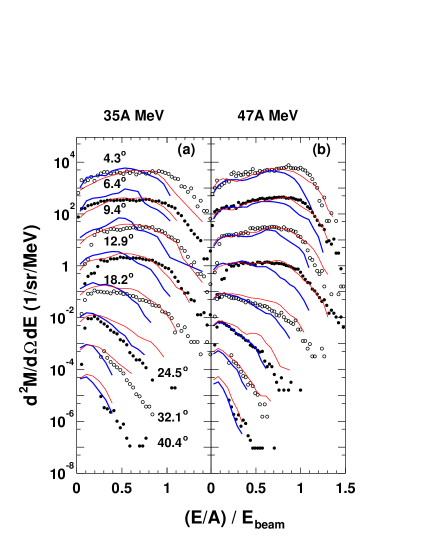
For the violent collisions for 92Mo at three different incident energies, typical energy spectra of light charged particles are shown in Figs. 19 to 22. Experimental spectra and calculated spectra for the soft EOS + NNemp and the stiff EOS + NNLM are shown. Energy is scaled by the beam energy. The vertical axis is the differential multiplicity and all results are given in an absolute scale. As one can see for all cases, the experimental spectra, at three incident energies, are very similar to each other in shape and angular dependence. This indicates that these energy spectra can be parametrized as emission from moving sources with similar source velocities and apparent temperatures, but scaled by the incident energy. In the present work, however, no such analysis was performed. Instead the experimental energy spectra and angular distributions are compared with calculated AMD-V events. As seen in Figs. 19 to 22, a reasonable agreement is obtained for all cases. For protons, however, the experimental slopes of the high energy tails in Fig. 19 tend to be harder than those in calculations, especially at 26A and 35A MeV. The deviation becomes significant at angles of and 61.2o which correspond to emission near in the center of mass system. A similar discrepancy is also observed at 47A MeV. For the calculations with the stiff EOS, an excess of low energy protons is clearly observed at angles between 24.5 at both 35 and 47A MeV. This is slightly less prominent at 26A MeV. This is the main cause of the excess of the proton multiplicity in the calculations with the stiff EOS, observed in Fig. 13.
The experimental energy spectra are compared with calculated spectra in Fig. 20. At 35 and 47A MeV the experimental spectra are well reproduced by the calculations with the stiff EOS, except at the most forward angle, whereas the calculations with the soft EOS overpredict the yields on higher energy side at most of the forward angles. This overproduction causes the overprediction of the alpha multiplicity observed for the soft EOS in Fig. 14. On the other hand, at 26A MeV, the calculation with the soft EOS reproduces the experimental spectra quite well at most angles. The stiff EOS significantly underestimates the yields in higher energy side.
Deuteron and triton energy spectra are shown in Fig. 21 and Fig. 22. At 26A MeV both calculations underpredict the yields for both deuterons and tritons of higher energies. This is similar to observations for the proton spectra. For the deuteron spectra at higher incident energies, the calculations with the stiff EOS reproduce the experimental spectra better than those with the soft EOS at the four most forward angles. The overprediction of low energy deuterons, that is seen in proton spectra, is also observed at angles between 24.5. This excess is not observed for the triton spectra, but the corresponding statistical fluctuations are significantly large in that case.
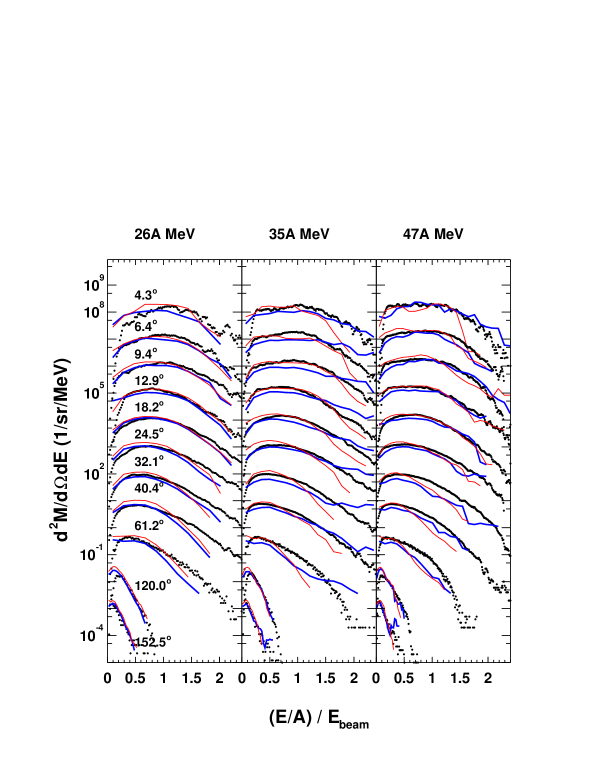
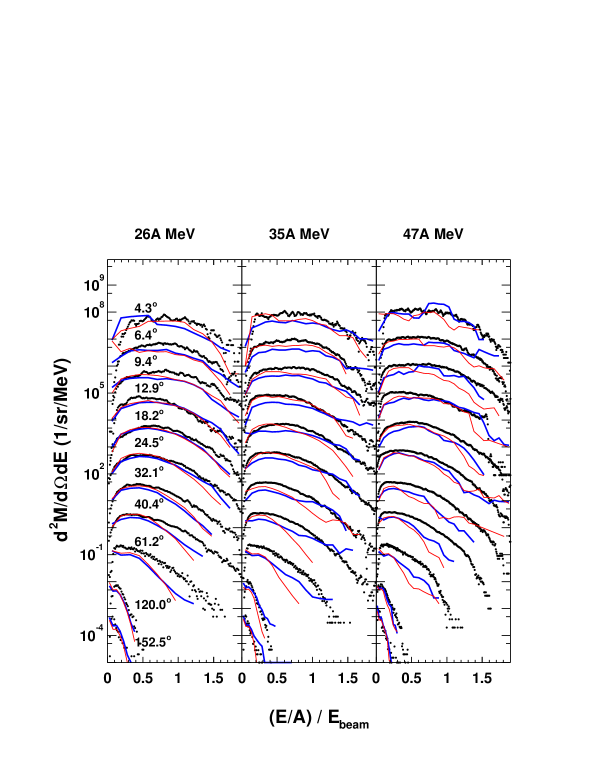
Typical inclusive energy spectra of heavier fragments are shown for Oxygen fragments in Fig. 23 for 92Mo at 35A and 47A MeV. As discussed in ref wada00 , the energy spectra of IMF depend little on the multiplicity class selection. The experimental spectra, scaled by the beam energy, show very similar shapes and angular distributions for both incident energies, except at the most forward angle. This again indicates that these spectra can be described by moving source (or sources) parametrizations with similar source velocities and apparent temperatures, scaled by the incident energy. In AMD-V most of experimental spectra are better reproduced by the calculations with the stiff EOS, especially in the higher energy side.
D. Velocity distributions
As shown in Fig. 3, for the parallel velocity distributions of all nucleons at early stages of reactions, AMD-V predicts a distinct difference between the soft EOS and stiff EOS calculations for reactions with the lighter targets at 47A MeV. The calculated distributions of all free and bound protons also show similar differences as seen in Fig. 24. However, in order to make the distribution for all protons experimentally, all fragments have to be identified at all angles with very low energy threshold. This is a very difficult task in experiments. Instead we compare the experimental and calculated distributions of free protons.
We first compare the calculated parallel velocity distribution of all free and bound protons before the afterburner and that of only free protons after the afterburner. The results are shown in Fig. 24 for the reactions at 47A MeV. The results with the soft EOS are shown on the left and those with the stiff EOS are shown on the right. For free protons after the afterburner the parallel velocity distributions for the soft EOS show slightly broader distributions than those for the stiff EOS, but the shape becomes very similar. Especially for 58Ni, on the left, the two-peak structure seen for free and bound protons before the afterburner becomes a single broad peak. As a result, no distinct difference is observed between calculated results with the soft EOS and the stiff EOS for the distributions of free protons after the afterburner . This indicates that the statistical decay process in the afterburner changes the distributions quite drastically.
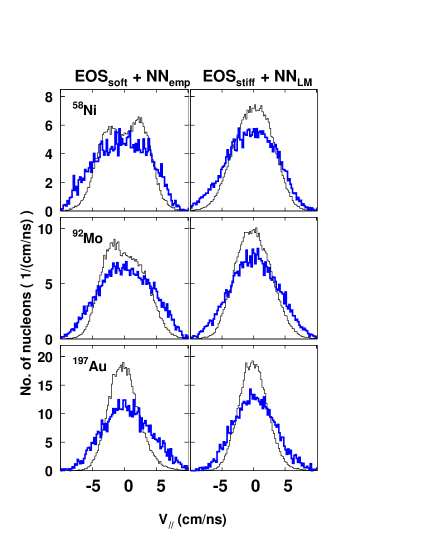
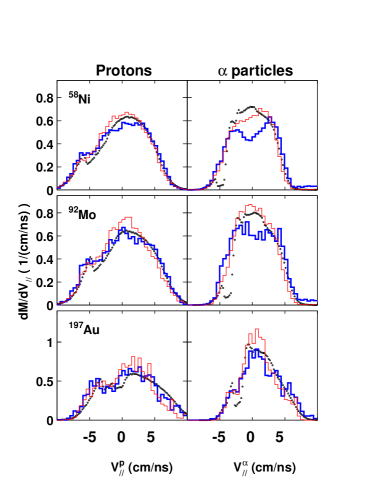
In the left column of Fig. 25 the experimental parallel velocity distributions of free protons are compared with those of the calculations. The dips in the negative velocity side in the experimental distributions are caused by the target shadow to the detectors at 90o. As one can see, both calculations with the soft EOS and the stiff EOS reproduce the experimental proton distributions quite well and no distinct difference is observed between the two calculations. On the other hand the parallel velocity distributions of particles do show some differences between the two calculations seen in the right column of Fig. 25 where the experimental results for particles are compared with those of the calculations. In the calculated results for 58Ni, the two-peak structure is clearly observed in the simulation with the soft EOS, whereas a single broad peak is seen in that with the stiff EOS. This result is consistent with the calculations reported by Ono ono00 for 40Ca + 40Ca at 35A MeV. This trend is also observed for 64Zn + 92Mo in Fig. 25, but is slightly less prominent. For 64Zn + 197Au no difference is observed between the two calculations. The overall experimental trend for particles favors the stiff EOS.
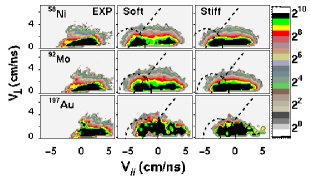
Since the differences observed in the calculations with the soft EOS and stiff EOS in Fig. 3 are not reflected in the free proton distributions but appear in the distributions, one can expect that the difference is related to the velocity distribution of heavier fragments. In Fig. 26, bi dimensional plots of parallel velocity versus perpendicular velocity are shown for fragments with Z=7,8 for the reactions at 47A MeV. The velocity distributions for calculations with the soft EOS show a clear two-peak structure for both 58Ni and 92Mo. On the other hand those of the calculations with the stiff EOS show an elongated distribution. Although in the experiment about 50% of fragments are not detected because of the energy threshold and the detection angles, as shown by dashed lines in the calculated results, one can still clearly see that the experimental IMF distributions favor the calculations with the stiff EOS.
E. Collective flow analysis
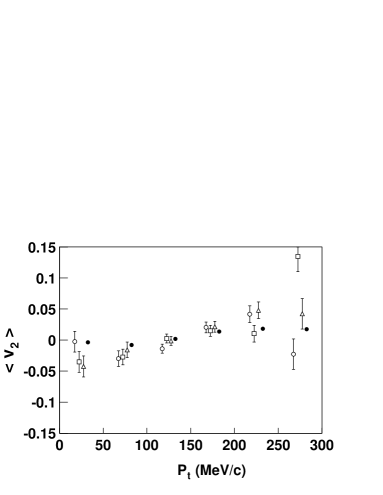
In collective flow analyses, the directed flow, azimuthal angle correlation and elliptic flow have been studied Shen93 ; Shen98 ; Ollitrault98 . These flows are essentially governed by particle emission at early stages. Therefore, the event multiplication in the afterburner does not reduce the statistical errors on the results. Flow is also a rather small effect and a large number of events has to be generated in AMD-V to get reasonable comparisons to the experimental results. Of the three different flow analyses, the differential elliptic flow is an averaged observable and requires a smaller number of events for reasonable comparisons. Therefore, we studied the differential elliptic flow of protons BALi01 , given by the averaged value of , and described by
| (16) |
where N(pt) is the number of protons in a given pt range and pjt is the transverse momentum of the j-th proton. pjx and pjy are its perpendicular momenta in and out of the reaction plane, respectively. The reaction plane is determined, using transverse momentum of emitted particles as proposed by Danielewicz and Odyniec Danielewicz85 . In Fig. 27 values of the experimental and calculated results are shown for protons for 58Ni at 47A MeV. Events in the “Violent” and “Semi-Violent” classes are summed in order to increase statistics. Only protons in the mid-rapidity range (0.25 y/ybeam 0.75) are used. Errors are evaluated from the deviations from zero for values when the azimuthal angle of the reaction plane is randomized. As one can observe, the experimental value shows a small deviation from zero in the energy range studied in this paper. No significant difference is observed between the values extracted from the calculated events for different parameter sets. The calculated values are consistent with the experimental ones within error bars, except the most highest pt, where the statistics becomes poor.
F. Discussion
As seen in Fig. 3, a prominent difference is observed between the calculated results with the soft EOS and with the stiff EOS in the parallel velocity distribution of all free and bound nucleons before the afterburner (t=280 fm/c) for 58Ni and 92Mo at 47A MeV. The distribution of all protons also shows a two-peak (or a shoulder) structure as seen in Fig. 24. However this two-peak structure becomes a broad single-peak distribution for the free protons after the afterburner. The experimental distributions are well reproduced by both calculations with the soft EOS and with the stiff EOS. These good agreements suggest that the prominent difference, seen in the velocity distribution at the early stages of the reaction, may be reflected in the bound nucleons in clusters. This is interesting because, in this case, the difference which appears in the velocity distribution of the clusters may not depend on the details of the multifragmentation process. In other words, the signal of the stiffness of the EOS remains as a fossil signal in the velocity distribution of fragments.
As seen in section V.B, our experimental multiplicity of fragments with Z 4 is overpredicted in all calculations. A similar result has also been observed in the 129Xe+Sn reaction at 50A MeV ono02 . In order to resolve this discrepancy between the experimental and calculated results, an extension was made in the reference, so that the shrinking as well as the diffusion of the wave packets would be taken into account during their propagation in the mean field. This treatment with the new parameter suppresses the dynamical decay of the excited fragments at early stages and reproduces the experimental charge distribution quite well. However the above observation for the parallel velocity distribution indicates that the signature of the stiffness of EOS remains as a footprint in the fragment velocity distributions with or without taking into account this kind of fine tuning of the model.
In the present work, the Gogny interaction with the stiff EOS is favored by the experimental velocity distributions of the clusters. On the other hand the Gogny force with the soft EOS gave a better description for the giant monopole resonance studies Youngblood01 . However one should note the following: (1) In the giant resonance studies, normal nuclear matter is studied, whereas in this work the nature of compressed nuclear matter at high temperature is treated; (2) Our result strongly depends not only on the stiffness of the EOS but also on the reaction dynamics, especially the Pauli blocking during the reaction. In AMD-V Pauli blocking is taken into account exactly for the propagation of the wave packets at all times. For stochastic nucleon-nucleon collisions, the Pauli-blocking is automatically taken into account in the transformation between the physical coordinate space and AMD space. However this transformation, which is given in Eq. (5), is an approximation. One of the consequences of this approximation is seen in the charged particle multiplicity distributions for collisions near the surface, discussed in detail in ref wada00 . When the Pauli-blocking becomes very significant as in the reactions studied in this work, this procedure may cause some errors. In fact at 26A MeV the calculated results for both soft and stiff EOS significantly underpredict the slopes of energy spectra for protons, deuterons and tritons, as seen in Figs. 19,21,22. This suggests that the AMD-V calculations lead to too much transparency at lower energies, resulting in less compression and/or excitation energy at the early stage of the collisions. Therefore it is appropriate to only conclude that, in the framework of the present AMD-V calculations, the stiff EOS is preferred to reproduce the present experimental results.
Another interesting observation in this study is that the different NN collision cross sections do not alter the nuclear semi-transparency. Two formulations have been employed in the present calculations. Although the cross sections are different by a factor of 2-3 on average in the range of proton energies relevant to this study, the apparent effect on the nuclear stopping is rather small, as seen in Fig. 3. This result is quite surprising because in QMD studies of the nuclear collective flow, the effect of different NN cross sections on the balance energy is of a similar order to the effect of different stiffnesses of the EOS Magestro . Ono et al. studied collective flow in the 40Ar + 27Al reaction, using AMD without the diffusion process ono95 . In that study the strength of flow was reduced by about 30% at 45A MeV when , the empirical NN cross section given by Eq. (13), is increased by 50%.
The results of the differential elliptic flow analysis are consistent with the observation of the parallel velocity distributions, although the deviations of the experimental and calculated results from the isotropic distribution are rather small. These results suggest that the diffusion process in AMD-V plays a significant role, not only in the multifragmentation process, but also in the wave packet propagation. This diffusion process tends to randomize the trajectory of wave packets and to smear out collective flow in this energy region.
VI. MULTIFRAGMENTATION MECHANISM
In the previous work on the 64Zn + 58Ni reactions at 35A-79A MeV, we reported that the semi-transparency plays an important role for the multifragmentation process wada00 . However for the 64Zn + 197Au reactions the calculations indicate that all projectile nucleons essentially stop in the target nuclei at all incident energies, as seen in Fig. 3. Therefore it is expected that transparency plays little role in the multifragmentation process for these reactions and that other mechanisms, such as expansion and statistical multifragmentation processes, may play a dominant role in the disintegration of the system. On the other hand the similarity of the charge distributions for all reactions studied here, as seen in Fig. 18, suggests that there is a common feature for the multifragment production in these reactions in which quite different dynamics are involved.
Since the overall experimental results are reproduced reasonably well by AMD-V with the stiff EOS, in the following we will analyze central collision events ( b 3 fm ) for the different systems, calculated with the stiff EOS, in order to elucidate the multifragmentation mechanism in great detail. No afterburner is applied in the analysis in this section.
A. Global character of reactions
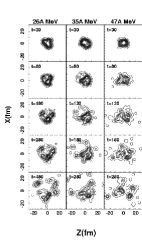
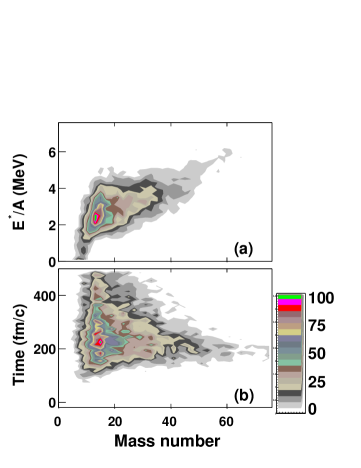
In Fig. 28, density distributions for 197Au are plotted as a function of time. The projectile and the target are fully overlapped around t fm/c and the system starts to expand and undergoes multifragmentation for all incident energies. One should note that prefragments are already recognized at early stages of the reaction ( t 80180 fm/c ). This is quite different from a statistical multifragmentation picture, in which a hot system expands and clusterizes at a low freezeout density Bondorf95 . It should be also noted that the fragment sizes are very similar with each other for three incident energies. Nucleon emissions are identified as early as t 100 fm/c at 35 A and 47A MeV and t 200 fm/c at 26A MeV.
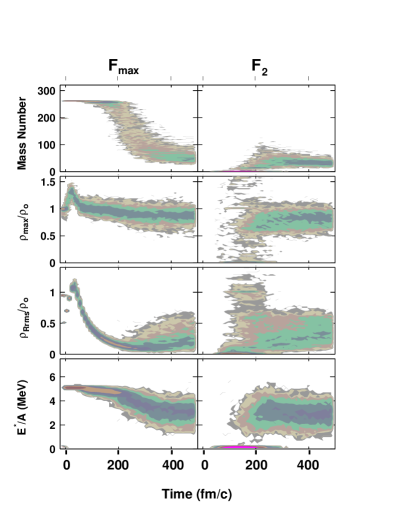
In Fig. 29, the mass number, density and excitation energy of the largest fragment (Fmax) and of the second largest fragment (F2, Z ) are plotted as a function of the reaction time for 197Au at 35A MeV. In order to evaluate these quantities, each calculated event is clusterized in coordinate space with a coalescence radius of 5 fm at a given time. In the first row, the mass numbers of Fmax and F2 are shown. At t 200-300 fm/c, Fmax undergoes multifragmentation. The generated F2 has a similar size to the Fmax after this multifragmentation.
In the second row the maximum density is plotted. In the time of overlap, reaches around 1.4 and quickly returns to the normal density at t 100 fm/c. After that stays around 0.85, of F2 also shows a similar value to that of Fmax. This indicates that prefragments, as seen in Fig. 28, have density close to the normal density when they are formed at early stages and keep this density during the expansion of the system.
In the third row, the density calculated from the root-mean-square radius (Rrms) is plotted. is calculated by assuming that the fragment has a spherical shape, i.e.,
| (17) |
Here , and Ro are the mass number, density and r.m.s. radius of the initial projectile nucleus, respectively. reaches 1.3 at t 30 fm/c , a similar value to , indicating that the shape of the composite system at the time of overlap is nearly spherical. decreases rapidly after that and reaches 0.2 at t 200 fm/c, although is close to the normal density. This indicates that the system at this time has a very deformed shape and non-uniform density. of F2 is also small, indicating that emitted fragments have also an odd shape.
In the fourth row the excitation energies are shown. The excitation energy of a fragmenti, E∗, is calculated by subtracting the calculated binding energy from the internal energy, i.e.,
| (18) |
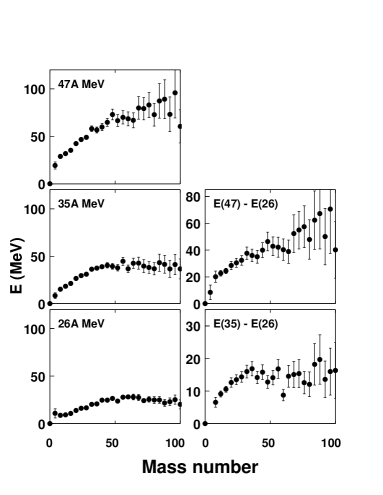
is the expectation value of kinetic energy in the rest frame of the fragment, is that of the effective interaction given in Eq. 9 for the case of the stiff EOS, for example, is that of the Coulomb interaction and EB.E. is the calculated binding energy. The excitation energy of Fmax is E∗/A 5 MeV at the time of overlap and gradually decreases with time. An interesting observation is that the excitation energy of F2 distributes around 3 MeV/nucleon independently on the emission time and shows significantly lower than that of Fmax at t 300 fm/c. At t 400 fm/c, the excitation energy of F2 becomes similar to that of the Fmax. Some of F2 at t 300 fm/c have excitation energies of less than 1 MeV/nucleon. These are Li isotopes, which have 5 MeV/nucleon. A more detailed discussion about cold fragment emission will be given later.
B. Light particle emission
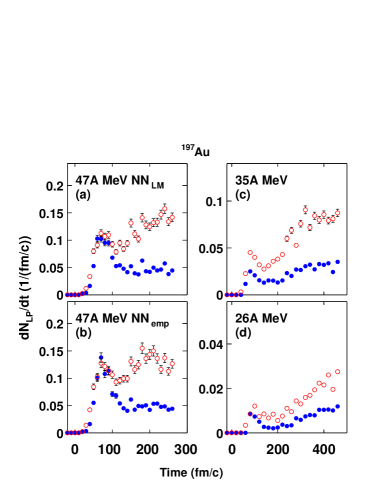
In order to elucidate reaction mechanisms, the emission of light particles (Z 2) is studied. The reactions with 197Au are examined first. In Fig. 31 the emission rates of nucleons emitted as a light particle are plotted as a function of time separately for nucleons from the projectile and for those from the target. At t 30 fm/c, which corresponds to the full overlap time of the projectile and the target, light particles start to emerge and the emission rate shows a bump at t 80 fm/c for all incident energies. At 47A MeV, on the left side of Fig. 31, the emission rate at this bump remains almost equal for nucleons from the projectile and those from the target. This indicates that these nucleons are emitted from a source which consists of equal numbers of the projectile nucleons and the target nucleons, that is, the overlap region of the projectile and target. As seen in Fig. 31 (a) and (b), the emission rates stay more or less the same when the in-medium NN cross section is changed from NNLM to NNemp. At the relative NN energy of 50 MeV, the Li-Machaliedt formulae gives about 50% larger average NN cross section than the empirical formula. This increase of the NN cross section enhances the NN collisions but also reduces the mean free path of the scattered nucleons. The above observation, therefore, suggests that these two effects are more or less balanced and the emission rate stays more or less same at 47A MeV. As discussed later, phenomenologically these nucleons can be described by emission from a moving source with half the beam velocity, which is experimentally identified as the intermediate velocity source.
At lower energies a similar trend is observed, though the emission rates of the target nucleons in the bump are about 50% larger at 35A MeV and 20% larger at 26A MeV than that of the projectile nucleons. These differences are still smaller than the 3:1 ratio of the target mass to the projectile mass. The differences may result from the fact that the absolute emission rate at these energies becomes much smaller than that at 47A MeV and it significantly depends on the details of the emission process, such as the location of the overlap region in the composite system.
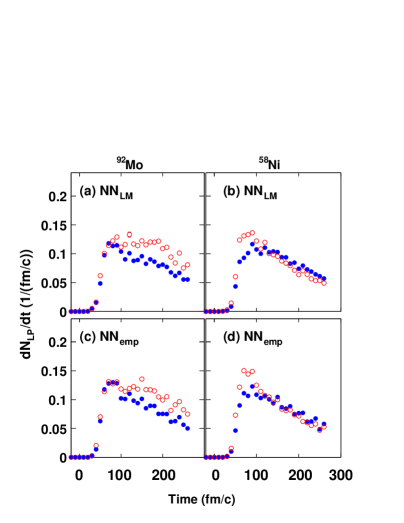
A similar trend is also observed in the other reaction systems. In Fig. 31 results for 58Ni and 92Mo at 47A MeV are shown both for NNLM and NNemp. All emission rates show a bump at t 80 fm/c for nucleons from the projectile and those from the target. The strength of the emission rate at the bump is 1.2 both for NNLM and NNemp. This value is very similar to that for 197Au. This is consistent with the above conclusion that these preequilibrium particles originate from the overlap zone.
After the emission of these preequilibrium particles, as seen in Fig. 31, the emission rate of nucleons from the target increases much faster than that from the projectile. For the reaction at 47A MeV, the ratio between the two reaches a ratio of 3 to 1, essentially equal to the ratio of the target mass to the projectile mass, at t 150200 fm/c. This time becomes t 250300 fm/c for the reaction at 35A MeV and t 500 fm/c for the reaction at 26A MeV.
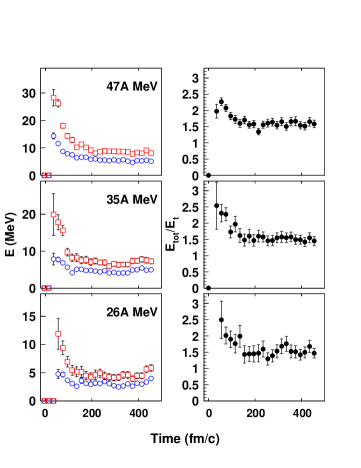
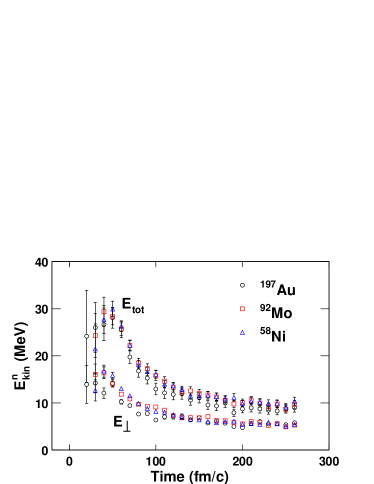
The energy spectra of the light particles also provide valuable information on the reaction mechanism. In order to avoid the Coulomb energy complications for particle emissions, neutron energy spectra are studied. In Fig. 32 kinetic energies of neutrons are plotted as a function of time. Total and transverse kinetic energies are plotted on the left. For all incident energies, both energies decrease rapidly as time increases up to t 120 150 fm/c and decrease very slowly after that. As seen in Fig. 29 at 35A MeV, the composite system undergoes multifragmentation at t fm/c, but the energy spectra change very smoothly around this time range. No effect is observed in the energy spectra. This indicates that the fragments are already formed before this time. On the right, the ratio of the two energies are plotted. The ratio is above 2 at t 100 fm/c and rapidly decreases to a value of 3/2 at around 120-150fm/c, slightly depending on the incident energy. Then the ratio becomes more or less constant after that. The value of 3/2 indicates that the neutron emission source is fully thermalized.
In Fig.33 total and transverse kinetic energies of neutrons are compared for reactions with different targets at 47A MeV. Shapes of the spectra are very similar to each other for all three targets. The energies for the lighter targets are slightly higher, reflecting the semi-transparency for these reactions. The similarities in energies indicate that the preequilibrium emission mechanism for different reactions is similar, even though the semi-transparency is prominent for the reactions with the lighter targets.
C. Fragment emission
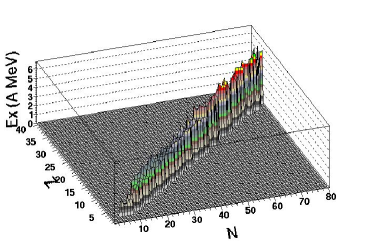
One of the interesting observations in the calculated results in Fig. 29 is that the excitation energy of the second largest fragment is much lower than that of the largest fragment. In order to study this in detail, the excitation energies and emission times of fragments are examined. Results for 197Au at 47A MeV are plotted as a function of fragment mass number in Fig. 34. These values are evaluated at the time when each fragment is identified for the first time. A fragment, identified at a certain time step, often breaks up in the later time steps. A fragment is considered as a newly identified fragment when the fragment appears with a mass number difference of more than 4 mass units between the time span of 10fm/c. In that case, the end of the time span is taken as the emission time of the new fragment. As seen in the upper panel, the distribution shows a peak around E∗/A 2.5 MeV at A 15. For the lighter fragments their excitation energy rapidly decreases with decreasing mass number. For the heavier fragments, on the other hand, the excitation energy slowly increases with increasing mass number and reaches E∗/A 56 MeV at A 60, which is similar to that of the largest fragments at t 200 fm/c. The lower panel indicates that lighter fragments are identified in a broad range of time from 100 fm/c to 500 fm/c, peaking around 250 fm/c, whereas the heavier fragments of F2 are identified mainly around t 200 fm/c.
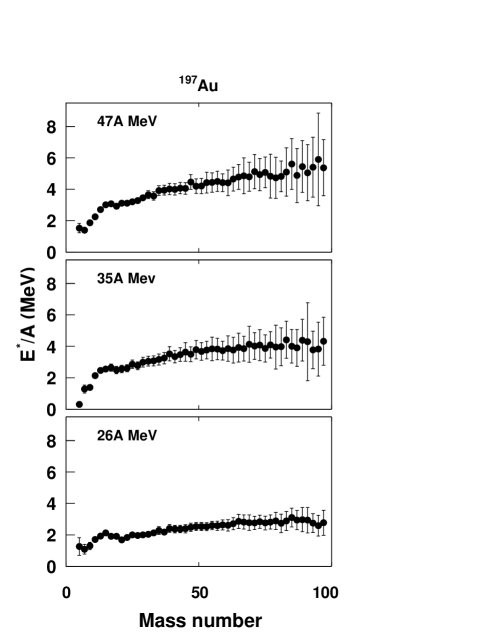
This trend is essentially the same for the reactions at lower incident energies. In Fig. 35, the average excitation energy of fragments is compared for 197Au at all incident energies. For all cases the excitation energy shows a similar trend. At 47A MeV the average excitation energy of the lightest fragment starts less than 2 MeV/nucleon and increases rapidly to about 3 MeV/nucleon Then it increases slowly with increasing mass number. At 26A MeV, the average excitation energies are about 2 MeV/nucleon lower than those at 47A MeV.
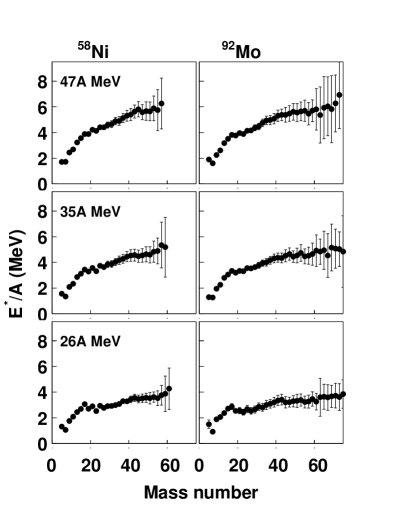
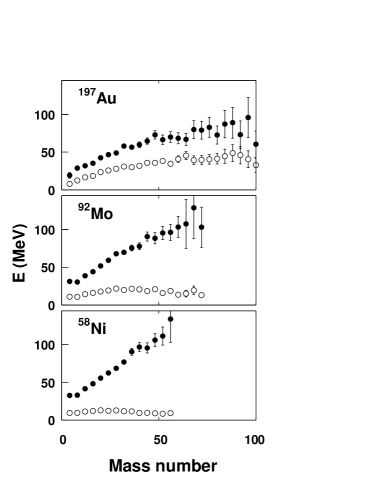
Similar observations are also made in the other reaction systems. In Fig. 36 the average excitation energies of fragments are shown for 58Ni and 92Mo at all incident energies. The excitation energies of fragments at a given incident energy are almost identical and very similar to that for 197Au. This indicates that, in the AMD-V calculations, cold fragment emission is a common feature of intermediate heavy ion reactions.
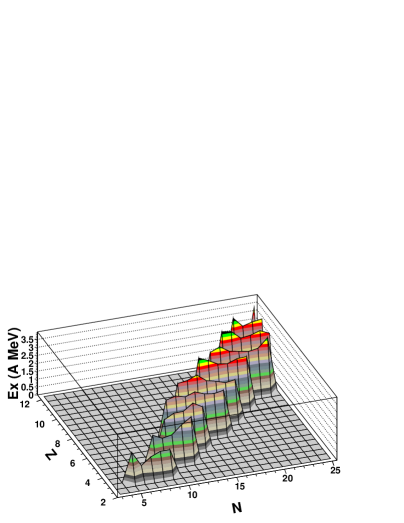
It is also interesting to see the excitation energy distribution for different isotopes with a given atomic charge Z. The distribution of produced isotopes significantly depends on the neutron-proton ratio of the system. In Fig. 37 isotope distributions are compared between 197Au and 58Ni at 47A MeV. As one can see, fragments produced in the reaction with 197Au are distributed much more on the neutron rich side than those with 58Ni. In Fig. 38, the average excitation energy of these isotopes is plotted for 197Au. As seen in the figure, the average excitation energy of isotopes for a given Z shows only a small variation. This variation is typically within less than 1 MeV/nucleon. Very neutron rich isotopes, such as 21O and 24F, have excitation energies similar to those near the stability line.
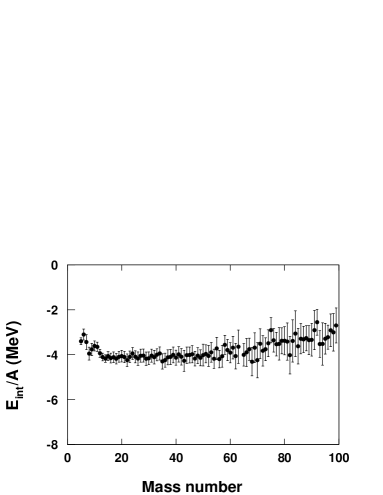
The excitation energies studied above are the calculated internal energies corrected by the binding energy, as given by Eq. 18. The binding energy varies, depending on the mass and charge of fragments. This variation becomes significant for lighter fragments. It is, therefore, interesting to see the distribution of the internal energy without the correction of the binding energy, in order to study the energy partition to the fragments. In Fig. 39, the calculated internal energies are plotted as a function of mass number for 197Au at 47A MeV. The distribution shows a quite different trend, comparing to those seen in the excitation energies in Figs. 35 and 36, especially for fragments with A 15. The internal energies of fragments are almost constant and even slightly increase for the lighter fragments, whereas their excitation energies rapidly decrease. This is because these fragments are less and less bound with decreasing mass number. For heavier fragments with A 60, the internal energy increases slowly with increasing mass number, which is also seen in the excitation energy distribution. This observation indicates that each fragment carries away more or less the same amount of internal energy per nucleon, which is about -4 MeV/nucleon at 47A MeV. This energy becomes about -5 MeV/nucleon at 26A MeV.
The energy spectra of fragments also provide valuable information about reaction mechanisms. In Fig. 40 the average kinetic energies of fragments are shown on the left column for 197Au. The average kinetic energy increases almost linearly as mass increases. This linear increase results partially from the increase of the Coulomb energy for larger fragments and partially from a possible expansion energy. The Coulomb energy contribution should be similar for the three incident energies, because the fragment charge distributions are similar as seen in Fig. 28. In order to eliminate the Coulomb energy contribution from the kinetic energy, the kinetic energy at 26A MeV is subtracted from those at 47A MeV and 35A MeV. The subtracted results are shown on the right column in the figure. At 47A MeV they still show a significant linear increase as mass increases, whereas at 35A MeV, the linear increase becomes less prominent. As a thermal energy contribution to the fragment kinetic energy should be constant for different mass fragments, this remaining linear increase indicates that these fragments have gone through a significant expansion process. The difference of the expansion energy between 47A MeV and 26A MeV is about 0.5A MeV and 0.1A MeV between 35A MeV and 26A MeV. The sharp drop of the energy difference between these two cases suggests that the expansion energy at 26A MeV is very small ( 0.1A MeV). Therefore we can conclude that the approximate expansion energy is 0.5A MeV at 47A MeV and 0.1A MeV at 35A MeV.
The distributions of fragment kinetic energies are quite different for 58Ni and 92Mo at 47A MeV, reflecting different reaction mechanisms. In Fig. 41 the average total kinetic and transverse energies of fragments are compared for the different targets at 47A MeV. For 197Au, the ratio of the total to the transverse energy is between 1/2 3/2, which indicates the existence of a significant radial expansion. For 58Ni and 92Mo at 47A MeV, the total kinetic energy increases more rapidly as fragment mass increases. At A 50, the average kinetic energy for the 58Ni target becomes almost double of that for the 197Au target. On the other hand the transverse energy does not increase as the total kinetic energy increases and stays around 10 MeV. This indicates that the fragment distribution is stretched along the beam axis. This results from the semi-transparency, as reported in the previous work wada00 .
D. Thermal equilibration time
In Fig. 31 for 197Au, the ratio of the emission rate between the target nucleons and the projectile nucleons reaches a factor of 3 at t 200 fm/c at 47A MeV, t 300 fm/c at 35A MeV and t 500 fm/c at 26A MeV. This factor of 3 is roughly the ratio of the target mass to the projectile mass and expected for nucleon emissions from a thermalized system. However this observation does not mean that the system reaches thermal equilibrium until these late stages, because a significant amount of the target nucleons are carried away by cold light fragments before these times. These fragments decay very slowly and do not contribute to the emission rate at the early stages.
In order to elucidate the thermal equilibration time, the ratio of the excitation energies of the largest fragment (Fmax) and the second largest fragment (F2) is plotted in Fig. 42. When all fragments with Z 3 are taken into account for F2 (circles), the ratio gradually increases and reaches a plateau at t 200 fm/c at 47A MeV, t 250 fm/c at 35A MeV and t 500 fm/c at 26A MeV. These times are very similar to those for which the nucleon emission rates become equal to the 3:1 ratio. On the other hand when only fragments with A 30 are taken into account for F2, the ratio behaves in a drastically different way and stays more or less constant from the earliest time when these heavier fragments are identified. This time is t = 130 fm/c at 47A MeV, 160 fm/c at 35A MeV and 180 fm/c at 26A MeV. The values of the ratios are slightly lower than 1.0, because the excitation energies of A 30 40 are still slightly lower than those of the heavier fragments, as is seen in Fig. 35. This observation indicates that the system is already thermally equilibrated at the earliest times that these heavier fragments can be identified.
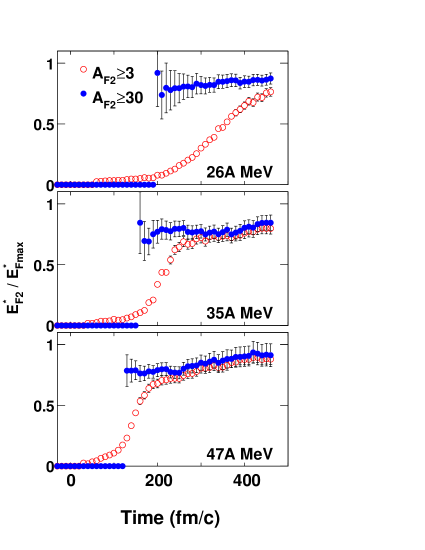
From the nucleon emission rates in Figs. 31 and 31, one can see that the preequilibrium emission ceases at t 120 fm/c at 47A MeV and slightly later at lower incident energies. The ratios of the neutron total to transverse energies on the right side of Fig. 32 reach a value of 3/2 at these times and remain constant after that. The value 3/2 suggests that the neutron emission source is fully thermalized. These times are consistent with those observed from the earliest emission times of F2 with A 30. Therefore from these observations we conclude that the excited nucleus, remaining after the preequilibrium emission, reaches thermal equilibrium at t 120 fm/c at 47A MeV, t 140 at 35A MeV and t 160 fm/c at 26A MeV.
E. Multifragmentation and cold fragment emission
In this subsection we briefly summarize the observations for the calculated central collision events and draw a scenario for multifragmentation in Fermi energy heavy ion reactions.
For light particle emission we summarize as follows:
-
•
The emission rate of nucleons emitted as light particles shows a maximum at t 80 fm/c for all reactions studied here. At a given incident energy all reactions show similar rates for these preequilibrium particles emitted from the projectile and from the target. The emission rates are insensitive to the change of the in-medium NN cross section. The absolute emission rate decreases significantly as the incident energy decreases, but even at 26A MeV a similar rate is observed for the projectile and target nucleons. These facts suggest that the preequilibrium light particles are emitted from the overlap zone of the projectile and the target.
For fragment emission we summarize as follows:
-
•
Charge distributions of fragments with Z 20 are very similar to each other in the experiments and in the calculations, regardless of the target.
-
•
Cold fragment emission is generally observed for all reactions studied here. The excitation energy for A 10 is E∗/A = 12 MeV. It increases linearly as mass increases and reaches to that of the largest fragment at A 60, remaining essentially constant for heavier fragments. The rapid increase of the excitation energy for fragments with A 15 originates from the variation of the binding energy. The internal energies of fragments show a flat distribution for A 60.
-
•
For 197Au a significant radial expansion is observed at 47A MeV. The expansion energy decreases quickly as the incident energy decreases. The approximate expansion energy is 0.5A MeV at 47A MeV and 0.1A MeV at 35A MeV.
-
•
For the reactions with 58Ni and 92Mo at 47A MeV, a significant semi-transparency is observed.
For the thermal equilibration time we summarize as follows:
-
•
The thermal equilibrium of the system is established around t 120 fm/c at 47A MeV, t 140 fm/c at 35A MeV and t 160 fm/c at 26A MeV.
From these observations we can draw the following scenario for the multifragmentation in the Fermi energy domain:
-
(1) The projectile enters into the target nucleus and creates a hot overlap zone.
-
(2) The overlap zone decays quickly by emitting fast nucleons before thermal equilibrium with the surrounding target nucleons is established.
-
(3) During the preequilibrium emission, the remaining system starts to equilibrate. Nucleons close to each other in the phase space start to form cold fragments which coexist with a hotter nucleon gas. In this stage, cold fragments share almost an equal internal energy per nucleon with each other.
-
(4) The system continues to expand and undergoes multifragmentation with cold fragment emission. This multifragmentation process is accelerated by additional dynamical processes, such as the semi-transparency for 58Ni and 92Mo at 47 A MeV and the radial expansion for 197Au at 47A MeV. These additional dynamical processes drastically change the kinetic properties of the emitted fragments.
VII. DISCUSSION
For the above multifragmentation scenario, the existence of a hot overlap zone and cold fragment formation play important roles. For the existence of the hot overlap zone, many experimental evidences have been accumulated. Since the pioneering work of Awes et al., moving source analyses have been applied to many reaction systems at intermediate energies Awes82 ; Westfall84 ; wada89 ; Prindle98 ; hagel00 ; Santonocito02 . The existence of the intermediate velocity source has been commonly observed in these analyses. The source velocity extracted from these analyses is about half the beam velocity, regardless of the target mass. This has been interpreted as indicating that the source consists of equal amounts of nucleons from the projectile and the target. The apparent temperature of the source increases linearly as the incident energy increases, and is more or less independent of the target mass and the centrality of the reaction wada89 ; Prindle98 ; Santonocito02 . These observations are consistent with preequilibrium emission of light particles from the overlap zone, discussed in the previous section.
A more direct indication for the preequilibrium particle emissions from the overlap zone was reported recently by Verde et al. Verde02 . In that work, two-proton correlation functions were studied using a newly developed imaging source technique. The source image of two protons was derived numerically from the two proton correlation function, without assuming a source shape, such as a Gaussian distribution. This method is capable of determining the source size in the environment in which fast (preequilibrium) and slow (evaporated) components coexist in spectra. The model was applied to 14N + 197Au at 35A MeV and the source size of the preequilibrium protons was extracted. The extracted source size is R 3 fm for all proton energy ranges. (R is the radius at a half density). This source size is comparable to the size of the projectile and much smaller than the size of the target.
Cold IMF emission has been reported in many heavy ion collisions. The temperature of IMFs has been determined from the population of the excited states Pochodzalla87 ; Xu89 ; Nayak92 ; Schwartz93 . In these studies temperatures of T 35.5 MeV have been typically obtained in a variety of intermediate heavy ion reactions. If one uses the relation E∗=aT2 with a=A/10, these temperatures lead to fragment excitation energy of E∗/A = 13 MeV. Marie et al. also reported cold fragment emissions observed in LCP(light charged particle)-IMF correlation studies marie98 . The average charged particle multiplicities for each emitted IMF were evaluated in the 129Xe + Sn reaction at 50A MeV. Using a statistical cascade code, the average excitation energy was determined for each IMF. When the neutron to proton ratio of IMFs is assumed to that of the system, the excitation energy of E∗/A 3 MeV is obtained for fragments with 3 . This energy is significantly lower than the excitation energy ( E∗/A 12 MeV) of the system, but consistent with the value calculated in this study. The correlation experiment has recently been extended from 25A MeV to 150A MeV in the same reaction system Hudan00 . The extracted excitation energy of fragments is E∗/A 3 MeV, independent of the incident energy.
In each of the studies in Refs. marie98 and Hudan00 , however, the extracted excitation energies are slightly decreasing as Z increases, whereas the results of the calculations in Figs. 35 and 36 show a clear increase of the excitation energy as fragment mass increases, especially for the lighter fragments. This difference may result from the fact that, in both of the experimental studies, the fragment isotope distribution was neglected and neutron emission from the fragment was not measured. Thus the average primary fragment mass for a given average primary fragment Z was calculated by (1+f)Z, where f is N/Z of the fragment and it was assumed in Refs. marie98 and Hudan00 that N/Z is that of the composite system. If N/Z is assumed to be that of the valley of the stability rather than that of the composite system, the extracted excitation energies become less than 1.5 MeV/nucleon for most of the fragments. As seen in Fig. 37, for a given Z the calculated distributions of fragment mass are broad and the N/Z value at the peak of the mass distribution is slightly less than that of the system. For example, the distribution of Oxygen isotopes has a peak at 18O, or N/Z = 1.25, for 64Zn + 197Au, which has a composite system of N/Z = 1.39. Since the experimental values are sensitive to the determination of the primary fragment mass and hence the number of emitted neutrons, one needs to take into account the isotope distribution of the fragments for the evaluation of the average excitation energy in order to make more detailed comparisons between the experiments and the calculations.
Recently Cussol suggested that the limitation of the excitation energy of fragments may be related to the neutron (or proton) separation energies of the fragments, using a Classical Molecular Dynamics model Cussol03 . In most heavy ion reactions, the composite system is neutron rich. When light fragments are formed in an equilibrated system, the neutron/proton ratio of light fragments tends to be far away from the stability line and these fragments have small neutron separation energies. These fragments can not hold excitation energy higher than the neutron separation energy and therefore they limit the average excitation energy of the fragments. In AMD-V simulations, however, no systematic correlation is observed between the neutron/proton ratio and the excitation energy, as shown in Fig. 38. The calculated results also show no significant difference between the neutron rich system (64Zn + 197Au ) and more or less symmetric system (64Zn + 58Ni).
The coexistence of cold fragments and gaseous nucleons has recently been suggested by Campi et al., using a Classical Molecular Dynamics (CMD) model Campi02 . In their CMD model, particles interact through a Lennard-Jones potential, which is given by
| (19) |
where and are energy and length scales, respectively. In the reference a thermalized system is provided with a given number of particles and a fixed excitation energy within a small container in high density. At time=0 the container is removed and the system is allowed to expand freely. It undergoes multifragmentation. Fragment size and temperature are examined during the process. Since the particles interact through the above interaction, they tend to move at a distance ro from each other ( V(r) becomes minimum at r=ro ). Using proximity in the phase space and separating gaseous nucleons by the Hill criterium (potential energy + kinetic energy 0.), clusters are identified in the gaseous particle environment. By examining the temperature of gaseous particles and the internal temperatures of the clusters during the expansion, it is revealed that the temperatures are much lower than the temperature of the gaseous particles. The distribution of cluster size is almost independent of the time of the expansion, indicating that the cluster size is independently determined of the particle density.
In AMD-V, nucleons are moving freely in a mean field, but anti-symmetrization tends to maintain clusters with nucleons which are close each other in the phase space. This is illustrated in Fig. 43. In the figure the root-mean-square radius ( Rrms ) of 14C, which is the most abundant light fragment for 197Au, is examined. 14 nucleons in 14C are identified at t=480 fm/c. For these identified 14 nucleons, Rrms is calculated as a function of time. At t 0, the time before the two nuclei touch each other, Rrms shows large values because about 34 nucleons on average originate from the projectile and the rest from the target. At 47A MeV, Rrms reaches 2.6 fm at t = 30 fm/c, the time of the full overlap, and after that, Rrms decreases very slowly. The change in Rrms between t = 30 fm/c and t = 480 fm/c is 10%. This trend is essentially the same for lower incident energies. At 26A MeV, Rrms becomes 2.4 fm at t = 50 fm/c and 2.2 fm at 480 fm/c. The slightly smaller Rrms, compared to that at 47A MeV, reflects the fragment lower excitation energy at 26 A MeV. This indicates that nucleons in light fragments are already close together at the time of the overlap and move together until they are identified as an isolated fragment. The excitation energies of light fragments are small, independently of the emission time, as seen in Fig. 34(b). This indicates that the fragments stay cold and coexist with the hot nucleon gas.
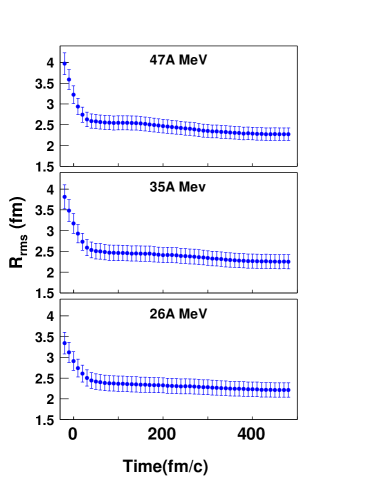
Different dynamics involved in the reactions, such as radial expansion and semi-transparency, drastically change the kinematic characteristics of the emitted fragments. A drastic change in kinematic distributions has been reported in 40Ar induced reactions Colin98 . In that experiment 40Ar beam was bombarded on Cu, Ag and Au targets over a wide range of incident energy (8A -115A MeV). For the central collisions below 44A MeV, the observed nature of the reactions indicates a fusion-like process, whereas a multi-body spray of IMFs is observed at higher incident energies. This observation is consistent with the present results for 58Ni. At 26A MeV the projectile fully stops in the target and fragment emissions become more or less isotropic. On the other hand at 47A MeV, a significant semi-transparency spreads the fragments at forward and backward directions.
The existence of a significant expansion has been suggested based upon the determination of the average kinetic energy of IMFs by the INDRA collaboration Marie97 ; Frankland01 . The extracted energy of the possible expansion is about 0.5A MeV for Xe+Sn at 50A MeV, consistent with the observation in Fig. 40 at 47A MeV. However the value in the above references has been evaluated based on the statistical multifragmentation model, which is not supported in the present work.
VIII. SUMMARY
A detailed study has been presented for three reaction systems, 64Zn + 58Ni, 92Mo and 197Au, at three incident energies, 26A, 35A, 47A MeV. Multiplicity distributions, charge distributions, energy spectra and velocity distributions of the reaction products have been measured. Detailed comparisons have been made between the experimental results and those of the calculations with two different effective interactions, corresponding to a soft EOS (K=228 MeV) and a stiff EOS (K=360 MeV). For light particles the main characteristic features of the above observables are generally well described by all three calculations, although some significant discrepancies are observed in all cases. Experimental proton multiplicity distributions, for example, favor the calculations with the soft EOS, whereas those of the particles favor the calculations with the stiff EOS. For the fragments with Z 3 the experimental energy spectra clearly favor the calculations with the stiff EOS, although the multiplicity of IMF’s is overpredicted by a factor of 1.5-2 for 58Ni and 92Mo and 2-3 for 197Au. The velocity distributions of particles and IMF’s also show a clear difference between calculations with the soft EOS and the stiff EOS, relating to the velocity distribution of nucleons in an early stage of the reaction. The experimental velocity distributions of these particles clearly favor the calculations with the stiff EOS. Two different formulations for the in-medium NN cross sections were used in this study, but the effect of changing the NN cross section is rather small on the observables and no conclusive evidence favoring one of these formulations has been found.
The mechanism of the multifragmentation process was explored, using central collision events of AMD-V, calculated with the stiff EOS. Preequilibrium light particle emission from the overlap zone and multifragmentation with cold fragment emission are commonly observed in all reactions. The thermal equilibration times observed in the calculated results are t 120 fm/c at 47A MeV, t 140 fm/c at 35A MeV and t 160 fm/c at 26A MeV. Cold fragments are formed by nucleons close to each other in phase space at early stages and they stay cold in a hotter nucleon gas, exhibiting an almost equal internal energy per nucleon. Then the system expands and undergoes multifragmentation with cold fragment emission. For at 47A MeV a significant radial expansion takes place and for 58Ni and 92Mo at 47A MeV, semi-transparency becomes significant. The kinematic characteristics of emitted fragments change drastically, depending on the additional dynamics involved. Many existing experimental results are consistent with the mechanisms suggested by the calculated AMD-V events.
I ACKNOWLEDGMENTS
We thank the staff of the Texas A&M Cyclotron facility for their support during the experiment. We also acknowledge the staff of the RIKEN VPP700E supercomputer facility and Dr. I. Tanihata and Dr. Y. Yano for allowing the use of the facility. We further thank Dr. R. J. Charity for providing us the GEMINI code. This work was supported by the U.S. Department of Energy under Grant No. DE-FG03-93ER40773 and the Robert Welch Foundation.
References
- (1) P. Chomaz, Proceeding of the INPN 2001 Conference, Berkeley, Ca., July, 2001.
- (2) A. Bonasera, M. Bruno, C. O. Dorso P. F. Mastinu, Riv. Nuovo Cimento 23, 1 (2000).
- (3) L. G. Moretto and G. J. Wozniak, Annu. Rev. Nucl. Part. Sci. 43, 379 (1993) and reference threrin.
- (4) J. P. Bondorf, H. T. Feldmeier, S. Garpman, and E. C. Halbert, Phys. Lett. 65B, 217 (1976).
- (5) L. Wilets, E. M. Henly, M. Kraft and A. D. Mackeller, Nucl. Phys. A282, 341 (1977).
- (6) A. R. Bodmer and C. N. Panos, Phys. Rev. C15, 1342 (1977).
- (7) J. Aichelin and H.Stöcker, Phys. Rev. Lett. 176, 14 (1986)
- (8) J. Aichelin, Phys. Rep. A202, 233 (1991).
- (9) M. Papa, T. Maruyama and A. Bonasera, Phys. Rev. C64, 024612 (2001).
- (10) D. H. Boal and J. N. Glosli, Phys. Rev. C38, 2621 (1988).
- (11) Toshiki Maruyama, K. Niita and A. Iwamoto, Phys. Rev. C53, 297 (1996).
- (12) J. Lukasik and Z. Majka, Acta. Phys. Pol. 24B, 1953 (1993).
- (13) R. Wada et al., Phys. Rev. C62, 034601 (2000).
- (14) H. Feldmeier, Nucl. Phys. A515, 147 (1990).
- (15) A. Ono, H. Horiuchi, Toshiki Maruyama and A.Ohnishi, Prog. Theo. Phys. 87, 1185 (1992).
- (16) J. Schnack and H. Feldmeier, Phys. Lett. B409, 6 (1997).
- (17) A. Ono and H. Horiuchi, Phys. Rev. C53, 2958 (1996).
- (18) A. Ono, Phys. Rev. C59, 853 (1999).
- (19) R. Wada, K. Hagel, J. Cibor, J. Li, N. Marie, W. Q. Shen, Y. Zhao, J. B. Natowitz and A. Ono, Phys. lett. B422, 6 (1998).
- (20) A. Ono, S. Huddan, A. Chbihi and J. D. Frankland, Phys. Rev. C66, 014603 (2002).
- (21) G. Tabacaru et al., Nucl. Inst. Method A428, 379 (1999).
- (22) F. Bernachi et al., Nucl. Inst. Method A281, 137 (1989).
- (23) F. Hubert, R. Bimbot and H. Gauvin, Atomic Data and Nuclear Data Tables 46, 1 (1990).
- (24) R. P. Schmitt et al., Nucl. Inst. and Meth. A354, 487 (1995).
- (25) J. Dechargé and D. Gogny, Phys. Rev. C43, 1568 (1980).
- (26) A. Ono, Prog. Theo. Phys. Suppl. 140, 134 (2000).
- (27) F. Haddad, F. Sebille, M. Farine, V. de la Mota, P. Schuck and B. Jouault, Phys. Rev. C52, 2013 (1995).
- (28) W. D. Myers and W. J. Swiatecki,LBL preprint 36803, 1994; Nucl. Phys. A601, 141 (1996).
- (29) A. Ono, H. Horiuchi and T .Maruyama, Phys. Rev. C48, 2946 (1993).
- (30) G. Q. Li and R. Machleidt, Phys. Rev. C48, 1702 (1993).
- (31) G. Q. Li and R. Machleidt, Phys. Rev. C49, 566 (1994).
- (32) R. Nebauer, J. Aichelin, Nucl., Phys. A650, 65 (1999).
- (33) A. Ono and H. Horiuchi, Phys. Rev. C53, 2341 (1996).
- (34) R. J. Charity et al., Nucl. Phys. A483, 371 (1988).
- (35) A. Trzcinski, B. Zwieglinski, U. Lynen and J. Pochodzalla, J. Neutron Reaserch, vol.8, pp 85-117. See also references therein.
- (36) J. Poitou and C. Signarbieux, Nucl. Inst. and Meth. A114, 411 (1978).
- (37) C. Zeitnitz and T. A. Gabriel, “The GEANT-CALOR Interface and benchmark calculations of the ZEUS test calorimeters”, Nucl. Inst. Meth. A349, 106 (1994) http::wswww.physik.uni-mainz.de/zeitnitz/gcalor/gcalor.html.
- (38) GEANT 3.12 http::wwwinfo.cern.ch/asd/geant/index.html
- (39) W. Q. Shen et al., Nucl. Phys. A551, 333 (1993).
- (40) W. Q. Shen et al., Phys. Rev. C57, 1508 (1998).
- (41) J. Y. Ollitrault, Nucl. Phys. A638, 195c (1998)
- (42) B. A. Li, A, T. Sustich and B. Zhang, Phys. Rev. C64, 054604 (2001).
- (43) P. Danielewicz, and G. Odyniec, Phys. Lett. B157, 146 (1985).
- (44) D. H. Youngblood, Nucl. Phys. A687, 1c (2001).
- (45) A. Ono and H. Horiuchi, Phys. Rev. C51, 299 (1995).
- (46) J. P. Bondorf, A. S. Botvina, A. S. Iljinov, I. N. Mishustin, and K. Snepen, Phys. Rep. 257, 133 (1995).
- (47) D. J.Magestro, W. Bauer and G. D. Westfall,, Phys. Rev. C62, 041603R (2000) and references therein.
- (48) T. C. Awes, S. Saini, G. Poggi, C. K. Gelbke, D. Cha, R. Legrain and G. D. Westfall, Phys. Rev. C25, 2361 (1982).
- (49) G. D. Westfall et al., Phys. Rev. C29, 861 (1984).
- (50) R. Wada et al., Phys. Rev. C39, 497 (1989).
- (51) D. Prindle et al., Phys. Rev. C57, 1305 (1998).
- (52) K. Hagel et al., Phys. Rev. C62, 034607 (2000).
- (53) D. Santonocito et al., Phys. Rev. C66, 044619 (2002).
- (54) G. Verde et al., Phys. Rev. C65, 054609 (2002).
- (55) J. Pochodzalla et al. Phys. Rev. C35, 1995 (1987).
- (56) H. M. Xu et al. Phys. Rev. C40, 186 (1989).
- (57) T. K. Nayak et al. Phys. Rev. C45, 132 (1992).
- (58) C. Schwartz et al. Phys. Rev. C48, 676 (1993).
- (59) N. Marie et al. Phys. Rev. C58, 256 (1998).
- (60) S. Hudan et al. Procceding of the XXXVIII International Winter Meeting on Nuclear Physics, Editted by I. Iori and A. Moroni, Bormio, 2000; S. Hudan Ph.D theisis, Universite de Caen 2001, GANIL T 01 07
- (61) D. Cussol et al. arXiv:nucl-th/030306, March 2003.
- (62) X. Campi, H. Krivine, E. Plagnol and N. Sator arXiv:cond-mat/0212275, December 2002.
- (63) E. Colin et al. Phys. Rev. C57, R1032 (1998).
- (64) N. Marie et al. Phys. Lett. B391, 15 (1997).
- (65) J. D. Frankland et al. Nucl. Phys. A689, 940 (2001).