Cross sections relevant to gamma-ray line emission in solar flares: 3He-induced reactions on 16O nuclei
Abstract
Gamma-ray production cross sections have been measured for gamma-ray lines copiously emitted in the 3He bombardment of 16O nuclei: the 937, 1042 and 1081 keV lines of 18F and the 1887 keV line of 18Ne. Four Ge detectors with BGO shielding for Compton suppression were used to measure the angular distributions of the gamma-rays. The excitation functions have been obtained for 3He bombarding energies from 3.7 to 36 MeV. Total cross sections are tabulated for calculations relevant to gamma-ray astronomy. The importance of these lines as diagnosis for the presence and properties of accelerated 3He in solar flares is discussed in light of the measured cross sections.
pacs:
25.20.Lj, 25.55.-e, 96.60.Rd, 96.40.FgI Introduction
Solar flares have been historically divided into two classes, impulsive and gradual, based on the time duration of their soft X-ray emission (see rea99 ). They are, however, also well characterized by the abundances of the energetic particles accelerated in these events and detected in the interplanetary space. In particular, impulsive flares are generally associated with enormous enhancements of accelerated 3He: the measured 3He/4He abundance ratios are frequently 3–4 orders of magnitude larger than the corresponding value in the solar corona and solar wind where 3He/4He510-4 (see mas02 ). These solar energetic particle events have been the subject of many experimental and theoretical investigations aiming at the identification of the resonant acceleration mechanism causing the 3He enrichments (see pae03 and references therein).
Independent information on the accelerated particle composition and energy spectrum, as well as on solar ambient abundances, density and temperature, can be obtained from observations of the gamma-ray line emission produced by nuclear interactions of the energetic particles with the solar atmosphere (see sha01 ). The recent launch of the RHESSI satellite offers, in particular, the possibility of high-resolution spectroscopic analyses of this emission lin00 . Mandzhavidze et al. man97 pointed out that the reaction 16O(3He,)18F∗ leads to strong line emission at 937, 1042 and 1081 keV, which can be used as diagnosis for the presence and properties of accelerated 3He. The 937 keV line, as well as a significant line feature at 1.02 MeV have already been identified in data of the moderate-resolution gamma-ray spectrometers SMM/GRS and CGRO/OSSE sha98 . Analysis of these detections suggested that the flare-averaged 3He/4He abundance ratio could be 0.1 and that in some flares 3He/4He1 sha98 ; man99 .
However, these analyses were based on gamma-ray production cross sections evaluated from partial laboratory data (see koz02 ): excitation functions for the production of the 937, 1042 and 1081 keV lines from the reaction 16O(3He,)18F∗ were measured for laboratory 3He energies ranging from 2.6 to 4 MeV only heg80 ; at higher energies, the gamma-ray cross sections were estimated from data on 18F total production, obtained through the detection of the decays of this isotope (=109.77 m).
We have measured the cross sections for the production of the 937, 1042 and 1081 keV lines in 3He+16O reactions, for 40 3He energies ranging from 3.7 to 36 MeV. In addition, we have considered the production of the 1887 keV line from deexcitation of the first excited state of 18Ne, which is populated by the reaction 16O(3He,)18Ne. Indeed, we suggest that the detection in solar flares of this relatively strong line could allow one to obtain valuable information on the energy spectrum of the accelerated 3He, by comparing its intensity to that of the 937 keV line. This is discussed in section IV, together with the overall relevance of these measurements for gamma-ray spectroscopy of solar flares. The experiment and the data analysis are described in sections II and III, respectively.
II Experimental procedure
The experiment was performed at the Tandem accelerator of the IPN-Orsay. Together with the cross sections for gamma-ray production from 3He+16O reactions, we studied in the same experiment the reaction 24Mg(3He,)26Al, which is relevant to the production of 26Al in the early solar system dup03 . The 3He-induced reactions on 16O and 24Mg were successively studied at each beam energy by means of a multiple target holder, which was shifted in the vertical direction with a geared engine remote-controlled from the data acquisition room. For each 3He energy, the beam position and spot size were first controlled optically with an alumina foil mounted on the target holder. Then, the magnesium- and oxygen-containing targets were successively placed in the beam. The gamma-ray production cross sections were measured for 40 beam energies, in small steps of 250 to 500 keV from 3.7 to 15 MeV and at 18, 20, 21, 25, 30 and 36 MeV. The beam current was integrated in a Faraday cup located 1.4 m behind the target. Typical beam intensities were 10-20 nA.
Several target foils were used for the 3He+16O measurements. From =3.7 to 7.25 MeV and at 9 and 10 MeV, we used a tantalum-oxide target (chemical composition Ta2O5) of 800 g/cm2 evaporated on a carbon foil backing of 90 g/cm2. Above 7.25 MeV, we essentially used two Ta2O5 targets of 1.5 mg/cm2 evaporated on carbon foils of 130 g/cm2, as well as two self-supporting Mylar foils (chemical composition C10H8O4) of 3.213 mg/cm2 (23 m) for =12.5, 18, 21, 25, 30 and 36 MeV. The thicknesses of the Ta2O5 targets were chosen for the 3He energy loss in the targets to be similar to the beam energy steps of 250 keV below 10 MeV, in order to avoid significant gaps in the excitation functions. The reason of using Mylar targets instead of Ta2O5 targets at the highest energies was to avoid a too intense production of neutrons and gamma-rays from reactions with the Ta nuclei. Repeated measurements at the same energies allowed to ensure the stability of the various targets. After the experiment, the thickness of one of the Ta2O5 targets was checked by a Rutherford backscattering measurement performed at the ARAMIS accelerator of the CSNSM with a 4He beam of 3.085 MeV energy. From this measurement and the observed consistency of cross section data measured with different targets at the same energies, the uncertainty on the target thicknesses was estimated to be 10%.
The gamma-rays were detected with four large volume, high purity Ge detectors with BGO shielding for Compton suppression nol94 . The four detectors were placed horizontally in front of 2 mm-thick aluminum-windows of the reaction chamber and at the laboratory angles =90∘, 112.5∘, 135∘ and 157.5∘ with respect to the beam direction. The Ge crystals were located at about 37 cm far from the target. The detection efficiencies were measured at three different times by placing at the target position four radioactive sources calibrated in activities to 1.5%: 60Co, 88Y, 137Cs and 152Eu. These sources provide a dozen of gamma-ray lines of relatively high intensities from 122 to 1836 keV. The uncertainties in the absolute efficiencies were determined from these three measurements to be 7% for the detectors at 112.5∘, 135∘ and 157.5∘, and 15% for the detector at 90∘ due to an additional absorption of the gamma-rays in the target holder. The efficiencies at 1333 keV (60Co) were (1.670.25)10-4, (2.280.16)10-4, (1.900.13)10-4 and (1.970.14)10-4, for the detectors at 90∘, 112.5∘, 135∘ and 157.5∘, respectively.
Conventional electronic and computing techniques were used to translate the detector output signals into pulse height spectra. The dead time of the system was precisely determined with a set of pulsers which were fed into the Ge detector preamplifiers and into a scaler that was triggered by the data acquisition system. We assessed an error of 3% in the dead-time correction, which was 20% for most of the measurements, but as high as 60% for the highest beam energies.
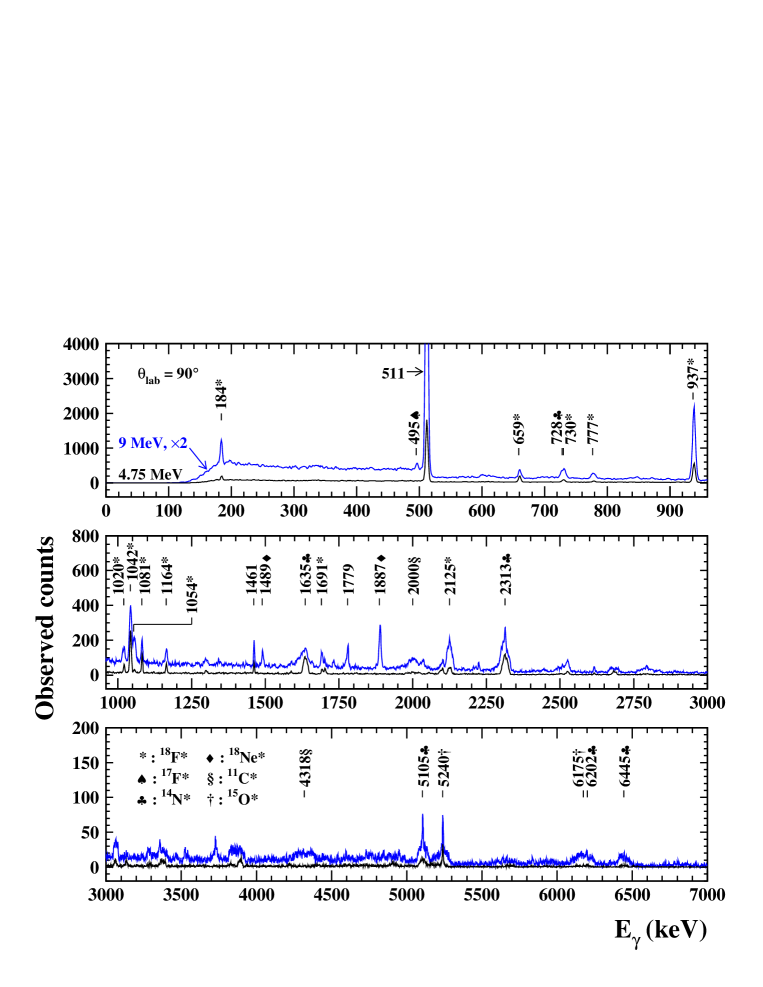
Sample gamma-ray spectra are shown in Fig. 1 for the Ta2O5 target of 800 g/cm2 on the carbon backing. We see a variety of lines produced by 3He-induced reactions on 16O and 12C nuclei. For this target, the 16O-to-12C number ratio is N(16O)/N(12C)=1.20.2, which is lower by a factor of 2 than the corresponding abundance ratio in the solar atmosphere [N(16O)/N(12C)]sol=2.4 and89 . The first and second escape peaks are almost invisible and the Compton background is strongly suppressed by the BGO anticoincidence system. For =4.75 MeV (lower spectrum in Fig. 1), all significant lines arise from the exothermic reactions 16O(3He,)18F, 12C(3He,)14N and 16O(3He,)15O.
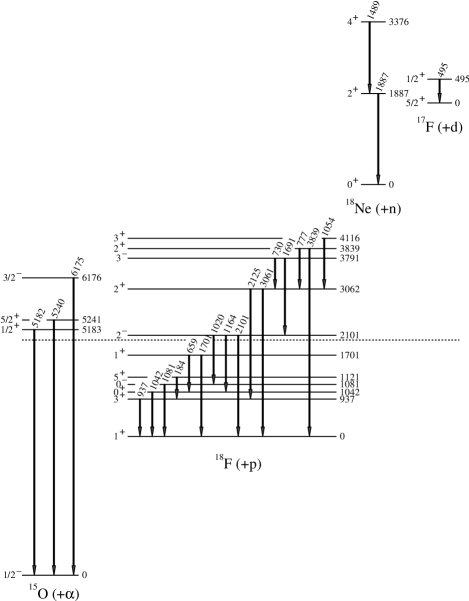
Apart from the strong 511 keV emission, the most intense line is at 937 keV and originates from the deexcitation of the first excited level in 18F (Fig. 2). This line is relatively narrow because the mean-life of the 937 keV state, =67.62.5 ps til95 , is greater than the slowing down time of the recoiling 18F ions in the target material, such that the gamma-ray emission happens predominantly near rest. The reaction 16O(3He,)18F also produces four lines, at 1020, 1042, 1054 and 1081 keV, which could contribute to the 1.02 MeV line emission feature detected in solar flares with SMM/GRS and CGRO/OSSE sha98 .
The strongest lines from the reaction 12C(3He,)14N are at 2313, 1635 and 5105 keV. It was not possible to extract reliable cross section data for 3He+12C reactions in this experiment, because the Ge detectors were not shielded enough from gamma-rays produced in the graphite material of the Faraday cup. In solar flares, these three lines are expected to be also significantly excited by inelastic scattering of protons and -particles on ambient 14N koz02 .
The most significant line from the reaction 16O(3He,)15O is at 5240 keV corresponding to the deexcitation of the second excited level in 15O (Fig. 2). The line at 5182 keV from the first excited level in 15O was observed to be significantly weaker.
For =9 MeV, three additional reactions can be identified in the gamma-ray spectrum shown in Fig. 1: the reaction 16O(3He,)17F, the reaction 12C(3He,)11C producing two broad lines at 2000 and 4318 keV and the reaction 16O(3He,)18Ne producing two narrow lines at 1489 and 1887 keV (Fig. 2). We see that the latter line is relatively strong, which motivated us to determine its production cross section. The relevance of this line for solar flare physics is discussed in section IV.
III Data analysis and results
The cross sections for the production of the 937, 1042 and 1081 keV lines of 18F and the 1887 keV line of 18Ne have been derived from the yields of the full-energy peaks in the energy calibrated spectra. We used a Monte Carlo simulation of the gamma-ray line production in the targets (see kie01 ) to better estimate the peak shapes for the four detection angles. The background yields were determined by interpolation of the count rates below and above the peaks. For the 937 and 1887 keV lines, the systematic error due to the peak shape determination and the background subtraction was estimated to be comparable to the statistical error. For the weaker line at 1081 keV, this systematic error was typically 5% for the detectors at 90∘, 112.5∘ and 135∘, and 10-20% for the detector at 157.5∘. Photopeak integrations were indeed more uncertain for this latter detector, because of a higher gamma-ray background induced by nuclear reactions in the Faraday cup. The case of the 1042 keV line was complicated by the proximity of the 1054 keV line (see Fig. 1). For 5 MeV, these two lines were not fully resolved from each other and we estimated their relative intensities from fits by two Gaussian shaped lines. The associated systematic error was 5-15% for 512 MeV and 15-35% above 12 MeV, as the two lines were almost impossible to distinguish for the highest beam energies. The total error in the gamma-ray line yields were obtained from the linear sum of this systematic error with the usual statistical error.

Examples of measured angular distributions of gamma-rays are shown in Fig. 3. The 1042 and 1081 keV line emissions are isotropics, because the gamma-rays depopulate 0+ and 0- levels, respectively. The 937 and 1887 keV lines are transitions til95 and complete angular distributions were obtained by fitting the measured differential cross sections by the Legendre-polynomial expansion:
| (1) |
where is the Legendre polynomial of order and and are the attenuation coefficients, which can be calculated analytically from the geometry of the detection setup (see fer65 ). We have estimated the corrections arising from the laboratory-to-center-of-mass transformation and from the finite beam spot size to be negligible in this experiment. The total cross section is simply given by
| (2) |
In Fig. 4-7, we show the excitation functions obtained from the fits of the measured differential cross sections. Energies at which cross sections and Legendre-polynomial coefficients are quoted are laboratory 3He energies at the middle of the targets, the horizontal error bars corresponding to the target thicknesses. Stopping powers were calculated with the computer code TRIM ziegl . The vertical error bars correspond to the 1-errors in the coefficients of the Legendre-polynomial fits, except for the 1042 keV line for which we took into account an additional error due to the contribution of the reaction 16O(3He,)18Ne()18F∗ (see below). In the determination of absolute cross sections, errors in the target thicknesses (10%), the beam current integration (5%) and the dead-time correction (3%) must also be included. The resulting overall uncertainties are 13-14% in (937 keV), 13-23% in (1042 keV), 14-16% in (1081 keV) and 13-17% in (1887 keV).

We see that the excitation functions vary with energy in a relatively smooth fashion. Only the cross section for the (3He,) channel (Fig. 7) shows resonances corresponding to compound nuclear effects (see below). The lack of fine structures in the excitation functions is partly due to the use of relatively thick targets (160-330 keV thickness for =3.7-12 MeV).
The highest cross section is found for the reaction 16O(3He,)18F, which reaches a maximum of 21628 mb at 7.3 MeV (Fig. 4). The angular distributions of the 937 keV gamma-rays were found to be slightly anisotropic (see also Fig. 3) and to have little dependence on the 3He bombarding energy: the / coefficient ratio is nearly constant and slightly positive (its mean value is 0.140.12) whereas all values of / are compatible with zero. Because the 937 keV level of 18F has a relatively long mean-life, =67.62.5 ps, and high magnetic dipole moment, =+1.680.15 til95 , it is possible that its nuclear alignment was partly lost by hyperfine interactions in the target prior to the gamma emission.

In solar flares, production of the 1042 keV line includes a contribution from the reaction 16O(3He,)18Ne()18F∗ for 3He energies above the reaction threshold =3.80 MeV. For each decay of 18Ne, 0.07830.0021 gamma-rays of 1042 keV are emitted til95 . The half-life of 18Ne, =16728 ms, is too short for the (3He,) and (3He,) channels to be distinguished in solar flares. In this experiment, however, a small correction of the 1042 keV data had to be made to take into account the nondetection of some (3He,) events due to the escape from the targets of some recoiling 18Ne ions prior to decay. To evaluate this correction, we first estimated the total cross section for the reaction 16O(3He,)18Ne from the differential cross sections measured by Adelberger and McDonald ade70 at =9, 9.5, 10.5, 11.5 and 12.5 MeV, and by Nero et al. ner81 at =13.8, 16.1 and 17.8 MeV, as well as from the 16O(3He,)18Ne excitation function measured in this experiment (Fig. 7). From this estimate, we found that the contribution of 18Ne production to the total 1042 keV line emission is lower than 25%. We then used the measured differential cross sections ade70 ; ner81 to calculate the energy distributions of the recoiling 18Ne ions and performed TRIM simulations for each target to evaluate the fraction of escaping ions. The most important correction was found for the Ta2O5 target of 1.5 mg/cm2 bombarded at =15 MeV. For this data point, we estimated that 60% of produced 18Ne have escaped from the target and the corresponding correction was applied by multiplying the measured cross section by a factor 1.110.11. Corrections for the Mylar targets and for the Ta2O5 targets bombarded at lower energies were less important. The excitation function for the production of the 1042 keV line is shown in Fig. 5.

The lowest cross section measured in this experiment is that of the reaction 16O(3He,)18F, which reaches a maximum of only 314 mb at 5.4 MeV (Fig. 6). The decay of 18Ne also populates the 1081 keV state of 18F, but with a negligible branching ratio of (2.070.28)10-5 til95 .

Results for the 16O(3He,)18Ne reaction are shown in Fig. 7. A broad resonancelike structure dominates the excitation function at 9.5 MeV, which corresponds to an excitation energy of 16.4 MeV in the compound nucleus. This broad resonance has already been reported in the yields of neutron production ade70 . A narrower resonance is also observed at 6.5 MeV, which could correspond to the 13.8 MeV level of 19Ne til95 . The Legendre-polynomial coefficients show a characteristic structure at 7 MeV, with a significant deep for /. Above 8.5 MeV, the / and / coefficient ratios do not significantly vary with energy and their mean values are 0.400.17 and -0.150.23, respectively.
Heggie et al. heg80 have measured the excitation functions for the production of the 937, 1042 and 1081 keV lines in the reaction 16O(3He,)18F∗ up to 4 MeV. Comparison of their results with the cross sections we obtained at the lowest energies show an overall agreement of 20%. The results of our gamma-ray production measurement can also be compared with the cross section for 18F total production from 3He+16O reactions, which has been extensively studied by an activation method (see fit77 ). The reported excitation function has a very similar overall shape to the one of the sum of the four excitation functions measured in our experiment and is 20% higher. The difference is due to the direct production of 18F and 18Ne in their ground states, as well as to their production in excited levels above 1081 keV (18F) and 1887 keV (18Ne) decaying directly to their ground states.
In order to provide data in a convenient form for gamma-ray astronomy, we have averaged the measured cross sections over 1-MeV energy intervals up to 15 MeV and over 5-MeV energy intervals at higher laboratory energies. The results are given in Table 1. Below 15 MeV, average values were generally obtained from linear interpolations between adjacent data points. At higher energies, we performed fits to the cross section data by polynomial or exponential curves (see Fig. 4-7). We estimated the uncertainty induced by this procedure to be generally negligible as compared with the overall errors in the measured cross sections, except for (1887 keV) at =6 and 7 MeV. For these two values, we quadratically added errors of 25% and 10%, respectively, due to the resonance at 6.5 MeV (Fig. 7).
| (937 keV) | (1042 keV) | (1081 keV) | (1887 keV) | |
|---|---|---|---|---|
| (MeV) | (mb) | (mb) | (mb) | (mb) |
| 3 | 21111From Ref. heg80 , fig. 2. The error is 15%, including an uncertainty of 12% in the target thickness. | 9.4111From Ref. heg80 , fig. 2. The error is 15%, including an uncertainty of 12% in the target thickness. | 9.3111From Ref. heg80 , fig. 2. The error is 15%, including an uncertainty of 12% in the target thickness. | 0 |
| 4 | 60 8 | 41 5 | 17 3 | 0 |
| 5 | 118 15 | 60 8 | 26 4 | 0 |
| 6 | 172 22 | 75 11 | 24 3 | 7.0 2.0 |
| 7 | 212 27 | 70 11 | 21 3 | 31 5 |
| 8 | 187 24 | 56 9 | 17 2 | 35 5 |
| 9 | 157 20 | 44 7 | 11 2 | 49 7 |
| 10 | 127 16 | 35 6 | 9.6 1.4 | 51 7 |
| 11 | 102 13 | 32 5 | 7.9 1.2 | 38 5 |
| 12 | 94 12 | 24 5 | 6.2 1.0 | 38 5 |
| 13 | 71 9 | 20 4 | 5.4 0.9 | 33 5 |
| 14 | 66 9 | 17 3 | 4.8 0.8 | 32 4 |
| 15 | 56 7 | 15 3 | 4.4 0.7 | 30 4 |
| 18 | 41 5 | 10 2 | - | 21 3 |
| 23 | 23 3 | - | - | 13 2 |
| 28 | 15 2 | - | - | 9.4 1.6 |
| 33 | 12 2 | - | - | - |
IV Discussion
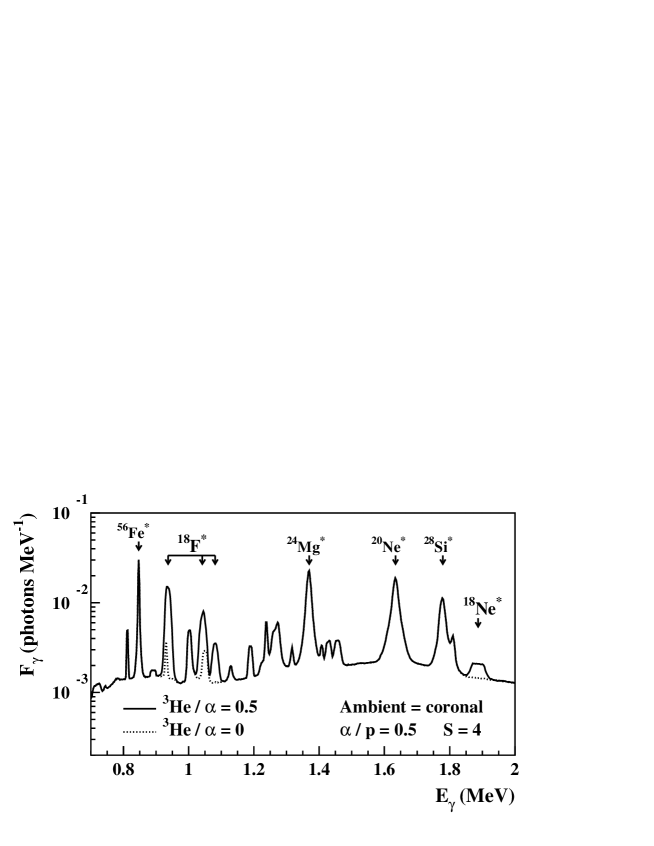
To discuss the expected emission of the 3He-produced lines in solar flares, we show in Fig. 8 two calculated gamma-ray line spectra, assuming an accelerated particle composition with or without 3He. We used the code developed by Ramaty et al. ram79 ; koz02 , in which we incorporated the cross section values of Table 1. At higher 3He energies, we extrapolated the four cross sections assuming the same energy dependence as estimated by Kozlovsky et al. koz02 for the 16O(3He,)18F∗ reactions. In practice, we added two values for (937 keV), 3.4 mb at 60 MeV and 1.6 mb at 90 MeV, two values for (1042 keV), 3.6 mb at 30 MeV and 0.9 mb at 60 MeV, one value for (1081 keV), 1 mb at 30 MeV, and two values for (1887 keV), 2 mb at 60 MeV and 0.9 mb at 90 MeV. In Fig. 8, these extrapolations account for 3% of the 3He line strengths.
The calculations were performed in a thick target interaction model, in which the accelerated particles produce the nuclear reactions while they slow down in the solar atmosphere. Gamma-ray line spectroscopic analyses of solar flare emissions have shown that the composition of the gamma-ray production regions is generally close to coronal (see ram95 ): the abundances of the low FIP (first ionization potential) elements Mg, Si and Fe relative to the high FIP elements C and O are enhanced by a factor of 4–5 rea94 in comparison with photospheric abundances. We took the coronal abundances from Ref. rea94 , except for He/H for which we adopted the helioseismological value He/H=0.084 ric98 . For the accelerated particles, we used an impulsive-flare average composition obtained from solar energetic particle measurements rea95 , except for / for which we used an abundance ratio of 0.5. Such a relatively high concentration of accelerated -particles has been proposed to explain the intense -4He fusion lines observed in several flares (see sha98 ; man99 ). The two gamma-ray spectra shown in Fig. 8 were calculated for 3He/=0 (dotted line) and 3He/=0.5 (solid line). The latter value is typical of the 3He enrichment of the solar energetic particles accelerated in impulsive flares (see rea94 ). For the source energy spectrum of the fast ions, we took for all species a power law in kinetic energy per nucleon, , with =4 (see ram96 ).
We see in Fig. 8 that the 937 keV line is relatively strong in comparison with other lines produced by accelerated protons and -particles. However, we also see from the gamma-ray spectrum calculated without accelerated 3He, that analysis of this line can be complicated by the proximity of another line at 931 keV, which is produced in the reaction 56Fe(,)55Fe∗ man99 ; koz02 . In Fig. 9a, we show the fluence ratio of the 931 keV line to the 937 keV line, as a function of the power law spectral index of the accelerated particle energy spectrum. We used for (931 keV) the values supplied in table A3 of Ref. koz02 . The relative contribution of the 931 keV line rapidly diminishes for increasing , because this line is produced for proton energies above the reaction threshold =11.4 MeV, whereas (937 keV) peaks at significantly lower 3He energy per nucleon, 2.4 MeV/nucleon (see Table 1 and Fig. 4). Given the assumed coronal abundance ratio 56Fe/16O=0.16 and the adopted accelerated particle composition with 3He/=0.25, the 931 keV line fluence is 5% of that of the 937 keV line for 4.

As shown in Fig. 8, the 3He line at 1042 keV can also be blended with another significant line, which is produced from the reaction 56Fe(,)58Co man99 ; koz02 . Fig. 9b illustrates that the 1049 keV line should generally be considered, especially if the accelerated particle spectrum is hard (i.e. low values of ). In addition, the analysis of the 1042 keV line can be complicated –as in this experiment– by the proximity of the 1054 keV line also produced in the reaction 16O(3He,)18F∗ (see Fig. 1 and § III).
The 1081 and 1887 keV lines are expected to be separated from other important lines (Fig. 8). They are, however, weaker than the 937 and 1042 keV lines. The 1887 keV line is broader than the three other 3He lines, because it is produced at higher 3He energies. Fig. 9c shows the fluence ratio of the 1887 keV line to the 937 keV line, as a function of the spectral index . We see that the calculated ratio decreases by one order of magnitude, from 0.4 for =2 to 0.04 for =6. Since both lines are produced from 3He-induced reactions on the same 16O target, this ratio is independent of the ambient medium and accelerated particle compositions. It depends only on the accelerated 3He energy spectrum, which is important in understanding the acceleration mechanism in impulsive solar flares (see pae03 ).
It is noteworthy that a significant synthesis of 18F nuclei in solar flares could also be identified through the characteristic, long living, 511 keV emission expected from the decay of this isotope (=109.77 m). The detection of this delayed emission, maybe with the RHESSI satellite, would furthermore provide a new insight into mixing and transport processes in the solar atmosphere.
In summary, the four cross sections measured in this experiment could allow one to determine with a good accuracy the abundance of 3He accelerated in solar flares and interacting in the solar atmosphere. The strongest of the gamma-ray lines from 3He-induced reactions is the one at 937 keV from the reaction 16O(3He,)18F∗, which however, can overlap with a line at 931 keV, produced in the reaction 56Fe(,)55Fe∗. If observed, the 1887 keV line from the reaction 16O(3He,)18Ne∗ would furthermore provide unique information on the energy spectrum of the accelerated 3He.
Acknowledgements.
We would like to thank the operator crew of the Orsay Tandem accelerator for their engagement in the preparation of the experiment, as well as Frédérico Garrido, Claire Boukari, Jacques Chaumont and Catherine Clerc for their assistance in the RBS measurements.References
- (1) D. V. Reames, Space Sci. Rev. 90, 413 (1999).
- (2) G. M. Mason et al., Astrophys. J. 574, 1039 (2002).
- (3) G. Paesold, R. Kallenbach, and A. O. Benz, Astrophys. J. 582, 495 (2003).
- (4) G. H. Share and R. J. Murphy, in GAMMA 2001: Gamma-Ray Astrophysics 2001, edited by Steven Ritz, Neil Gehrels, and Chris R. Shrader, AIP Conf. Proc. No. 587 (AIP, Melville, NY, 2001), p. 603.
- (5) R. P. Lin et al., in High Energy Solar Physics – Anticipating HESSI, edited by Reuven Ramaty and Natalie Mandzhavidze, Astron. Soc. Pac. Conf. Ser. No. 206 (ASP, San Francisco, 2000), p. 1.
- (6) N. Mandzhavidze, R. Ramaty, and B. Kozlovsky, Astrophys. J. 489, L99 (1997).
- (7) G. H. Share and R. J. Murphy, Astrophys. J. 508, 876 (1998).
- (8) N. Mandzhavidze, R. Ramaty, and B. Kozlovsky, Astrophys. J. 518, 918 (1999).
- (9) B. Kozlovsky, R. J. Murphy, and R. Ramaty, Astrophys. J., Suppl. Ser. 141, 523 (2002).
- (10) J. C. P. Heggie, Z. E. Switkowski, and G. J. Clark, NIM 168, 125 (1980).
- (11) J. Duprat et al., in preparation.
- (12) P. J. Nolan, F. A. Beck, and D. B. Fossan, Annu. Rev. Nucl. Part. Sci. 44, 561 (1994). See also URL http://www-csnsm.in2p3.fr/heberges/loan-pool/
- (13) E. Anders and N. Grevesse, Geochim. Cosmochim. Acta 53, 197 (1989).
- (14) D. R. Tilley, H. R. Weller, C. M. Cheves, and R. M. Chasteler, Nucl. Phys. A595, 1 (1995).
- (15) J. Kiener, N. de Séréville, and V. Tatischeff, Phys. Rev. C 64, 025803-1 (2001).
- (16) A. J. Ferguson, Angular Correlation Methods in Gamma-Ray Spectroscopy (North-Holland, Amsterdam, 1965).
- (17) J.F. Ziegler, The Stopping and Range of Ions in Solids (Pergamon Press, New York, 1985). See also URL http://www.SRIM.org/
- (18) E. G. Adelberger and A. B. McDonald, Nucl. Phys. A145, 497 (1970).
- (19) A. V. Nero, E. G. Adelberger, and F. S. Dietrich, Phys. Rev. C 24, 1864 (2001).
- (20) J. Fitschen, R. Beckmann, U. Holm, and H. Neuert, Int. J. Appl. Radiat. Isotop. 28, 781 (1977).
- (21) R. Ramaty, B. Kozlovsky, and R. E. Lingenfelter, Astrophys. J., Suppl. 40, 487 (1979).
- (22) R. Ramaty, N. Mandzhavidze, B. Kozlovsky, and R. J. Murphy, Astrophys. J. 455, L193 (1995).
- (23) D. V. Reames, J.-P. Meyer, and T. T. von Rosenvinge, Astrophys. J., Suppl. Ser. 90, 649 (1994).
- (24) O. Richard, W. A. Dziembowski, R. Sienkiewicz, and P. R. Goode, Astron. Astrophys. 338, 756 (1998).
- (25) D. V. Reames, Adv. Space Res. 15 (7), 41 (1995).
- (26) R. Ramaty, N. Mandzhavidze, and B. Kozlovsky, in High Energy Solar Physics, edited by Reuven Ramaty, Natalie Mandzhavidze, and Xin-Min Hua, AIP Conf. Proc. No. 374 (AIP, Woodbury, NY, 1996), p. 172.