An apparatus to control and monitor the para-D2 concentration in a solid deuterium, superthermal source of ultra-cold neutrons
Abstract
Controlling and measuring the concentration of para-D2 is an essential step toward realizing solid deuterium as an intense ultra-cold neutron (UCN) source. To this end, we implemented an experimental technique to convert para- to ortho-deuterium molecules by flowing D2 gas through a cryogenic cell filled with paramagnetic hydrous ferric oxide granules. This process efficiently reduced the para-D2 concentration from 33.3% to 1.5%. Rotational Raman spectroscopy was applied to measure the residual para-D2 contamination to better than 2 parts in 103, and the hydrogen contamination to 1 part in 103. We also contrast our optical technique to conventional thermal conductivity measurements of the para-D2 concentration, reporting some of the relevant strengths and weaknesses of our implementation of each technique.
1 Introduction
In a recent investigation of solid D2 as a UCN source[1], it was surmised that the yield of UCN is correlated with the spin states of the deuterium molecules. Subsequently, detailed neutron scattering calculations and measurements of the UCN lifetime in mixtures of para- and ortho-deuterium quantitatively verified this conjecture.[2, 3, 4, 5, 6] The work we report here was motivated by our attempt to control the spin state of deuterium and develop a superthermal ultracold neutron source capable of the extremely high UCN yields predicted for pure ortho-D2 crystals by Golub [7, 8] At least three solid deuterium sources are currently under construction.[4, 9, 10]
Our superthermal solid D2 source at Los Alamos Neutron Science Center (LANSCE) can be envisioned as roughly one liter of solid deuterium held at temperatures below 10 K. This block of deuterium is then immersed in a cold neutron flux. UCN are produced when the cold neutrons are downscattered, losing almost all of their energy. Because the source is operated at very low temperatures, the loss rates due to thermal upscattering are very small for UCN and the produced UCN can be efficiently extracted from the source. The ultimate UCN densities one can achieve with a superthermal source are[7]:
| (1) |
where is the UCN density, is the downscattering rate for cold neutrons, and is the UCN survival time in the solid D2. With a careful design, the downscattered neutrons are prevented from subsequent scatterings within the source to establish thermal equilibrium; several orders of magnitude improvement in available UCN densities are expected from these sources. It is also clear from Eq. 1 that longer UCN survival times, , equate to higher UCN densities. Para-deuterium, if present in the source, drastically increases the UCN loss rate and, therefore, decreases and reduces the yielded UCN densities. An essential key to optimizing the performance of a solid D2 UCN source is thus to minimize the concentration of para-D2 in the deuterium. In what follows, we present the results obtained during the first nine months of operation of our UCN source coupled to a para-to-ortho converter. Because we present the results of a development project, the performance of this system was not fully optimized. Nevertheless, the experimental technique is robust; it should form the basis of a workable approach to the operation of a solid deuterium superthermal source of UCN.
In addition, HD, a common contaminant in commercially available deuterium, also greatly reduces the survival time for UCN in our solid deuterium source, simply because of the large neutron absorption cross-section of the hydrogen nucleus. Ideally, our experimental technique for monitoring the para-deuterium concentration in our source should also be useful in monitoring HD levels. As we shall demonstrate, this is the case for the Raman spectroscopy technique presented in this work.
The physics of hydrogen and deuterium solids has been thoroughly discussed in various reviews[11, 12, 13], so we will merely touch on the relevant properties of these crystals. First of all, the deuterium molecule (D2) has a symmetric wave-function under permutations of the two identical nuclei, deuterons, having a nuclear spin . As a result, the ortho state for deuterium () can only have symmetrical molecular rotational states of even , the rotational quantum number, i.e., ; and the para state () can only have anti-symmetrical molecular rotational states of odd , i.e., . At the typical low operational temperatures of superthermal sources, because of the relatively large vibrational excitation energy (first vibrational excitation energy level is 4000K), all of the molecules are expected to be in the vibrational ground state. On the other hand, it is possible to find significant populations of the first () rotational excited states of the molecules (para-D2), in addition to the ground state with (ortho-D2), depending on how the sample is prepared.
The rotational energy spectrum (shown in Fig. 1) of the D2 molecule can be described using a classical dumbbell picture:
| (2) |
where the factor is related to the momentum of inertia, . To a first approximation, meV, in which the separation between the two nuclei, , is 0.74 . The energy required to make the transition from the ground state () to the first excited state () is thus 7.5 meV.

In the high temperature limit all the nuclear spin sub-states are equally populated. This leads to an equilibrium para state concentration of 33.3%. For a free non-interacting gas, transitions between even (ortho) and odd (para) states are prohibited by the spin selection rules. Conversion of para to ortho states involves a nuclear spin flip, which requires, in general, an external interaction potential. In real situations, spontaneous spin flipping occurs through collisions between the aspherical molecules (), whose non-central quadrupole interaction provides a small, yet finite torque to induce spin flip. The resulting time constant for such a self-conversion is, however, very long, and has been measured to be on the order of months[11].
2 Conversion of Para-D2 into Ortho-D2
Our experimental goal is to reduce the para-D2 fraction present in our cryogenic solid D2 source material to the level where it no longer limits the UCN survival time, , in the crystal. This can be achieved by reducing the para-D2 concentration below about 1%. At this level, the UCN loss rate in the crystal due to UCN upscattering from the para-D2 is roughly the same as the loss rate due to nuclear absorptions by the deuterium nuclei.[2] Because the neutron absorption losses in the deuterium itself are unavoidable, little improvement can be obtained by further lowering the para-deuterium concentration.
An effective way to reduce para state concentrations is to pass D2 gas through a system which permits the D2 to rapidly come into thermal equilibrium at a low temperature by inducing a spin flip process. The residual population of the state can be described by the Boltzmann factor, which is characterized by the transition energy, meV( 80 K). When the converter is operated at 17K, the para concentration could in principle be reduced from 33.3% down to = 1%. Converter temperatures below 17K can in principle give a smaller population of para states, but they supply converted D2 with less than the required vapor pressure (30 to 50 Torr) from the converter to sustain ortho-deuterium solid growth in a timely, continuous fashion in our application.
2.1 Catalyzed Conversion
We apply paramagnetic conversion[14, 15] to prepare our deuterium samples. The paramagnetic catalyst agent has a large magnetic field near its surface, on which D2 molecules are temporarily adsorbed and form a Van der Waals layer. The magnetic field gradient induces a relative dephasing between the two precessing nuclear spins, and results in a spin flip. For a single adsorbed molecule this transition rate is nearly temperature independent, and thus the conversion rate is dominated by the gas adsorption probability. Combining these two effects, one can predict that the overall conversion efficiency increases as the catalyst temperature decreases, compatible with our low temperature application.
One of the most effective paramagnetic catalyst materials is hydrous ferric oxide, Fe2O(H2O), a self-supporting metal oxide in the form of colloidal gels.[16] It has an effective surface area of 100300 m2/g.[17, 18, 19] As suggested by Ref.[17], we carried out the initial activation by heating the catalyst up to 130 ∘C for 24 hours inside the converter cell under the vacuum and then back-filled the cell with deuterium gas for preservation. Installation of the converter cell into the vacuum system was performed with care to minimize exposure to the ambient air. After some period of operation, which varied with the conversion load, regeneration of the catalyst was performed with the same activation procedure.
2.2 Design of the Converter
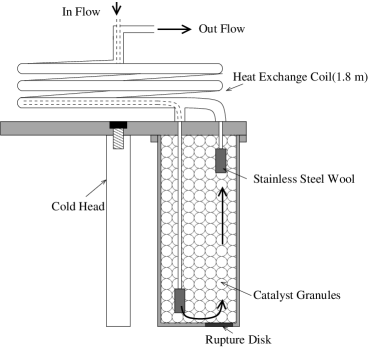
We built the converter chamber out of a cylindrical cell made of OFHC copper, illustrated in Fig. 2. It is attached to the cold head of an air-cooled 4He compression cryopump, Varian CryoTorr 8, which served as a refrigerator. The cryopump has an inner cooling stage (cold head) with a cooling power of 1 W at a temperature of 10K (5W at 20K), which is adequate for our applied conversion load. This closed system of 4He gas compression cryopump provides an easy and compact alternative to the liquid 4He evaporation cooling used in previous experiments[20].
The converter cell’s design features are summarized in the following: the D2 gas exit port is situated at the coolest plate to anchor the temperature of the output converted D2; it also minimizes the temperature gradient across the D2 gas flow. In addition, in order to reduce the heat load onto the cold head, we designed a 180 cm long heat exchange coil made of coaxial stainless steel (S.S.) thin tubes. The inflow gas inside the inner thin tube is precooled by the outflow gas flowing in the outer tube. Its long length increases the thermal resistance and thus minimizes the heat conduction through the S.S. tubes to the ambient environment. With a flow rate of 36 liter/hour (0.6 liter/min) of STP gas, the heat load is about 1W. The heat load is dominated by contributions from the D2 gas specific heat and the ortho/para-D2 conversion energy. The 100 c.c. inner volume of the cell is filled with fine grained catalyst, which is confined in the converter cell by S.S. wool filters plugged into both the gas entrance and the exit ports. A heater is mounted on the cold plate to provide us the capability to control and vary the temperature of the converter. Two temperature diode sensors are separately placed on the top and the bottom of the copper cylinder to monitor the temperature, as well as the gradient. Moreover, in order to tolerate baking for catalyst regeneration, an In/Pb alloy wire is used between the top plate and the converter can for the vacuum seal. This soft alloy has a higher melting point (150∘C) than the regeneration temperature (130∘C). Pure Indium metal (with a melting point of 110∘C) is not compatible with regeneration baking. We also established that these regeneration bake-outs could occur with the cell still mounted to the cold-head of our cryopump, making regeneration of the catalyst quite straightforward.
The operation of this converter is in a continuous mode described in the following. The pressure regulated D2 gas is introduced into the converter; after flowing through the converter in which the catalyst is held below the D2 triple point temperature (18.7K), D2 is converted predominantly into the ortho state with a reduced para contamination of roughly 1%. The converted D2 is then continuously cryopumped onto the superthermal source cryostat (cooled by liquid He). We observed that it was possible to grow a very transparent, large solid block of D2 directly from flowing gas into our source cryostat when the vapor pressure was kept below about 50 torr. The corresponding low D2 flow rate is limited to acceptable levels at which the heat flow into the low temperature end of the cryostat and the growing crystal.
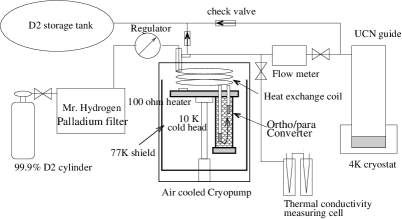
As illustrated in Fig. 3, this para-to-ortho-D2 converter with the 4He compression cryostat is incorporated into the D2 gas handling system, which is used to prepare the UCN source. Cajon VCR S.S. tubes and connectors were used to the maximum extent possible to construct a clean gas handling system. The para-to-ortho converter was put in the downstream of a hydrogen gas purifier (palladium filter) which operates at 400 ∘C. Care was taken to minimize the magnetic surface area inside the apparatus placed after the para-to-ortho-D2 converter, in order to prevent back-conversion and to preserve the fully converted ortho-D2. Our measurements show that when converted D2 gas is passed through our room temperature S.S. tubes and Ni-coated UCN guides and then stored as a solid in our cryostat at low temperatures, we did not observe significant back-conversion over the course of the experiment (typically two days). Details of our UCN source itself can be found elsewhere[6].
3 Measurement of the Ortho/Para-D2 Ratio Inside the UCN Source
We used two different, complimentary measurements to determine the para-D2 concentration in our UCN source. An in-line thermal conductivity measurement with hot wire cells was frequently performed on the outflowing D2 to characterize the performance of the para-to-ortho-D2 converter. Molecular Raman spectroscopy [11] was later conducted on the evaporated D2, which was collected from the cryostat at the end of each operational run of our source.
3.1 Raman Spectroscopy
This optical method uses a visible (far off-resonance) laser to probe D2 molecule gas sample. The rotational Raman spectrum gives information on rotational state populations. For example, for molecules in thermal equilibrium, the total Raman cross-section is formulated as[21]
| (3) | |||||
with ‘’ standing for Stokes lines, and ‘’ for anti-Stokes lines, is the partition function for the rotational states, and is the multiplicity of the nuclear spin states. In the equation above we took cm2 from the absolute rotational Raman cross-section for D2 using the cross-sections quoted for the transition in H2 at room temperature in Fenner[22]. We adjusted the cross-sections in Fenner for the difference in the initial spin states and the rotational state population differences between H2 and D2 gas, and otherwise assumed the same anisotropy in the molecular polarizability tensor. This cross-section yields a consistent, order of magnitude estimate of our measured count rates when the appropriate gas densities, efficiencies and imaging characteristics for our system are applied.

Our experimental implementation of rotational Raman spectroscopy is similar to the approach discussed by Compaan and Wagoner[23]. The setup schematic is shown in Fig. 4. We use an air-cooled CW argon ion laser, American Laser Corp. model 60x, which outputs a single line of unpolarized 488 nm TEM00 beam with a power of 40 mW, as the light source. The laser line is directed and focused by two convex lenses ( = 35 mm) into the center of a cubic sample cell, which is built out of a S.S. housing with 4 flat parallel uncoated quartz windows. A 58 mm Nikon camera lens () is placed close to the cell to collect roughly 5% of the total solid angle of the scattered light. It also images the Raman radiation onto the entrance slit of the spectrometer, which is placed slightly less than one focal length away, yielding a magnification of about 6 for the image of the laser scattering region on the spectrometer slits. The spectrometer is a Jarrel Ash, model 82-000, single grating spectrometer with a focal length of 50 cm. It is equipped with a 1800 g/mm holographic grating blazed at 500 nm. We direct the primary laser path vertically through the cell so that it would be parallel to the entrance slit, for the optimization of the scattered light collection into the spectrometer. A 1/2′′ Hamamatsu R647P PMT is attached to the spectrometer exit slit for light detection, and is operated in single photon counting mode.
A 488 nm narrow band filter (bandwidth = 30 Å), Omega Optical model XR3000-495AELP, placed in front of the spectrometer entrance, introduces a crucial improvement on the performance of this system. This filter compensates for the poor stray light rejection of the single grating spectrometer, and greatly suppresses the background counts in the spectrum, as shown in Fig. 5. The price we paid for using such a filter is it eliminates the first rotational peak, and distorts the second peak. Nevertheless, we used the and peak to extract the ortho- to para-D2 ratio with this spectrometer system. For the bright rotational Raman line in D2, we observed roughly 1000 Hz at the peak of the line.

Some of our data was obtained using a double-grating system, ISA Gemini 180, with a focal length of 180mm. The optical throughput for this system was a factor of two to three less than the single grating system, but required no Raman filter (and therefore all four of the lowest lying Raman rotational lines can be used). A sample spectrum from the double grating system is displayed in Fig. 6. Ultimately, because the background was limited by the dark count rate in the PMT, the single grating system was superior and was adopted for this application.

Our final improvement was made, after these data were obtained, by utilizing a thinner window between the camera lens and the focus of the laser, to reduce distortions due to refraction of the scattered light, and a convex mirror to direct the exiting laser beam back through the cell for a second pass. These improvements resulted in roughly a 30% increase in the light collection efficiency and a signal to background ratio of up to about 250:1 for gas samples at atmospheric pressure and room temperature (see Fig. 7).
3.1.1 Results and Analysis of Raman Spectroscopic Measurements
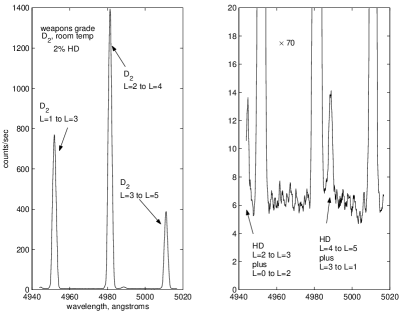
Our strategy to obtain the para-D2 concentration using the rotational Raman spectroscopy is based on a comparison between spectra of the sample with an unknown ortho- to para-D2 ratio and a reference with a known ratio. The measurements were carried out with samples at room temperature (T 300K). Typical spectra obtained from our setup are shown in Fig. 8. According to Eq.(3), the amplitude ratio of the to the peak among the Stokes lines scales with the ratio of para-D2 fraction, , to the ortho-D2 fraction, , as
| (4) |
Here the partition function is a sum of spin multiplicities weighted by the Boltzmann factor over all the odd rotational states of para-D2, i.e.,
| (5) |
and for the sum is over even ’s. When compared with a spectrum of the reference sample measured at the same temperature (room temperature), the statistical weighting factors and the cross sections are canceled out, leaving only the para to ortho ratio, , of the unknown sample. This procedure also cancels out the light collection efficiencies, making extremely high precision measurements (limited by laser stability and knowledge of the reference sample). “Normal” D2 with room temperature equilibrium population of rotational states ( = 1/2) is conveniently used as the reference.

The spectra in Fig. 8 illustrate the effect of para- to ortho-D2 conversion. The shrinkage of the peak height of the converted D2 sample indicates a reduction of the para-D2 concentration from 33.3% (‘+’ curve, with D2 collected before the converter) to 1.54% (“” curve, with D2 collected after the 17 K converter). These spectra also show a noticeable HD peak () next to the ortho-D2 peak.
Because the UCN lifetime in solid D2 is also sensitive to the presence of hydrogen, which strongly absorbs UCN via nuclear capture on the H nucleus, our knowledge of the HD concentration is also crucial in our study of the superthermal S-D2 source. Rotational Raman spectroscopy provides a clean and powerful hydrogen mass spectrometer capability. To clearly identify HD rotational Raman peaks, a minimum peak resolution of 5Å is required. After calibrating with a known concentration of HD, it is possible to produce very sensitive tests of the presence of HD. The spectra shown in Fig. 8 demonstrate the power in resolving a HD concentration to smaller than 1%. (In contrast to the spectra taken with D2 sample of 2% HD, the square-dotted spectrum of a high purity, converted D2 shows a reduced degree of HD contamination of 0.26%.)
Limited by the power of the laser, our Raman spectroscopy technique required the pressure of the sample gas to be higher than roughly half an atmosphere to perform para-D2 peak identifications in 40 minutes with our first implementations of the spectrometer. Subsequent improvement of the light collection and replacement of our laser dropped this time to roughly 10 minutes. The resolution of the para-D2 peak is limited by the background count rate (ideally the dark count rate of the photon counting device). The PMT has a nominal dark count rate of 5 Hz at room temperature, and with a para-D2 peak count rate of 10 Hz it gives a relative uncertainty of
| (6) |
of the para-D2 peak amplitude. A 30 second signal collection gives a measurement of the peak with a 10% relative uncertainty. For the case of highly converted samples, a photon count rate of 1000 Hz under the ortho peak would give an absolute uncertainty of 0.15% in the knowledge of ortho-D2 purity. Comparable count rates have been achieved with the setup described previously.
For spectra taken with the single grating spectrometer, we extracted the number of counts in each Raman peak by fitting the peak to a Gaussian function plus a constant background. Using this functional form for the spectral peaks permitted us to extract, in a consistent fashion, the area of HD peaks which sat on the wings of more intense D2 lines. For the small para-D2 peaks, these fits exhibited consistent with Poisson statistics, however, for the large ortho-D2 peaks, the uncertainties extracted from the fit were expanded to account for small discrepancies between the peak shape and our Gaussian model.
To check our fitting procedure, we compared our results to those obtained by fitting to a linear background region bracketing a Raman peak, and then simply subtracting this background from the peak area. The linear fits to the background were consistent with Poisson statistics, and the extracted ortho-to-para ratios were consistent with our nominal fitting procedure. We took this as an indication that our quoted ratio uncertainties were reasonable.
Note that the line extraction procedure was slightly different for the double-grating spectrometer, due to a small distortion in the line shape (later corrected by adding a baffle to the first stage of the double-grating spectrometer). We adopted a conservative approach of expanding the fitting window around the line and accepting a somewhat poorer peak-to-background ratio to extract these ratios. The uncertainties listed here are of 95% confidence level.
The extraction of the para-D2 fraction is based on the assumption of full conversion of the room temperature D2 reference sample. The fact that we use purified D2 flowing through a hot (400 ∘C) palladium purifier, which is a highly active ortho/para-D2 catalyst, gives us some confidence in this assumption. Note also that the ratios of the populations reproduce the expected thermal populations when the appropriate absolute Raman cross-sections for the different, measured Raman lines is utilized.

The precision of the para-D2 fraction is currently statistically limited by the signal to background ratio of the small para-D2 peak of the converted sample. It can be improved with a higher D2 gas pressure (perhaps using a compressor), a stronger laser source, or reducing the present dark count rates in our spectrometer’s PMT. Ultimately, systematic corrections due to relaxation, laser power fluctuations, temperature fluctuation, etc…, limit the precision of this technique.
The effect of relaxation in the sample cell was also investigated. As mentioned, this optical technique requires gas samples with pressures of several hundred Torr. During the conversion/fill stage, the line pressure of the converted D2 is kept under 50 Torr; without introducing another means of volume compression, our only technique for collecting gas samples of several hundred Torr is from the boil-off of the condensed D2 in the end of each run cycle when the cryostat is warmed up and the D2 is removed from the cryostat in the form of vapor. After these samples are collected, there was usually several hours of delay from the time of sample collection to the time of measurement. This delay raises the possibility of significant relaxation of ortho- into para-D2 in our room temperature optical sample cell, which has S.S. surfaces. Fig. 9 shows the observable relaxation over the course of 5 days. This corresponds to an increase of 0.3% of para-D2 concentration overnight. Relaxation of ortho-D2 introduces a correction within the measurement uncertainty for samples measured a few hours after the collection. When higher precision is required, a non-magnetic optical cell might be required.
In conclusion, we have demonstrated the technique of Raman spectroscopy to perform high precision measurements of the ortho-D2 purity to 0.15%, using a low power visible laser and a simple, single-grating spectrometer with an optimized light throughput. This provides us with the capability of cleanly determining the absolute para-D2 concentration, as well as the level of HD contamination in D2 sample obtained from our source. The fact that this technique requires almost no calibration makes it superior to a conventional scheme which we discuss below.
3.2 Thermal Conductivity Measurements – Hot Wire Method
The hot wire method is an application of the traditional scheme to measure the thermal conductivity of various gases[24]. It utilizes a thin metal wire as the heat source as well as the temperature sensor. The supplied energy heats up the wire, and the produced heat is conducted toward the cold walls through the surrounding medium (in our case, D2 gas). The rate of change as well as the ultimate temperature of the wire depends on the macroscopic thermal properties of the gas medium, and thus a measurement of the wire resistance (by measuring the voltage across the wire) is expected to be sensitive to the concentration of para-D2.
We built a system, similar to the design in Ref.[25, 26], of two cylindrical cells with a 1′′ I.D. and a 5.5′′ height out of one rectangular cubic block of OFHC copper. Constantan conductor feedthroughs in ceramic insulators were used for the electrical leads. Tungsten wires of 0.5 mm O.D. were used as the hot wires and were soldered to the Constantan leads. The wires run along the cylindrical axis of the cell and are slightly stretched by springs attached to the bottom of the cell. The whole assembly is immersed in a liquid N2 bath. The outer cylindrical surfaces are maintained at a constant temperature of 77K. The reference cell was filled with 30 mbar of 4He, and the other cell with 30 mbar of D2.

Our voltage data showed the expected behavior para-D2 fraction, where the scatter around the linear dependence sets the precision in the para-D2 fraction to be 2.6% (we view this as a preliminary figure, with substantial improvements possible with a more sophisticated design for the conductivity measurement apparatus[27, 28, 29]). A systematic effect was found that HD contamination changes the slope of the voltage data set. The effect of the HD presence on the voltage measurements is consistent with HD having slightly larger specific heat and viscosity than ortho-D2 at the temperature range of operation. Ultimately the HD concentration should be quite low in an UCN source operated in “production mode,” to limit UCN losses via nuclear absorption on H contamination, however, without an independent method of evaluating this contamination , it would appear that the hot wire cell technique would produce misleading results.
4 Discussions of the Converter Performance
With these tools to monitor the para-D2 concentration, we recorded the performance of the cryogenic converter containing a hydrous ferric oxide catalyst, over nine months of intermittent source operation. The catalyst was not regenerated until after the last of these source studies, a series of higher UCN flux runs, in which the UCN lifetime had shortened significantly.
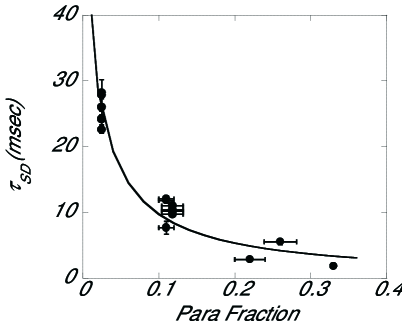
The best level of conversion gave a 1.4% 0.2% para-D2 concentration. These results were achieved with a converter temperature of 17K, an outlet pressure at the converter of around 35 mbar, and a flow rate of around 0.5 STP liters/min. The conversion efficiency of the catalyst reduced over time, with the 17K converter producing converted D2 gas with a para-D2 fraction growing from 1.5% to 11% over the period in which our UCN experiments were conducted. These measurements were performed to determine the UCN lifetime in solid deuterium. In Fig. 11, we present the measured UCN lifetimes as a function of the para-D2 fraction.[4] The extracted value for the lifetime in a pure para-D2 crystal is in excellent agreement with the theoretical expectations and provides substantiating evidence that our technique is effective.
Another point of contact between the function of the converter and our two para fraction measurement techniques can be made through tests conducted at the end of our measurement period. Although the efficiency of the converter had deteriorated, we investigated the converter performance by adjusting (via. the attached heater) the temperature of the converter cell and then measuring the resultant para- to ortho-D2 ratios immediately. Once again, we were able to produce para- to ortho-D2 ratios at the 1.5% level, although for these measurements the converter was held at 16 K and the flow rate was reduced.
The problem of catalyst aging has been well investigated in literatures.[16] Hydrous gels lose water and coalesce into granules over time. This change of structure from amorphous gel to micro-crystals is evident from X-ray scattering experiments[16]. The volume shrinks by over a factor of 500 due to this dehydration, and results in the reduction of the conversion efficiency. It is thus advisable to work with fresh gels, and not to attempt repeated regenerations. One way to prevent dehydration might involve refrigeration of the catalyst right after formation. Regeneration of the catalyst by heating it to 130∘C under atmosphere was reported to restore the catalytic performance[19], however, for the intermittent, brief use of the converter we envision for our source, one might as well replenish the converter with fresh catalyst when necessary. One potential concern regards the possible formation of HD while D2 gas passes through the hydrogen-rich catalyst via isotope exchange. This, however, was not experimentally observed probably because of the low operational temperature of the catalyst cell.
At present, the dependence of converter efficiency on its various operational parameters (temperature, pressure, flow rate, etc…) remain to be thoroughly investigated. At least two effects are worthy of note. We observed that the vapor pressure at the outlet of the converter was roughly a factor of ten smaller than one might expect for D2 in equilibrium with its saturated vapor pressure at the converter cell temperature (up to 30K). One would intuitively attribute this phenomenon to the large binding energy of the catalyst surface. We were able to flow adequate quantities of D2 through the cell by maintaining a pressure gradient of 50 to 80 mbar across the cell, but when the cell was operated at temperatures below 21K we occasionally experienced a gradual increase in the flow impedance, which may have been the result of forming solid D2 “plugs” due to the shift of the gas-solid phase transition curve. This plugging phenomenon may also be attributable to water contamination of our D2 gas. In fact we also observed that pre-purifying the deuterium gas through the palladium filter was essential in preventing the ice plugs from forming inside the para-to-ortho converter.
When scanning the temperature of our conversion cell across the triple point, we measured higher para fractions than were expected near the phase transition temperature. This phenomenon was observed in two separate scans through the triple point, with both the Raman spectroscopy and thermal conductivity cell measurements. These data appear to be consistent with the latent heat of a phase transition in the D2 providing the necessary energy to repopulate the J rotational state, but given the limited quantity of data we have on this phenomenon at present, we feel more work is required before a compelling conclusion can be drawn. In particular, these traces were obtained at the end of the 9 month operation period in which the converter material was not regenerated, when the performance of our converter was significantly impaired and may not represent typical operating conditions.
In conclusion, we have produced highly converted D2 with a residual para-D2 concentration of 1.5%. This is done with a 100 c.c. converter filled with hydrous ferric oxide operated at 17 K, with a flow rate of roughly 0.5 liter/min. We developed an apparatus to monitor para-D2 and HD contamination to a high precision at levels of 2 parts in 103 and 1 part in 103, respectively. Our study of the functionality of the converter leads us to believe that regular replacement with fresh catalyst or thorough regeneration will be required to ensure adequate para-to-ortho-D2 conversion and that a catalyst which does not largely reduce the D2 vapor pressure may help avoid complications associated with condensation.
References
- [1] A.P. Serebrov et al., J. Phys. Soc. Jpn. 65, Suppl. A, 259 (1996).
- [2] C.-Y. Liu, A.R. Young and S.K. Lamoreaux, Phys. Rev. B 62, R3581 (2000).
- [3] K. Kirch et al., CAARI Conference proceedings (2000).
- [4] C.L. Morris et al., Phys. Rev. Lett. in press.
- [5] A.R. Young and C.L. Morris, “A Measurement of the Neutron Beta-Asymmetry using Ultra-cold Neutrons” published in Fundamental Physics with Pulsed Neutron Beams (World Scientific, Singapore, 2001) p164.
- [6] R.E. Hill et al., Nucl. Instr. Meth. 440, No. 3, 674 (2000).
- [7] R. Golub and K. Boning, Z. Phys. B51, 95 (1983).
- [8] Z.-C. Yu, S.S. Malik and R. Golub, Z. Phys. B62, 137 (1986).
- [9] http://www.e18.physik.tu-muenchen.de/research/ucn/minid2/, U. Trinks, F.J. Hartmann, S. Paul, W. Schott: Nucl. Instr. Meth. A 440, 666 (2000)
- [10] http://ucn.web.psi.ch/,
- [11] I.F. Silvera, Rev. Mod. Phys. 52, No. 2, Part I, 393-452 (1980).
- [12] Jan Van Kranendonk, Solid Hydrogen, 1982.
- [13] A. Farkas, Orthohydrogen, Parahydrogen and heavy hydrogen (Cambridge University, Cambridge, England, 1935).
- [14] D.D. Eley, Advances in catalysis and related subjects (Academic Press Inc., New York, 1948), vol I, p174.
- [15] P.W. Selwood, Advances in catalysis and related subjects (Academic Press Inc., New York, 1951), vol III, p27.
- [16] H.B. Weiser, Inorganic colloid chemistry (John Wiley & sons, London, 1935), Vol II, The hydrous oxides and hydroxides.
- [17] R.A. Buyanov, Kinetika i Kataliz 1, No. 2, 306 (1960).
- [18] D.H. Weitzel and O.E. Park, Rev. Sci. Inst. 26, 57 (1955).
- [19] D.H. Weitzel, W.V. Loebenstein and J.W. Draper, J. Res. Nat. Bur. Stand. 60 (3), 221 (1958).
- [20] A.N. Bazhenov, V.I. Medvedev, and A.N. Pirozhkov, Pribory i Tekhnika Eksperimenta, No. 4, 63 (1992).
- [21] C.M. Penney, R.L. St. Peters, and M. Lapp, J. Opt. Soc. Amer., 64, No.5, 712 (1974).
- [22] W.R. Fenner, H.A. Haytt, J.M. Kellam, and S.P.S. Porto, J. Opt. Soc. Amer., 63, No.1, 73 (1973).
- [23] A. Compaan, A. Wagoner and A. Aydinli, Am. J. Phys. 62 (7), 639 (1994).
- [24] N.V. Tsederberg, Thermal Conductivity of gases and liquids (The M.I.T. Press, Cambridge, Massachusetts, 1965).
- [25] A.T. Stewart, et al., J. Sci. Instrum. 32, 26 (1955).
- [26] E.R. Grilly, Rev. Sci. Instrum. 24, 72 (1953).
- [27] M. Devoret, N.S. Sullivan, D. Esteve, and P. Deschamps, Rev. Sci. Instrum. 51 (9), 1220 (1980).
- [28] J.W. Haarman, Physica 52 605 (1971).
- [29] C.A. Nieto de Castro and W.A. Wakeham, Thermal Conductivity 15 (Plenum Press, New York, 1981), 235.