Large Deformation Effects in the N = Z
44Ti Compound Nucleus
††thanks: Presented at the 10th INTERNATIONAL CONFERENCE ON NUCLEAR REACTION
MECHANISMS Varenna, Italy, June 9-13, 2003.
Abstract
The N = Z 44Ti∗ nucleus has been populated in Fusion Evaporation process at very high excitation energies and angular momenta using two entrance channels with different mass-asymmetry. The deformation effects in the rapidly rotating nuclei have been investigated through the energy distribution of the -particle combined to statistical-model calculations. In the case of low-multiplicity events, the ratio between first particle emitted has been measured and shows significant disagreement with the predictions of the statistical-model. This may explain The large discrepancies observed in proton energy spectra measured in previous experiments performed in the same mass region.
25.70.Gh, 25.70.Jj, 25.70.Mn, 24.60.Dr
1 Introduction
Signatures of deformation effects in hot rotating nuclei, produced in the Fusion Evaporation (FE) process, have been searched for in several experiments [1-6] using LCP emission. The level density in nuclei increases exponentially with excitation energy and at a few tens of MeV above the yrast line a continuum regime is reached. Consequently, LCP energy spectra have typical Maxwellian shapes resulting from the combined effects of the Coulomb barrier and level density. These spectra can be described in the framework of the statistical-model which in the present work has been exploited through CACARIZO, the Monte Carlo version of CASCADE [7].
Up to now the main difficulty encountered in such a description has been the lack of knowledge of the sequence in which the particles are emitted. Indeed, depending on its excitation energy, the Compound Nucleus (CN) is able to evaporate several light particles which compose the decay chain but their order can generally not be determined experimentally. At each step of the decay a neutron, a proton or an -particle can be emitted depending on properties peculiar to each intermediate residual nuclei. There are thus a large number of decay paths which connect the CN to the final Evaporation Residues (ER).
The in-plane LCP have been measured in coincidence with ER, and the data presented in this paper have been obtained with the multidetector array ICARE at the VIVITRON tandem facility of the IReS (Strasbourg). The reactions 16O on 28Si at Elab = 76, 96 and 112 MeV and 32S on 12C at Elab = 180 and 225 MeV bombarding energies have been used to populate the 44Ti CN at three different excitation energies between E∗ = 60 and 82 MeV.
2 Physics case
In reference [8] the shape evolution of hot rotating nuclei has been calculated using a generalized liquid drop model and a two center shell model to describe the CN entrance channel. Concerning the 44Ti CN,
these calculations show that minima in the potential energy exist not only at low excitation energy but also at higher energies in a region of dynamical deformation and angular momenta L close to the critical angular momentum (Lcr) above which fission occurs.
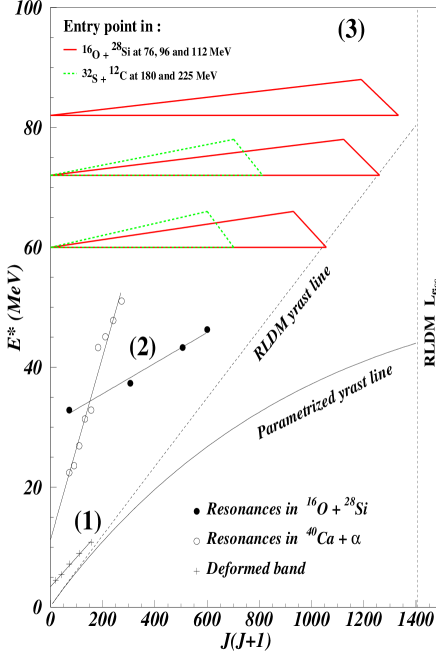
The -like nucleus 44Ti lies close to the doubly magic 40Ca nucleus in a region where spherical and deformed states coexist. In Fig. 1, the deformation occurence in 44Ti is displayed through the existence of rotational bands of different origins. In this mass region, Superdeformation at relatively low spin (J 20) has been found in 36Ar [9] and 40Ca [10] for spins up to J = 16+). For 44Ti (region (1) of Fig. 1), a deformed band has been observed up to J = 12+ [13]. At higher excitation energies (E∗ 20 MeV), the existence of the so-called quasi-molecular resonances is well known for -like from 24Mg to 56Ni and has been observed essentially in elastic and inelastic scattering reactions leading to these nuclei as composite systems. In region (2) of Fig. 1, the alignement of E∗ versus J(J+1) is interpreted as rotational bands of nuclear molecules 40Ca + and 16O + 28Si, the deformation being larger for the more mass-symetric systems. These resonances are located well above 44Ti yrast line and are observed up to L = 24 . At even higher excitation energies and angular momenta corresponding to region (3) of Fig. 1, there is a possibility to observe the Jacobi transitions. Indeed, for the neighbouring nucleus 46Ti, measurements of the Giant-Dipole-Resonance (GDR) indicate the transition (as a function of decreasing L) of the dynamical deformation from prolate to triaxial and to oblate shape [14]. This transition region is expected in the angular momentum range L = 26 to 30 . In region (3) previous measurements from LCP spectroscopy have been performed to study the dynamical deformation in various nuclei like 40Ca [5, 6], 56Ni [6, 15], 59Cu [3, 4]. The main parameters governing the decomposition of the excited CN are Lcr (deduced from the complete fusion cross section using the sharp cut-off model), the CN excitation energy and the yrast line position which defines the level density. The study of deformation effects is essentially based on the comparison between the measured and calculated -particle spectra which are the most sensitive to deformation. Other observables like angular correlations, mass distribution or proton energy spectra allow us to test the consistency of the calculations.
2.1 Deformation effects in LCP emission
If the yrast line of these hot rotating nuclei is calculated with the Rotating Liquid Drop Model (RLDM), the -particle differential cross section is systematically overestimated in the high-energy part of the spectra. This energy ”shift” has been interpreted as arising from the yrast line lowering due to the change of the CN moment of inertia in the region of high angular momenta [1]. The yrast line position, i.e. the effective moment of inertia, is thus adjusted in order to reproduce the -particle energy spectra. The CN is considered as a rigid sphere at L = 0 and as an elongated ellipsoid with a maximum axis ratio value at L = Lcr. The adopted yrast lines are represented in Fig. 1: the yrast line from RLDM and the parametrized one as calculated with the two adjustable parameters 1 and 2 (see [6, 15] for more details) obtained from a study of the 16O on 28Si fusion reaction [17]. The proton energy distributions are only slightly sensitive to deformation as the proton takes away from the CN or intermediate residual much less energy and angular momentum than the -particle.
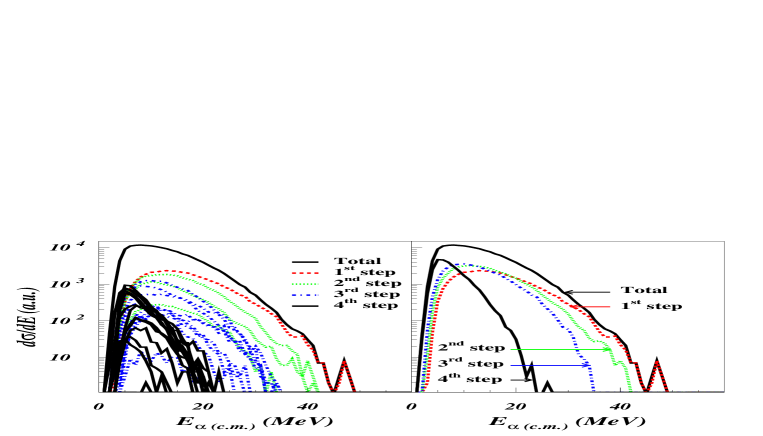
The first chance -particle spectrum corresponds to the decay of 44Ti∗ to 40Ca∗. Then, the -particle at the second step can be emitted from the three nuclei: 40Ca∗, 43Sc∗ and 43Ti∗. The second step spectrum in Fig. 2 (right side) is thus the cumulative spectrum of the three possible decay channels and the nth step is the sum of 3n-1 possible contributions. It has previously been shown [17] that the high-energy part of the LCP energy spectra is determined by the first emitted particle. This is shown in the calculated -particle energy spectra represented in Fig. 2. On both parts of the Fig. 1, the upper full line is the cumulative spectra which is the sum of all contributions. Fig. 2 shows that the tail (high-energy part) of the first step -particle represents almost the total spectrum which justify to fit the experimental data by varying the deformation parameters. This is not the case in the vicinity of the Coulomb barrier which results from a large number of contributions. In this region, not only the spectrum shape but also the branching ratio of the different contributions has to be reproduced. From Fig. 2 it appears that for evaporation chains with a small number of emitted particles contributions to the cumulative spectra are limited. A comparaison between experimental and calculated energy spectra is then possible over the total energy range. It is also possible to select chains with different kinetic energy distributions from the ELCP-EER bidimensional spectra which will be discussed in a forthcoming section. It is also worthwhile to note that the observed branching ratios are in disagreement with the statistical-model calculations.
3 Experimental techniques and chosen reactions
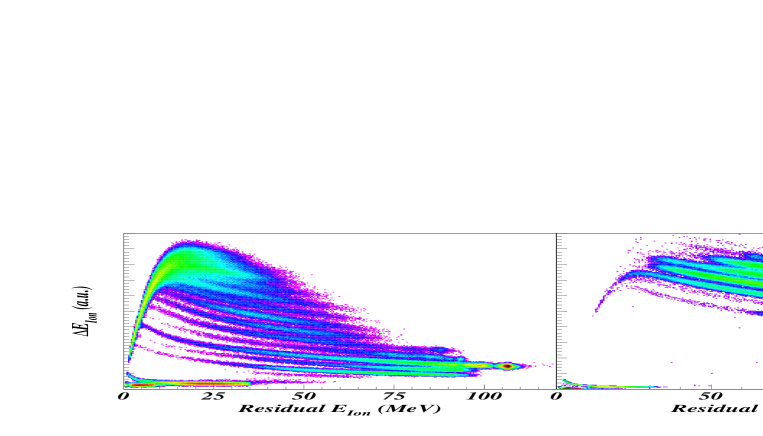
The experiments were carried out using the multidetector array ICARE [6] which is a combination of Heavy Ion (HI) and LCP detectors. The HI and LCP identifications, energy and angular distributions required for these measurements have been achieved with various telescopes composed of Si(SB) detectors, CsI(Tl) scintillators and Ionization Chambers (IC). The IC (E from the gas cell and E from 500 m Si(SB)) were placed at forward angles to detect ER from lab = -10∘ to -30∘ with an angular opening of = 3∘. The HI identification has been obtained with the E-E technique using a 4.8 cm length gas cell filled with isobutane at pressure of 15 and 80 Torr for the direct kinematic reaction 16O on 28Si and inverse kinematic reaction 32S on 12C, respectively. Fig. 3 displays the E-E HI spectra obtained in both reactions: for the 16O on 28Si reaction (left), a threshold energy of 20 MeV for ER has to be taken into account in the analysis. For the 32S on 12C reaction (right) ER are resolved up to Z = 20 without significant detection thresholds. The LCP double telescopes (40 m Si(SB) + 2cm CsI(Tl)) with a = 7.5∘ angular opening were placed at angles from 35∘ to 130∘ to cover the LCP distribution for the 16O on 28Si reaction. For the 32S on 12C reaction, triple telescopes (40 m Si(SB) + 300 m Si(SB) + 2cm CsI(Tl)) were placed at very forward angles (lab = 30∘ to 40∘), in order to detect with good accuracy the high-energy protons. For angles larger than 45∘, double telescopes were used to detect LCP with an angular opening of = 4∘. In both experiments, the LCP and HI detectors are placed with angular intervals of = 5∘. The LCP discrimination was achieved using both E-E and time-of-flight techniques allowing energy thresholds to be lower than 100 keV.
The 16O on 28Si reaction has been chosen to populate the 44Ti CN at the highest angular momenta. The adopted bombarding energies of Elab = 76, 96 and 112 MeV correspond to Lcr = 31, 34 and 35 and E∗ = 60, 72 and 82 MeV, respectively. These values are close to the limit of Lfiss predicted by the RLDM. In the 32S on 12C reaction, the CN 44Ti was populated at E∗ = 60 and 72 MeV, the same excitation energies than for the 16O on 28Si reaction but with much lower Lcr values (25 and 27 ) due to the bigger mass-asymmetry of the entrance channel. Fusion cross sections are reported in the literature at similar CN excitation energy, populated with the same reactions [18, 19], which allow us to extract experimental Lcr values using the sharp cut-off model.
4 Results
4.1 proton spectral shapes
Despite the fact that proton energy distributions were well reproduced by the statistical model in previous investigations [15], they are completely in disagreement for both reactions. A number of possible reasons were suggested invoking alternate reaction mechanisms as preequilibrium or secondary particles emitted from the projectile-like or the target-like nuclei. But these hypothesis are not justified as the ER and their associated LCP detected in coincidence are consistent with FE process.
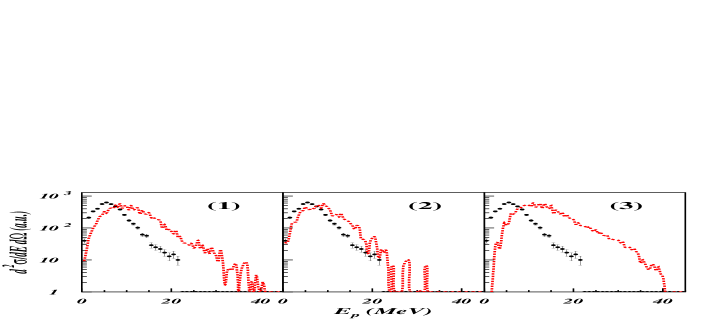
It is crucial to know the origin of the observed proton as their energy spectra are strongly dependent on the available energy of the emitter. As shown in reference [16], where proton energy have been measured in coincidence with discrete transitions, large shifts in proton energy spectra in the decay of 86Zr∗ CN was interpreted as near-yrast stretched proton emission. In order to investigate the effect of the branching ratios, the calculations have been carried out with conditions on the cascades. In Fig. 4, the experimental proton energy spectrum (full line), measured at lab = 60∘ in coincidence with Z = 19 ER detected at lab = -10∘, is compared with the calculations (dashed lines). In these events only two charge units are not detected: one -particle in the 1p1xn channels or two protons in the 3pxn channels. In the calculated spectrum (1) there is no restrictions which shows the disagreement observed in every experiments and, in a worst case, spectrum (3) is a calculation restricted to a proton emitted at the first step of the cascade. Indeed, the slope of the experimental proton energy spectra indicates a lower temperature of the emitter as compared with the predictions. Then, spectrum (2) is calculated considering the cascades starting with the emission of one -particle, thus, the remaining 40Ca∗ evaporates a light particle with a lower nuclear temperature. The disagreement is still remaining in (2) but blocking the first proton particle emission gives a better agreement especially in the high-energy slope. To go ahead, the following steps of the cascades have to be better studied to reproduce the complete spectra, particularly in the Coulomb barrier region.
4.2 -particle spectral shapes
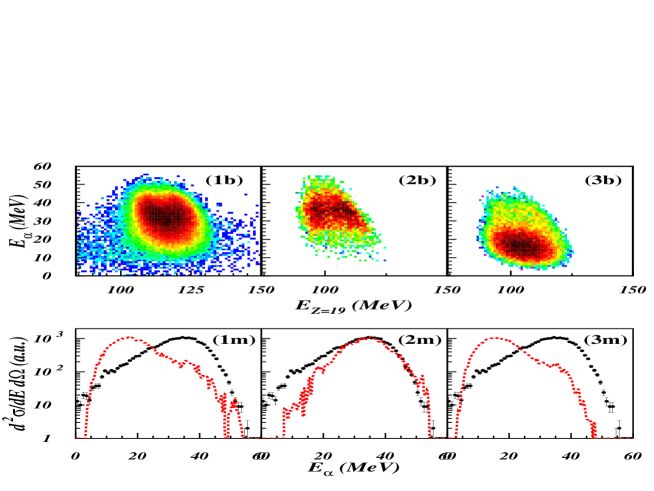
In the 16O on 28Si reaction the fitting of the -particle energy spectra indicates strong deformation effects with an axis ratio of 2:1 consistent with the Superdeformation in the CN at Lcr [17]. In the 32S on 12C experiment at 180 MeV, the same 1 and 2 deformability parameters extracted from the latter measurement, have been used to perform the calculations displayed in Fig. 5. The disagreement in the -particle energy spectrum (1m) is connected to the reason invoked in the previous paragraph. The Z = 19 ER, considered for proton in Fig. 4, is measured in coincidence with an -particle in the Eα-EZ=19 bidimensional spectrum (1b) where 1pxn are missing in the measurement. This spectrum can be splitted in the calculated ones (2b) and (3b). The former is the contribution of the particular p cascade corresponding to the upper part of the Eα-EZ=19 experimental distribution and, on the corresponding projections (2m), the bump centered at Elab = 35 MeV is well reproduced. The difference between data and calculations, in the low-energy part of (2m), corresponds to the cascades starting with a proton represented in spectra (3m) and (3b). The latter contribution represents few percent of the total which is much weaker than the predicted ratio in (1m). This point demonstrates that the de-excitation through the -particle emission is favoured against proton evaporation.
In the 32S on 12C experiment the single particle emission has been measured in the FE process displayed on the Fig. 6. The structures visible in the experimental data seem to arise from a direct process as previously evidenced in the 12C(28Si,32S)8Be -particle transfer reaction [6]. In the experimental bidimensional Eα-EZ=20 spectra (second column), the narrow peak represents the -particle detected in coincidence with the 40Ca. This evaporation channel is well reproduced by the statistical-model calculations (first column). The wider component with -particle energy distribution below the one- region corresponds to the 1xn decay channels. It is interesting to note the large excess of the neutron evaporation yield predicted in the calculations. As shown in Table 1 the neutron emission leading to Z = 20 ER is overestimated with a factor of 5 in comparison with the experimental values.
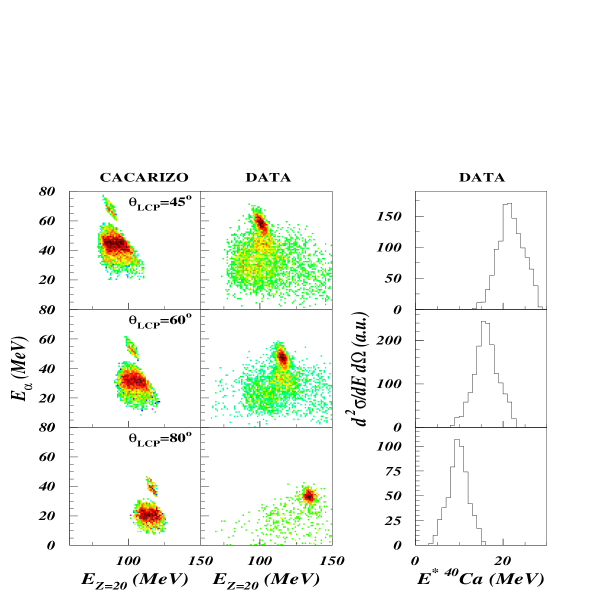
The comparison of the ratio between 1 and 2pxn cascades reported in Table 1 show the underestimation of -particle emission in the standart calculation with more than one order of magnitude. The two-body kinematics, by means of α-Z=20 angle combination, imposes the excitation energy in the remaining 40Ca∗, shown in the last column of the Fig. 6, deduced from the kinetic energies measured at the indicated angles. At the most forward angle, the detection of the bound 40Ca indicates that it is populated at excitation energies in the region of the highest Superdeformed bands transitions measured in [10]. The energy spread is due to the angular opening of the detectors as the -particle energy and excitation energy in 40Ca∗ have a strong angular dependence. However, the centroids give the mean energies at the considered angles and the resolution is as well reproduced in the calculations.
| Detection angle | measured 1/2pxn | calculated 1/2pxn | ratio |
| 45∘ | 4.7 | 0.22 | 21.2 |
| 60∘ | 4.1 | 0.16 | 25.6 |
| 80∘ | 3.9 | 0.38 | 10.2 |
| Detection angle | measured 1/1xn | calculated 1/1xn | ratio |
| 45∘ | 0.27 | 0.057 | 4.7 |
| 60∘ | 0.40 | 0.059 | 6.8 |
| 80∘ | 0.61 | 0.170 | 3.6 |
5 Conclusions
According to the high energy slopes of the -particle spectra, measured in the 16O on 28Si reaction, the temperature in the emitters is well reproduced. Thus, the discrepancies in the proton energy spectra have been understood as a misinterpretation in the branching ratio in particle emission from highly excited CN. Indeed, the experimental results compared with calculations give an indication concerning the possible order of the emitted particles and indicate that the -particles are more favourably emitted at the beginning of the de-excitation chain. Consequently, the ratio between particles emitted at each step of the cascade should be considered more precisely to go further in the analysis of LCP energy spectra. In this paper the study of low-multiplicity events allows the complete measurements of the reaction. Concerning the one- evaporation channel, the kinematic measurement gives the opportunity to select particular excitation energy regions in the residual nuclei. For the search for Superdeformed or Hyperdeformed bands -ray spectroscopy combined with particle detection offer the possibility to select highly excited bound states in the studied nuclei such as the N = Z doubly magic nucleus 40Ca.
Acknowlegements:
The authors wish to thank the staff of the VIVITRON for providing us with good 16O and 32S stable beams, M.A. Saettel for preparing the targets, and J. Devin and C. Fuchs for the excellent support in carrying out these experiments. We wish also to thank N. Rowley for valuable discussions during the progress of this invetigations.
References
- [1] R.K.Choudhury et al., Phys. Lett. 143B, 74 (1984).
- [2] D.K. Agnihotri et al., Phys. Lett. 307B, 283 (1993).
- [3] G. Viesti et al., Phys. Rev. C 38, 2640 (1988).
- [4] J. R. Huizenga et al., Phys. Rev. C 40, 668 (1989).
- [5] B. Fornal et al., Phys. Rev. C 44, 2588 (1991).
- [6] M. Rousseau et al., Phys. Rev. C 66, 034612 (2002).
- [7] F. Pühlhofer, Nuc. Phys. A280, 267 (1977).
- [8] G. Royer et al., Phys. Rev. C 67, 034315 (2003).
- [9] C.E. Svensson et al., Phys. Rev. Lett. 85, 2693 (2000).
- [10] E. Ideguchi et al., Phys. Rev. Lett. 87 222501 (2001).
- [11] J. Barrette et al., Phys. Rev. Lett. 40, 445 (1978).
- [12] Th. Delbar et al., Phys. Rev. C 18, 1237 (1978).
- [13] C.D. O’Leary et al., Phys. Rev. C 61 064314 (2000).
- [14] A. Maj et al., Eur. Phys. J. A (2003) in print and references therein nucl-ex/0302004.
- [15] C. Bhattacharya et al., Phys. Rev. C 65, 014611 (2002).
- [16] D.G. Sarantites et al., Phys. Rev. Lett. 64, 2129 (1990).
- [17] P. Papka et al., Acta Phys. Pol. 34B, 2343 (2003).
- [18] R.A. Zingarelli et al., Phys.Rev. C 48, 651 (1993).
- [19] S. Pirrone et al., Phys. Rev. C 64, 024610 (2001) and references therein.