E895 Collaboration
Charged Pion Production in 2 to 8 AGeV Central Au+Au Collisions
Abstract
Momentum spectra of charged pions over nearly full rapidity coverage from target to beam rapidity have been extracted from 0-5% most central Au+Au collisions in the beam energy range from 2 to 8 AGeV by the E895 Experiment. Using a thermal parameterization to fit the transverse mass spectra, rapidity density distributions are extracted. The observed spectra are compared with predictions from the RQMD v2.3 cascade model and also to a thermal model including longitudinal flow. The total 4 yields of the charged pions are used to infer an initial state entropy produced in the collisions.
pacs:
25.75.-q, 25.60.GcI Introduction
One of the primary goals of the study of heavy ion collisions at relativistic energies is the improvement of our understanding of the bulk properties of nuclear/hadronic matter at high temperatures and densities. As a first step in understanding these properties, one should carefully characterize the particle species that make up the bulk of the matter. For the energy regime of the Bevalac/SIS (0.2 to 1.2 AGeV), collisions between heavy nuclei cause a compression of the nuclear matter, resulting in a disassembly into the constituent neutrons and protons, which are emitted either individually or bound within various light composite fragments (d, t, 3He, 4He)Lisa95 ; Herr96 .
At the top energy of AGS Au+Au collisions of 10.8 AGeV, the most copiously produced charged particles are the lightest of the mesons, the pionsAhle98 ; Barr00 . The matter has evolved from a heated and compressed gas of nucleons into a hot dense gas of hadrons, predominantly pi mesons. Thus the energy region from 2 to 8 AGeV represents a transition regime. Studies of nuclear stopping suggest the maximum density achieved increases from three times normal nuclear density at 1 AGeVStocker86 ; Bert88 ; Wang91 to eight times normal nuclear density at 10 AGeVLiKo95 . Measurements of the proton directed and elliptic flow indicate that hydrodynamic flow has saturated across this energy range and cannot account for the increased energy availablePink99 ; Liu00 . This additional available energy goes primarily into pion production. By studying the pion production across this regime we are able to observe nuclear matter in transition.
Early on in the study of heavy ion collisions, an enhanced yield of pions was seen as a possible signature of a transition to a deconfined state of matter. However, in the early studies of pion yields in the 1 AGeV energy range at the BevalacNaga81 ; Strob83 ; Stoc86 , it was observed that the measured pion production cross sections were smaller than predicted at the time. This observation led to the conjecture, which was later experimentally demonstrated, that the excess kinetic energy was converted into hydrodynamical flow effects. The strong radial flow observed at this energy implies a significant expansion and cooling, which limits the freeze-out pion multiplicitiesDani95 ; Stocker84 . More recently, more detailed mesurements of the pion yields from 1 AGeV Au+Au collisions have become available from the SIS experimentsPelt97 ; Wagn98 ; Vene93 ; Schwalb94 . These results demonstrate a roughly two to one ratio of over and a strong non-thermal low-pt enhancement. Both features are strong indicators that pions at this energy are produced almost exclusively through the Delta resonanceSorge94 . In full energy AGS collisions (Au+Au at 10.8 AgeV), pion production has been studied at midrapidityAhle98 and at target rapidityBarr95 . Although there is still an asymmetry between and production and there is also still evidence of a low-pt enhancement in the momentum spectra, these effects are much less significant than at SIS. The broad rapidity coverage for both pions and protons at these energies has also been used to study the development of longitudinal flowStac96 .
This paper will detail the development of pion production across the beam energy range from 2 to 8 AGeV. The role of the Delta resonance production mechanism will be explored through observations of the overall pion ratios and through RQMD simulations. The rapidity density distributions will be used with previously published proton rapidity distributionsKlay02 to explore the effects of collective longitudinal flow. The overall pion multiplicities will be used to establish a low energy baseline for a recent pion multiplicity based QGP search at the CERN SPSNA4902 .
II Data Collection and Analysis
The data were taken at the Brookhaven National Laboratory Alternating Gradient Synchrotron (AGS) by the E895 Experiment using the EOS TPC EOSTPC during a series of runs in 1996. This article presents charged pion transverse mass and rapidity density spectra from Au+Au collisions at nominal beam energies of 2, 4, 6, and 8 GeV/nucleon (AGeV). (After correcting for energy loss before the target, the actual beam energies of collisions at 2 and 4 AGeV were found to be 1.85 and 3.91 AGeV, respectively. No corrections were necessary for 6 and 8 AGeV.) The EOS TPC provides nearly 4 solid angle coverage, which makes global characterization of the collision events possible. Charged particle momenta are reconstructed from the helical trajectories of tracks reconstructed from the ionization trails left by particles passing through the TPC, which was situated inside the Multi-Particle Spectrometer (MPS) magnet. Data presented for 2 AGeV collisions were taken in a 0.75 Tesla field, while 4, 6, and 8 AGeV collisions were taken in a 1 Tesla field.
A primary track multiplicity for each event is obtained by rejecting those tracks which do not pass within 2.5 cm of the reconstructed event vertex in the target. The multiplicity distribution from a minimum trigger-biased sample of events is used to discriminate event centrality classes by assuming a monotonic relationship between the impact parameter and multiplicity Cava90 . The data presented in this paper are selected on the top 5% most central events; an ensemble of approximately 20,000 events at each energy for this centrality selection were used to obtain the spectra.
Identification of particle species is determined via multiple sampling (up to 128 samples) of the ionization in P10 (10% methane, 90% argon) drift gas. The average ionization energy loss, , is computed for each track from the available samples via a truncated mean to reduce the influence of the large energy tail of the distribution. The 20% highest samples are discarded from the calculation of the average.
Fig. 1 shows a typical particle identification map with plotted versus reconstructed track rigidity (= p/Z) at 6 AGeV. The various particle species are identified by their separation into bands. The pion spectra were obtained by fitting projections of the in narrow bins of and rapidity, using an assumption of the pion mass and charge to calculate the (,y) coordinates for a given measured particle (,,).
The single particle projections are often described by a Gaussian distribution centered on the mean value predicted by a Bethe-Bloch formulation. However, this assumes that the calculation of for each track was obtained in an identical fashion for all tracks in the distribution. In fact, the truncated mean method used in this analysis introduces a skewing toward larger which comes from combining tracks of different number of samples, Nhits. One way to avoid this skewing is to divide the data into bins of Nhits, which reduces the effect. However the reduction in statistics for each bin leads to increased uncertainty in the determined yields. Therefore, for this analysis, a model of the Nhits-integrated single particle distribution shapes was used with the predicted mean values from a Bethe-Bloch parameterization of the as a function of to extract the total yields of pions from each projection. The model is represented by a correlated sum of Gaussian distributions: a main Gaussian for the bulk of the distribution plus a smaller, offset “shoulder” Gaussian for the high- tail. The parameters of the model were studied as a function of beam energy, particle type and (,y) bin in regions where the single particle distributions can be separately characterized. Tight constraints on the model parameters were applied in order to extrapolate the model into regions where multiple particle distributions partially overlap. Thus the relative yields of different particles were deconvoluted in each (,y) bin: 0.1 unit rapidity slices over the full rapidity range from target to beam rapidity, with the midrapidity bin covering the range -0.05 ycm 0.05, and in 25 MeV/c2 bins in mt-m0 in the range 0 mt-m0 1.0 GeV/c2. Particles of the wrong mass and/or charge contaminating the pion sample in a given (,y) bin were discarded.

Fig. 2 shows an example of a single (,y) slice at midrapidity for 6 AGeV and GeV/c2. The total yields are obtained by integrating the area under the fitted distributions for each particle. Oppositely charged particles are projected separately. The inset shows the projection of negatively charged particles, which are well-characterized by this method of particle identification over the entire range of transverse mass and rapidity. However, as the rapidity and transverse mass increase, the positively charged pions suffer increasing contamination due to the overlap with the positive kaons and protons. The range of and rapidity over which the yields are extracted is therefore more limited.

Electron contamination was estimated by studying their yields in the regions of phase space where they are relatively cleanly identified (for plab 150 MeV/c and 300 plab 500 MeV/c) and interpolating between these limits. It was found that electrons contribute approximately 10% to the observed yield of pions for lab momenta 150 plab 250 MeV/c. Since the electron yields fall significantly as a function of their own transverse momentum, the contamination predominantly effects the lowest pion bins. The errors on the quoted pion yields account for possible systematic uncertainties in the determination of the electron contamination.
Observed kaon yields from the same beam energy range, measured by E866/E917 Ogil98 ; Dunl99 , folded with the EOS TPC detector response allows us to extend the reach of the fitting out to plab 1.2 GeV/c. For lab momenta above 1.2 GeV/c, however, the become hopelessly entangled with the protons, which are approaching minimum ionizing . This cut-off manifests at different , depending on the rapidity and bombarding energy.
Detector response to the final-state collision products has been extensively studied using the GEANT 3.21 simulation package. Small (maximum of 4 per event) samples of pions with momentum distributions approximating the real data are embedded into full data events. These particles are tagged and propagated through the data reconstruction chain to determine the effects of detector acceptance, tracking efficiency, and momentum resolution.
Since the beam actually passes through the sensitive volume of the detector, there is no explicit low-pt measurement cut-off. However, forward-focusing causes increased tracking losses at low pt and forward rapidities due to higher track densities and track merging. Losses at backward rapidities and high are dominated by the geometric acceptance of the detector, while at more forward rapidities, the high tracks are stiffer and therefore suffer from worsening momentum resolution. Fig. 3 shows the overall detection efficiency obtained from simulations as a function of and rapidity for pions at each beam energy. The contours indicate steps of 15%. The raw data are corrected for these effects to extract the total yields of positive and negative pions as a function of and rapidity at each beam energy.
Due to the large acceptance of our device, we can test the systematic uncertainties on the yields by comparing forward and backward rapidity corrected spectra. Overlapping acceptances at 2, 4, 6 and 8 GeV allow us to conclude that rapidity bins corresponding to 0.5 are most affected by the systematic uncertainties in our corrections. The underestimated corrections in this region of phase space are not surprising given that neither detector performance nor detector simulations were optimized for target rapidity in the lab frame. Here tracks cross the fewest pad rows and have the smallest radii of curvature. Mid-rapidity yields at all four beam energies were checked against published results from E866/E917Seto98 ; Ahle00 . The average level of agreement between our spectra and E866/E917 over all and beam energies is observed to be approximately 7%. The minimum systematic uncertainties at all rapidities for the E895 data presented here are estimated to be 5%, while for the most backward rapidity bins, the uncertainties at high can become as large as 50%. These errors are included on the spectra reported in this article.

III Results
Figs. 4 and 5 show the fully corrected, invariant yields of charged pions per event from 0-5% central Au+Au collisions at 2,4,6 and 8 AGeV. Mid-rapidity is shown unscaled as black circles, while each bin forward/backward of mid-rapidity is scaled down by a successive factor of 10. Forward rapidities are indicated as open circles and backward rapidities as open triangles. The reported error bars include both statistical and systematic uncertainties.


The approximately exponential decay of the particle yields as a function of transverse mass has been observed in high energy particle and heavy ion experiments over a wide range of conditions. In order to extract the full 4 yields of pions (including those from resonance feed-down) produced in the beam energy range studied here, a simple parameterization of the pion spectra which reproduces the observed shapes of the spectra over the full range of , from 0 to 1 GeV/c2 is used. This parameterization is the sum of two independent Maxwell-Boltzmann thermal functions, each term of which can be expressed in terms of the measured coordinates, (,y), integrated over azimuth as
| (1) |
where the amplitude A and inverse slope parameter, Teff are parameters which can be extracted from fits to the data at each rapidity slice. Integration of either of these two distributions over mt produces its contribution to the total number of particles per unit of rapidity in the given rapidity sliceSchn93 .
| (2) |
Note that A(y) in Eq. (1) can be re-written in terms of dN/dy(y), using Eq. (2).
The low-pt enhancement observed in the pion yields has been attributed to feed-down from late-stage resonance decays Soll90 ; Hofm95 ; Wein98 , which tend to populate lower pion pt in the frame of the collision due to the nature of the decay kinematics. In particular, at the beam energies presented here, the delta resonances, (such as the ) are the predominant mechanism for pion production, due to the very large cross-section for pion-nucleon interactions. The observed asymmetry in the spectral shapes of positive and negative pions at low has been described elsewhere by a final-state Coulomb interaction of the pions with the nuclear fireball Gyul81 ; Barz98 ; Ayal99 ; Cebr02b .
The two-slope model which has been applied to the pion spectra was chosen to provide the simplest phenomenological description of the data. Since this parameterization does reasonably well at describing the observed shapes of the spectra over all , it is used to extract the 4 yields of pions in these collisions with minimal extrapolation.
| (3) |
The four parameter fit includes two independently fit inverse slope parameters (T1(y), T2(y)), and two independently fit yield parameters (dN/dy1(y), dN/dy2(y)), which reasonably describe the low-() and high-() portions of the spectrum at each rapidity. These fits are shown as solid lines in Figs. 4 and 5. The data at more forward rapidities, where in particular the spectra are limited to the range 200 MeV/c, are not included in the two-slope parameterization fits.
More detailed examples of these two-slope fits at mid-rapidity are shown in Fig. 6. Figs. 7-10 show the four fit parameters as a function of rapidity from the spectra and the resulting total dN/dy. The parameters plotted in the top row are from fits in which all four parameters are allowed to be free. All of them show an approximately Gaussian dependence on rapidity, which is demonstrated by the solid line in each panel. The bottom row of each figure demonstrates the result of a second fit of the spectra in which the high-() inverse slope parameter is constrained to the Gaussian (solid line) value. This procedure smooths out the covariance between the individual yield parameters but has a negligible effect on total dN/dy (rightmost panel).
If the source of pions were a static thermal source of temperature T0 and zero chemical potential, the expected shape of Teff in Figs. 7-11 would be T. (Of course, there would then be needed only a single term in Eq. (3).) We have shown in Ref. Klay02 that there is significant longitudinal flow - i.e., the source is not static. As the main purpose of the fits in Figs. 4 and 5 is for integration of the (,y) spectra to obtain 4 yields, a Gaussian fit of the inverse slope parameters in Figs. 7-11, rather than 1/, was used.
Fig. 11 shows the fit parameters at each beam energy. The limited range in of the spectra is caused by the overlap with the protons, which makes it impossible to get good spectral data at all rapidity slices. In order to make reasonable estimates of the 4 positive pion yields, the high-() positive pion inverse slope parameters were assumed to be the same as those of the negative pionsPelt97 . In the estimation of the dN/dy, the high-() inverse slopes were therefore fixed to the negative pion values. Experimentally, the negative pion inverse slope parameters do reasonably reproduce the observed high-() positive pion inverse slopes in the rapidity regions where they can be measured. Where the spectra are severely truncated, the positive pion yields were obtained from single-slope fits. The reported systematic uncertainties in these rapidity slices are correspondingly larger to account for this missed yield.


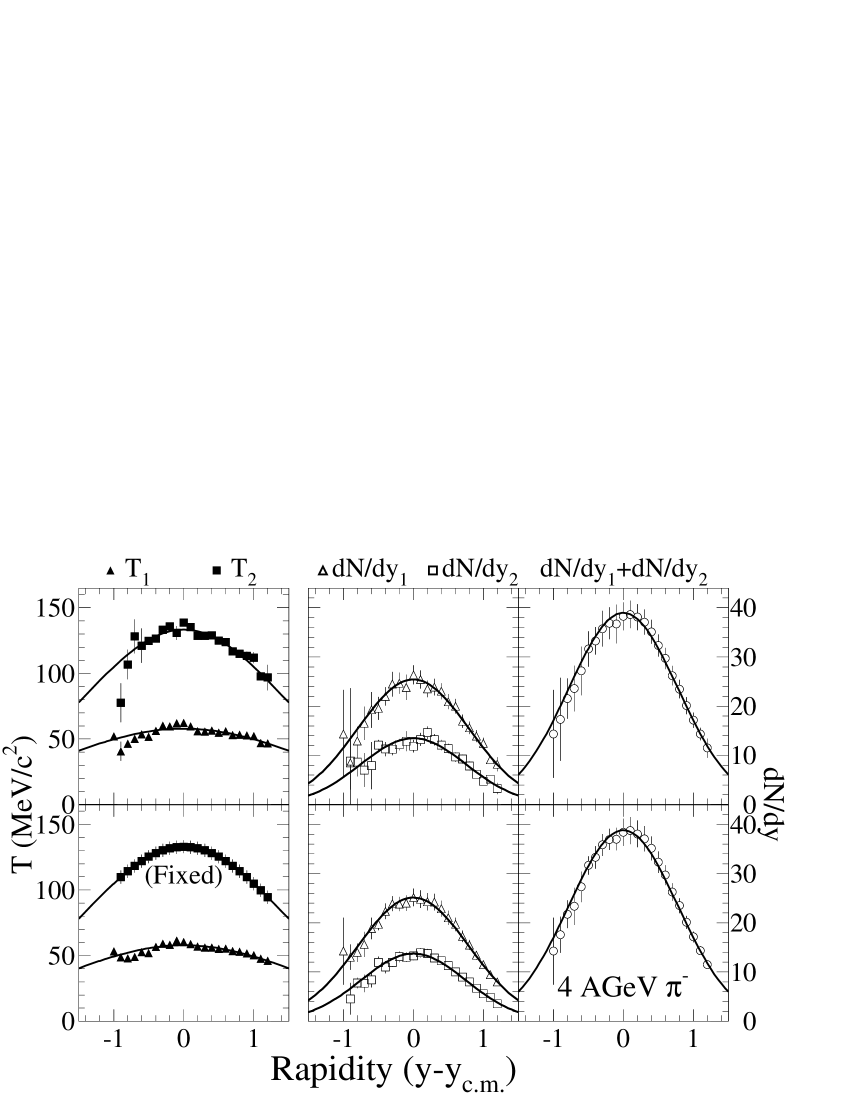


Fig. 12 shows the beam energy dependence of the rapidity distributions of negative and positive pions extracted from the fits. These distributions are well-described by Gaussians, which are used to obtain the total 4 yields by integrating the fitted distributions over all rapidity.
| (4) |
where Q is the value of dN/dy at y-yCM = 0 and w is the width. The fit parameters and their uncertainties are listed in Tables 1 and 2. Both the widths and the overall yields of pions increase as a function of beam energy. However, there is a more significant increase in the observed pion yields between 2 and 4 AGeV than between 4 and 6 AGeV or 6 and 8 AGeV.
| Ebeam | Q | w | |
|---|---|---|---|
| 2 AGeV | 21.3 0.1 1.3 | 36.1 0.3 2.0 | 0.675 0.006 0.005 |
| 4 AGeV | 39.0 0.1 2.1 | 76.0 0.2 4.2 | 0.780 0.003 0.002 |
| 6 AGeV | 50.8 0.1 2.7 | 104.0 0.2 5.4 | 0.817 0.002 0.001 |
| 8 AGeV | 61.1 0.1 3.3 | 130.7 0.4 7.9 | 0.854 0.003 0.008 |
| Ebeam | Q | w | |
|---|---|---|---|
| 2 AGeV | 11.5 0.3 1.2 | 19.2 1.3 | 0.668 0.053 0.011 |
| 4 AGeV | 27.7 0.3 | 46.3 0.8 | 0.667 0.015 0.025 |
| 6 AGeV | 38.4 0.3 | 75.7 1.1 | 0.787 0.014 0.016 |
| 8 AGeV | 46.2 0.4 | 95.9 1.1 | 0.828 0.013 0.005 |

IV Discussion
In this section, some of the characteristics of the observed pion spectra obtained from E895 are discussed. The pion spectral shapes are compared to the predictions of a microscopic transport model, the dN/dy distributions are evaluated in the context of collective dynamics, and the overall yields are used to infer the initial state entropy density obtained in these collisions.
It is interesting to note the asymmetry between the positive and negative pion yields at each beam energy. Although the ratio of negative to positive pions decreases over the studied beam energy range, from 1.88 at 2 AGeV to 1.36 at 8 AGeV (see Tables 1 and 2), it does not reach the asymptotic value of 1.0 observed at the top CERN SPS energyDunn97 ; NA4902 . The neutron excess in Au+Au collisions (118+118 neutrons compared to 79+79 protons) combined with the pion branching ratios suggests that 1.95 negative pions for every positive pion will be produced Stoc86 . If the isospin fractions are folded with the observed cross-sections for NN NN from experimental measurementsVerW82 , the expected ratio of : at 1 AGeV is 1.91:1. The 2 AGeV data, with not far from the (1232) production threshold, are quite near, though a little lower than this predicted ratio. As the energy increases, the number of directly produced pion pairs () is expected to lower the ratio, asymptotically approaching 1.0, which is the trend we observe. At 8 AGeV the negative pion excess is only approximately 36%, compared to 88% at 2 AGeV.
IV.1 RQMD Comparisons
RQMD (Relativistic Quantum Molecular Dynamics) v2.3 Sorg95 is a microscopic transport model which attempts to simulate heavy ion collisions by propagating individually all particles through the six dimensions of phase space in the fireball. Interaction probabilities are approximated by using published interaction cross-sections of free hadrons and the relative phase space proximity of pairs of particles at each time step of the reaction. Inelastic collisions may produce new particles, such as pions, which are also propagated through phase space along with the nucleons. The reaction ends when the phase space density reaches a low enough threshold such that the probability of further interactions is small - the freeze-out point. This model has been reasonably successful in describing many final state observables experimentally measured in the beam energy range studied for this analysis Bass98 .
In this and other cascade models, final-state particle distributions are frozen at the end of the reaction. Post freeze-out effects, such as the Coulomb interaction of the pions with the nuclear fireball, which will be discussed in detail using results from this analysis elsewhere Cebr02b , are not included. However, RQMD combined with an afterburner to simulate final state Coulomb interactions Xu96 and to permit the decay of residual resonances has been successful at describing asymmetries in observed pion yields at low pt.
RQMD version 2.3, with the nucleon mean field setting turned on, was used to generate pion distributions from central (b 3 fm) Au+Au collisions for comparison with the data obtained by E895 for this paper. One of the output parameters from RQMD records the nature of the last collision, “lastcl”, of each particle before freeze-out. Particles whose lastcl was a thermal rescattering are labelled “thermal”. Particles whose lastcl was the decay of a resonance have the parent particle listed explicitly. However, high mass resonances which are not Deltas or vector mesons are combined in a single category labelled “himass” in the user’s notes for the code. Particles whose lastcl was String or Rope fragmentation are indicated separately. Figs. 13 and 14 show the nature of the last collision for and for a centrality selection of b 3 fm at 2 AGeV and 8 AGeV, respectively. The distributions are normalized to the per event yield of pions. In each case, the Delta resonances are the largest single contributor to the last pion interactions before freeze-out.
The dependence of the pion spectral shapes on feed-down from Delta resonances is evident in Fig. 15, which shows the spectra of pions near mid-rapidity (y 0.3) from RQMD. Pions whose last collision was a Delta are plotted separately from the pions with all other last interactions. The spectral shapes are strongly affected by a Delta lastcl. Plotted in Fig. 16 are the ratios of the pion yields from Deltas and all other last interactions to the total yields as a function of . In all cases the Delta pions contribute more significantly to the total yield at low than at high , but the influence of the Delta contribution to the spectra diminishes as the beam energy increases. The total mid-rapidity pion spectra are fit with the same model as was used to describe the data, Eq. (3), with the fit parameters shown in Tables 3 and 4. At both high and low , the RQMD and appear to have common inverse slope parameters and there is no obvious evolution with beam energy. The average value at low (T1) is 72 MeV, while the high (T2) average is 140 MeV. The magnitude of the low RQMD inverse slope parameters is much larger than what is observed in the data at all beam energies. At high , the RQMD inverse slope parameters are much closer to the observed values, except at 2 AGeV, where the data show T 120 MeV at mid-rapidity.
| Ebeam (AGeV) | dN/dy1 | T1 (MeV/c2) | dN/dy2 | T2 (MeV/c2) |
|---|---|---|---|---|
| 2 | 17.4 | 73 | 1.8 | 146 |
| 4 | 21.3 | 73 | 10.9 | 131 |
| 6 | 26.6 | 74 | 15.5 | 146 |
| 8 | 31.7 | 77 | 20.1 | 155 |
| Ebeam (AGeV) | dN/dy1 | T1 (MeV/c2) | dN/dy2 | T2 (MeV/c2) |
|---|---|---|---|---|
| 2 | 10.2 | 73 | 1.6 | 134 |
| 4 | 14.4 | 72 | 8.5 | 131 |
| 6 | 15.5 | 64 | 17.7 | 131 |
| 8 | 21.4 | 70 | 21.3 | 144 |


The rapidity density distributions of charged pions predicted by RQMD are shown in Fig. 17 alongside the E895 data from Figs. 7-11. The contributions to the total dN/dy from Delta resonance decay pions and all other pions are also shown. As the beam energy increases, the contribution to the total from Delta resonance decay pions becomes less important, which is consistent with the trends seen in the data.


IV.2 Longitudinal flow
An important question in heavy ion collisions is the degree of collectivity of the produced particles, which can arise from the build-up of pressure in the hot, dense collision zone. RQMD has no such hydrodynamic effect explicitly included. However, individual particle thermal rescattering, the microscopic analog to pressure, can also drive collective flow, and has been observed in RQMD calculations at RHIC energies Monr99 . Rapidity broadening along the beam axis has been observed in heavy ion collisions at many beam energies for a wide range of systems and particle species Schn93 ; Stac96 ; Brau95 ; Klay02 . This broadening has been interpreted as arising from the collective motion of the system after collision in the longitudinal direction (longitudinal flow). The observed rapidity distributions are compared with the expectation for a stationary thermal source, and with a longitudinally boost-invariant superposition of multiple boosted individual isotropic, locally thermalized sources in a given rapidity interval. Each locally thermalized source is modelled by the -integrated Maxwell-Boltzmann distribution, Eq. (1), with the rapidity dependence of the energy, explicitly included, and T is true temperature:
| (5) |
The distributions are integrated over source element rapidity to extract the maximum longitudinal flow,
| (6) | |||||
where = - , from symmetry about the center of mass, and is the maximum longitudinal velocity in units of c. An average longitudinal flow velocity can be defined as .
Ref. Klay02 presents longitudinal flow velocities extracted from the proton rapidity densities measured by E895 for the same event selection as the pions presented in this analysis and compares the results to values extracted from a wide array of experiments over the beam energy range from 1 to 160 AGeV. Since the protons are present before the collision, at higher beam energies they may be strongly affected by nuclear transparency, which can also broaden the rapidity distributions. Therefore, the protons alone cannot be used to determine the absolute magnitude of the collective motion, if it is present.
In order to determine the degree of collectivity, it is important to compare multiple particle species from the same collisions simultaneously. This has been done with central Si+Al collisions at 14.6 AGeV for protons, pions, kaons and lambda hyperons Brau95 and in central S+S collisions at 200 AGeV for pions, kaons and lambda hyperons Schn93 . A common collective flow velocity was able to reasonably describe all of the observed rapidity distributions, except the protons in S+S collisions at 200 AGeV, where apparent nuclear transparency is more pronounced. A similar simultaneous description is possible here, by combining the proton rapidity distributions from Klay02 with the present pion rapidity distributions.
The rapidity densities of pions and the protons from Ref. Klay02 are shown in Figure 18. Stationary thermal source emission functions, the sum of two of Eq. (5) for the pions using the two inverse slope parameters from the pion transverse mass spectra fits at mid-rapidity, are shown as dashed lines. We have not measured the true system temperature, T, since T1 and T2 parametrize the temperature and known radial flow, resonance and Coulomb effects in the pion spectra. Consequently, T2 overestimates the system temperature and T1 may underestimate (due to competing effects of radial flow, resonance feed-down and the Coulomb interaction with the fireball). Therefore the plotted distributions (dashed lines) are probably wider than the true thermal distributions would be, and yet are still too narrow to reproduce the observed rapidity spectra. The inclusion of longitudinal flow remedies this. For the protons, a single Eq. (5) is used for the thermal rapidity distribution, as in Ref. Klay02 .
The solid curves are the emission functions including longitudinal flow, Eq. (6), with the velocities fixed to the values extracted from the protons ( = 0.28, 0.42, 0.48, 0.50 at 2, 4, 6 and 8 AGeV, respectively). The longitudinally expanding source clearly better reproduces the measured pion distributions at all beam energies than do the dashed curves in Fig. 18. Consistency among particles of different masses supports a hydrodynamical interpretation of the rapidity density broadening; the system is expanding like a fluid with a common longitudinal flow velocity.

IV.3 Entropy production
It was suggested many years ago by Fermi Ferm50 and later Landau Land53 that pion production may be used to estimate the amount of entropy produced in high energy particle collisions. Later, Van Hove VanH82 extended this idea to heavy ion collisions and proposed that this may be a way to distinguish events in which a Quark Gluon Plasma (QGP) is formed. In a QGP the color degrees of freedom of the liberated partons introduce a significant number of new energy states unavailable in a hadron gas. By studying pion production over a broad range of collision systems and energies, discontinuities in the observed multiplicities might indicate the onset of QGP formation.
In 1995, Gaździcki Gazd95a took the available data from heavy ion collisions and showed that there is an increase in the observed entropy produced at the SPS (NA35 Experiment with S+S collisions at 200 AGeV Bach94 ) compared with AGS energies. The low energy heavy ion data follow the trend for p+p collisions, while at the SPS there is an apparent factor of 3 increase in the effective number of degrees of freedom Gazd95b . The entropy production analysis of Pb+Pb collisions at 158 AGeV (NA49) Brad98 supported this observation.
This model assumes that the entropy is produced at the early stage of the collision when the incident matter is in a highly excited state. The thermalized, strongly interacting matter is assumed to expand adiabatically to the freeze-out point, preserving the early stage entropy.
Since the majority of produced particles are pions, to first order, the mean pion (boson) multiplicity should be nearly proportional to the entropy. The ratio of the mean pion multiplicity to the mean number of participating nucleons, , provides a simple estimate of the entropy density. for a nucleus-nucleus collision can be estimated using a Glauber model calculation of the mean free path of the nucleons through the nuclei as they collide at a given impact parameter. For the present analysis, N was estimated using RQMD. The nucleons are distributed according to a Woods-Saxon nuclear density profile and the impact parameter of the simulated collision is used with the nucleon-nucleon interaction cross-sectionsPDG to determine the number of participants. The top 5% of collisions (determined by integrating the N distribution from a set of minimum bias RQMD events at each beam energy) correspond to N = 364, 366, 365, 363 at 2,4,6, and 8 AGeV, respectively. The estimated uncertainty on these values is 5 participants.
Following Ref.NA4902 , the entropy densities for each beam energy, here approximated as , with to account for the neutral pions, are plotted in Fig. 19 as a function of the Fermi energy variable, . E895 data are indicated by stars and the values are tabulated in Table 5. NA49 results for 40, 80 and 158 AGeV Pb+Pb collisions from the CERN SPS were obtained from Ref.NA4902 . The number of participants from NA4902 , calculated using the FritiofAnde93 model, are also listed in Table 5.
The linear dependence of the entropy per participant nucleon as a function of F in the proton-proton(anti-proton) data is not evident for the full range of the heavy ion collision data. At and below AGS energies, the heavy ion data lie below the p+p data, and appear to be approximately linear with F. In Ref. NA4902 , the SPS results combined with RHIC results at much higher energies from the PHOBOS Collaboration show a linear trend with a slope that is approximately 1.3 times larger than at the lower energies. There appears to be a transition in the region between the AGS and top SPS energies. The third-order polynomial fit to the heavy ion data shown on Fig. 19 may indicate that a smooth trend with increasing F can accurately describe the excitation function without the need for a discontinuous jump, such as one might expect from a first-order phase transition. Two more runs at the SPS with beam energies of 20 AGeV and 30 AGeV may be able to improve the resolution in this important transition region.
| (GeV) | F (GeV1/2) | ||
|---|---|---|---|
| 2.630 | 0.644 | 364 | 0.2279 0.0159 |
| 3.279 | 0.965 | 366 | 0.5012 0.0111 |
| 3.838 | 1.190 | 365 | 0.7385 0.0148 |
| 4.289 | 1.351 | 363 | 0.9364 0.0170 |
| 8.830 | 2.452 | 349 | 2.6433 0.0858 |
| 12.280 | 3.099 | 349 | 3.9542 0.0869 |
| 17.260 | 3.821 | 362 | 5.2127 0.1823 |

V Summary
Transverse mass and rapidity spectra of charged pions in 2-8 AGeV 0-5% central Au+Au collisions have been measured by the E895 experiment. The transverse mass spectra exhibit a low-pt enhancement which can be largely ascribed to the feed-down from late stage resonance decays. Differences in the and spectra at low are not reproduced by RQMD, which does not include final state interactions such as the Coulomb interaction with the nuclear source. The inverse slope parameters increase as a function of beam energy and appear to be charge independent at high . The measured rapidity distributions show excellent forward-backward rapidity symmetry and are well described by a model which includes collective longitudinal flow, with a velocity that is common to both pions and protons emitted in these collisions. The 4 yields of pions, obtained by integrating the rapidity distributions, have been used to infer an initial state entropy which increases with beam energy and is consistent with a smooth non-linear trend as a function of F from the 2 AGeV Au+Au collisions to 158 AGeV Pb+Pb collisions at the SPS.
This work was supported in part by the U.S. Department of Energy under grants DE-FG02-87ER40331.A008, DE-FG02-89ER40531, DE-FG02-88ER40408, DE-FG02-87ER40324, and contract DE-AC03-76SF00098; by the US National Science Foundation under Grants No. PHY-98-04672, PHY-9722653, PHY-96-05207, PHY-9601271, and PHY-9225096; and by the University of Auckland Research Committee, NZ/USA Cooperative Science Programme CSP 95/33.
References
- (1) M.A. Lisa, et al., (EOS Collaboration), Phys. Rev. Lett. 75, 2662 (1995).
- (2) N. Herrmann, et al., (FOPI Collaboration), Nucl. Phys. A610, 49c (1996).
- (3) L. Ahle, et al., (E802 Collaboration), Phys. Rev. C 57, R466 (1998).
- (4) J. Barrette, et al., (E877 Collaboration), Phys. Rev. C 62 024901 (2000).
- (5) H. Stöcker and W. Greiner, Phys. Rep. 137, 277 (1986).
- (6) G.F. Bertsch and S. Das Gupta, Phys. Rep. 160, 189 (1988).
- (7) S.J. Wang, B.A. Li, W. Bauer and J. Randrup, Ann. Phys. 209 (1991).
- (8) B.A. Li and K.M. Ko, Phys. Rev. C 52, 2037 (1995).
- (9) C. Pinkenburg, et al., (E895 Collaboration), Phys. Rev. Lett. 83, 1295 (1999).
- (10) H. Liu, et al., (E895 Collaboration), Phys. Rev. Lett. 84, 5488 (2000).
- (11) S. Nagamiya et al., Phys. Rev. C 24, 971 (1981).
- (12) H. Ströbele et al. Phys. Rev. C 27, 1349 (1983).
- (13) R. Stock, Phys. Rep. 135, 259 (1986).
- (14) P. Danielewicz, Phys. Rev. C 51, 716 (1995).
- (15) H. Stöcker, J. Phys. G. Nucl. Phys. 6, L111 (1984).
- (16) D. Pelte, et al., (FOPI Collaboration), Z. Phys. A 357, 215 (1997).
- (17) A. Wagner et al., Phys. Lett. B 420, 20 (1998).
- (18) L.B. Venema et al. Phys. Rev. Lett. 71, 835 (1993).
- (19) O. Schwalb et al., Phys. Lett. B 321, 20 (1994).
- (20) H. Sorge, Phys. Rev. C 49, R1253 (1994).
- (21) J. Barrette, et al. (E877 Collaboration), Phys. Lett. B 351, 93 (1995).
- (22) J. Stachel, Nucl. Phys. A610, 509c (1996).
- (23) J.L. Klay, et al., E895 Collaboration, Phys. Rev. Lett. 88, 102301 (2002).
- (24) S.V. Afanasiev, et al. (NA49 Collaboration), Phys. Rev. C 66, 054902 (2002).
- (25) G. Rai et al., IEEE Trans. Nucl. Sci. 37, 56 (1990).
- (26) C. Cavata, et al., Phys. Rev. C 42, 1760 (1990).
- (27) L. Ahle et al., (E866/E917 Collaborations), Nucl. Phys. A638, 57c (1998).
- (28) J.C. Dunlop, PhD Dissertation, Massachusetts Institute of Technology (1999).
- (29) R. Seto et al., (E917 Collaboration), Nucl. Phys. A638, 407c (1998).
- (30) L. Ahle et al., (E866/E917 Collaborations), Phys. Lett. B 476, 1 (2000).
- (31) Ekkard Schnedermann, Josef Sollfrank and Ulrich Heinz, Phys. Rev. C 48, 2462 (1993).
- (32) Josef Sollfrank, Peter Koch and Ulrich Heinz, Phys. Lett. B 252, 256 (1990).
- (33) M. Hofmann, R. Mattiello, H. Sorge, H. Stöcker, and W. Greiner, Phys. Rev. C 51, 2095 (1995).
- (34) W. Weinhold, B. Friman, W. Nörenberg, Phys.Lett. B 433 (1998).
- (35) M. Gyulassy and S.K. Kauffmann, Nucl. Phys. A362, 503 (1981).
- (36) H.W. Barz, J.P. Bondorf, J.J. Gaardhøje, and H. Heiselberg, Phys. Rev. C 57, 2536 (1998).
- (37) A. Ayala, S. Jeon and J. Kapusta, Phys. Rev. C 59, 3324 (1999).
- (38) D.A. Cebra et al., (E895 Collaboration), Coulomb Interaction Manuscript in preparation..
- (39) J.W. Dunn, PhD Dissertation, University of California, Davis (1997).
- (40) B.J. VerWest and R.A. Arndt. Phys. Rev. C 25, 1979 (1982).
- (41) H. Sorge, Phys. Rev. C 52, 3291 (1995).
- (42) S.A. Bass, et al., Prog. Part. Nucl Phys. 41 225 (1998).
- (43) N. Xu, et al., (NA44 Collaboration), Nucl. Phys. A610 175c-187c (1996).
- (44) B. Monreal, W.J. Llope, R. Mattiello, S.Y. Panitkin, H. Sorge, N. Xu, Phys. Rev. C 60, 051902 (1999).
- (45) P. Braun-Munzinger, J. Stachel, J.P. Wessels, N. Xu, Phys. Lett. B 344, 43 (1995).
- (46) E. Fermi, Prog. Theor. Phys. 5, 570 (1950).
- (47) L.D. Landau, Izv. Akad. Nauk SSSR, Ser. Fiz. 17, 51 (1953).
- (48) L. Van Hove, Phys. Lett. B 118, 138 (1982).
- (49) Marek Gaździcki, Dieter Rörich, Z. Phys. C 65, 215 (1995).
- (50) J. Bächler, et al., (NA35 Collaboration), Phys. Rev. Lett. 72, 1419 (1994).
- (51) Marek Gaździcki, Z. Phys. C 66, 659 (1995).
- (52) P. Brady, J. Dunn, Eur. Phys. J. C 5, 357 (1998).
- (53) Particle Data Group, The Eur. Phys. J. 15, 1 (2000).
- (54) B. Andersson, G. Gustafson and Hong Pi, Z. Phys. C 57, 485 (1993).