Centrality dependence of charged hadron transverse momentum spectra in d+Au collisions at 200 GeV
Abstract
We have measured transverse momentum distributions of charged hadrons produced in d+Au collisions at 200 GeV. The spectra were obtained for transverse momenta GeV/c, in a pseudorapidity range of in the deuteron direction. The evolution of the spectra with collision centrality is presented in comparison to collisions at the same collision energy. With increasing centrality, the yield at high transverse momenta increases more rapidly than the overall particle density, leading to a strong modification of the spectral shape. This change in spectral shape is qualitatively different from observations in Au+Au collisions at the same energy. The results provide important information for discriminating between different models for the suppression of high- hadrons observed in Au+Au collisions.
PACS numbers: 25.75.-q,25.75.Dw,25.75.Gz
The yield of charged hadrons produced in collisions of deuterons with gold nuclei at an energy of GeV has been measured with the PHOBOS detector at the Relativistic Heavy Ion Collider (RHIC) at Brookhaven National Laboratory. The data are presented as a function of transverse momentum () and collision centrality. The goal of these measurements is to study the modification of particle production due to initial state effects in the nuclear medium, in comparison to nucleon-nucleon collisions at the same energy. Measurements from proton-nucleus (p+A) reactions at lower collision energies have found that the cross-section for hadron production at of 1.5 to 5 GeV/c rises faster than the nuclear size cronin . This observation, which is commonly called the Cronin effect, has been described as the result of initial state multiple scattering, leading to a broadening of the distribution accardi .
The present interest in repeating these measurements at higher energies is motivated by results from Au+Au collisions at 130 and 200 GeV. In these collisions, the expected scaling of hadron production with the number of binary nucleon-nucleon collisions at of 2–10 GeV/c is strongly violated phenix_quench ; phenix_highpt_npart ; star_highpt_npart ; phobos_highpt_npart . This effect had been predicted as a consequence of the energy loss of high- partons in the hot and dense medium formed in Au+Au collisions jet_quench_theory . The interpretation of the Au+Au data relies on the understanding of initial state effects, including gluon saturation kharzeev , which can be investigated with the d+Au data presented here wang_dAu . Similar measurements are reported in phenix_dAu ; star_dAu . By studying the spectra as a function of collision centrality, we can control the effective thickness of nuclear matter traversed by the incoming partons.
The data were collected using the PHOBOS two-arm magnetic spectrometer phobos_nim . The spectrometer arms are each equipped with 16 layers of silicon sensors, providing charged particle tracking both outside and inside the 2 T field of the PHOBOS magnet. Additional silicon detectors used in this analysis are the central single-layer Octagon barrel detector and the three single-layer forward Ring detectors located on either side of the interaction point.
The primary event trigger (Level 0) was provided by two sets of 16 scintillator counters (“Paddle counters”) covering pseudorapidities . In addition, two higher level trigger conditions were used. Collisions close to the nominal vertex position along the longitudinal () direction were selected using the time difference between signals in two rings of ten Čerenkov counters. The counters covered and , respectively. For part of the data set, a further online selection of events was accomplished using two arrays of horizontally segmented scintillator hodoscopes. One array was positioned immediately behind the spectrometer and the other at a distance of m from the interaction point. In combination with the known vertex position, a spatial coincidence from the hodoscopes was used to trigger on high- particles which traverse the spectrometer.
Previous measurements of p+A collisions have shown a strong dependence of the multiplicities and momentum distributions of produced particles on the size of the target nucleus cronin ; halliwell . For d+Au collisions, this implies the importance of characterizing the collision centrality. For a given event selection, the centrality can be quantified by a number of variables such as the average number of participating nucleons or the average number of binary nucleon-nucleon collisions, . Neither of these variables can be directly measured. Estimates of or for a given event selection are typically obtained by matching the distribution of an experimental observable, such as the multiplicity in a certain -region, with the results of a Glauber model calculation and detector simulation phobos_cent_200 .
| Centrality Selection | Efficiency | ||
|---|---|---|---|
| 0–20% | 82% | ||
| 20–40% | 73% | ||
| 40–70% | 49% | ||
| 70–100% | 14% |
The centrality cuts for this analysis were based on the signal () of the three Ring detectors in the region of , which is proportional to the number of charged particles hitting these counters. In the MC simulations, centrality cuts on were found to introduce a bias on the yield in the spectrometer acceptance of less than 5% for , compared to cutting directly on . If the determination is based on a multiplicity region closer to the spectrometer acceptance, MC studies, as well as our data, showed a significantly larger bias at low and high centralities. For each of the four bins in , and were obtained from a Glauber model calculation using HIJING hijing and a full detector simulation which included the experimental trigger and event selection efficiency. In the HIJING calculations, the default value for the inelastic nucleon-nucleon cross-section of 41 mb was used, consistent with previous calculations phobos_cent_200 .
The resulting estimates for and in the four -based centrality bins are shown in Table I. The percentage numbers refer to the fractional cross-section in the unbiased HIJING distribution. The determination of and takes into account the bias introduced in the centrality by the online and offline event selection in the relatively low-multiplicity d+Au events. The largest contribution to this bias comes from the online vertex trigger, leading to the average event selection efficiencies for the individual centrality bins shown in Table I.
Details of the track reconstruction algorithm can be found in pbarp_200 ; phobos_highpt_npart . To optimize the momentum resolution and minimize systematic errors in the track selection, only particles traversing the full spectrometer arms were included in the analysis. These particles leave a minimum of 12 hits in the silicon detectors. This selection limits the usable vertex range to cm. Due to the low multiplicity in d+Au collisions, a new algorithm for the offline determination of the collision vertex was developed, using hit position and energy information in the Octagon detector. MC studies show a resolution in the beam direction of cm for the most peripheral events and cm for the most central events. The transverse position of the event vertex was centered at the known position of the beam orbit. Unlike in the Au+Au track finding, the vertex position information was not included in the initial track seed.
To obtain the invariant yield of charged hadrons, we accumulated equal amounts of data with both magnet polarities. The transverse momentum distributions for each centrality bin were corrected for the geometrical acceptance of the detector, the efficiency of the tracking algorithm and the distortion due to binning and momentum resolution. The procedure for obtaining the correction factors was described in phobos_highpt_npart . The largest contributions to the systematic uncertainty come from the overall tracking efficiency (5–10% uncertainty) and the reduction in overall acceptance due to malfunctioning channels in the silicon detectors (5% uncertainty). The corresponding corrections are centrality independent. The next largest correction is the and centrality dependent momentum resolution and binning correction. The contamination by secondary particles and feeddown particles is small, due to the proximity of the tracking detectors to the collision vertex and the requirement for the reconstructed track to point back to the beam orbit to within 0.4 cm.
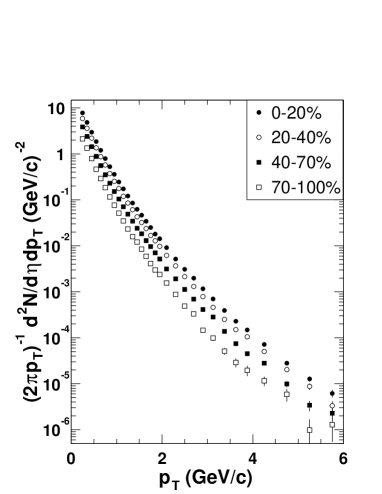
In Fig. 1, we present the invariant yield of charged hadrons as a function of transverse momentum, obtained by averaging the yields of positive and negative hadrons. Data are shown for four centrality bins. The plot shows the evolution of overall yield and spectral shape with increasing collision centrality.
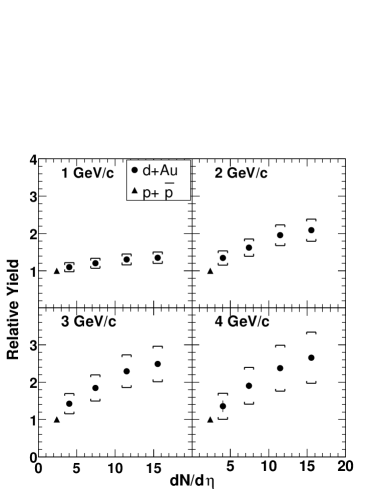
The centrality evolution of the spectra can be studied in detail in Fig. 2, where we compare our d+Au data to results from UA1 for collisions at the same energy ua1_pbarp . To account for the difference in acceptance between UA1 () and PHOBOS, a correction function was determined using PYTHIA pythia . The quantity shown on the vertical axis in Fig. 2 is a direct measure of the modification of the spectral shape relative to for each centrality bin in d+Au and is defined as follows: the fitted distribution for each centrality bin is divided by the corrected fit to the UA1 data fit . The resulting distribution is normalized to unity at GeV/c. Then the value of the normalized ratio at four values of from 1 to 4 GeV/c is plotted against determined by integrating the hadron spectrum for each centrality bin. If there were no modification of the spectral shape relative to collisions, the ratio would be flat at unity. This presentation of the data allows an investigation of the evolution of the spectral shape with increasing centrality, while eliminating the uncertainty associated with the determination of . We observe that the relative yield for all regions grows smoothly as a function of , with the biggest increase relative to observed at the largest . For all regions, the data extrapolate to the corrected fit.
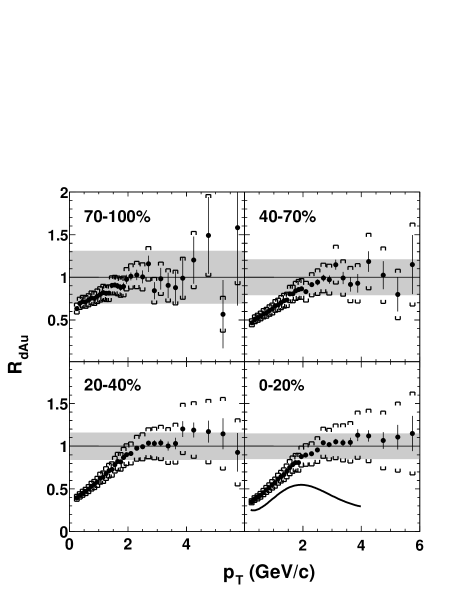
In Fig. 3 we present the nuclear modification factor as a function of for each centrality bin, defined as
| (1) |
Consistent with our Glauber calculations, we used mb. A value of corresponds to scaling of the yield as an incoherent superposition of nucleon-nucleon collisions. For all centrality bins, we observe a rapid rise of from low , leveling off at of GeV/c. For comparison, we also plot the results from central Au+Au collisions at the same energy phobos_highpt_npart in the lower right panel of Fig. 3. The average number of collisions undergone by each participating nucleon in the central Au+Au collision is close to 6, similar to that of each nucleon from the deuteron in a central d+Au collision. For central Au+Au collisions, the ratio of the spectra to rises rapidly up to GeV/c, but falls far short of collision scaling at larger , in striking contrast to the behavior for central d+Au collisions.
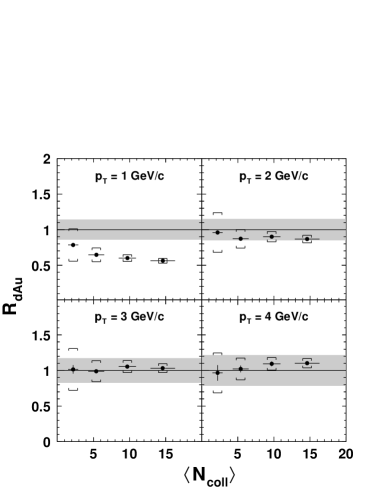
Predictions for the evolution of from semi-peripheral collisions with to central collisions were made in two qualitatively different models. Perturbative QCD calculations vitev predict an increase in the maximum value of at GeV/c by 15%. In contrast, a decrease in by 25–30% over the same centrality range is predicted in a parton saturation model kharzeev . The centrality evolution of is shown in Fig. 4, where the points were obtained from a fit to the dependence of in each centrality bin. Our data disfavor the prediction from the parton saturation model. This suggests that the observed suppression of high hadrons in Au+Au collisions phenix_quench ; phenix_highpt_npart ; star_highpt_npart ; phobos_highpt_npart cannot be accounted for by initial state effects that should also be present in d+Au collisions.
This work was partially supported by US DoE grants DE-AC02-98CH10886, DE-FG02-93ER40802, DE-FC02-94ER40818, DE-FG02-94ER40865, DE-FG02-99ER41099, W-31-109-ENG-38, US NSF grants 9603486, 9722606, 0072204, Polish KBN grant 2-P03B-10323, and NSC of Taiwan contract NSC 89-2112-M-008-024.
References
- (1) J. W. Cronin et al., Phys. Rev. D11 (1975) 3105.
- (2) For a recent review, see A. Accardi, arXiv:hep-ph/0212148.
- (3) K. Adcox et al., Phys. Rev. Lett. 88 (2002) 022301.
- (4) K. Adcox et al., arXiv:nucl-ex/0207009.
- (5) C. Adler et al., Phys. Rev. Lett. 89 (2002) 202301.
- (6) B. B. Back et al., arXiv:nucl-ex/0302015, submitted to Phys. Lett. B.
- (7) M. Gyulassy and M. Plümer, Phys. Lett. 243 (1990) 432.
- (8) D. Kharzeev, E. Levin, L. McLerran, BNL preprint BNL-NT-02/22, arXiv:hep-ph/0210332.
- (9) X. N. Wang, Phys. Rev. C61 (2000) 064910.
- (10) S. S. Adler et al., arXiv:nucl-ex/0306021
- (11) J. Adams et al., arXiv:nucl-ex/0306024.
- (12) B. B. Back et al., Nucl. Inst. Meth. A499 (2003) 603.
- (13) C. Halliwell et al., Phys. Rev. Lett. 39 (1977) 1499.
- (14) B. B. Back et al., Phys. Rev. C65 (2002), 061901.
- (15) M. Gyulassy and X. N. Wang, Comp. Phys. Comm. 83 (1994) 307. We used HIJING v1.383 with default parameters.
- (16) B. B. Back et al., Phys. Rev. C67 (2003) 021901.
- (17) C. Albajar et al., Nucl. Phys. B335, (1990) 261.
- (18) T. Sjostrand, PYTHIA manual, Comp. Phys. Comm. 82 (1994) 74. We used PYTHIA 6.161.
- (19) The reference spectrum is well fitted by , with given in GeV/c.
- (20) I. Vitev, arXiv:nucl-th/0302002.