System size dependence of strangeness production at 158 GeV
Abstract
An enhanced production of strange particles per pion in heavy ion collisions compared to elementary p+p interactions was observed in Pb+Pb reactions at the CERN SPS. New results obtained on small colliding systems, C+C and Si+Si, also show an enhancement. It increases steeply with system size and reaches in the larger system almost the level measured in Pb+Pb reactions. The shapes of the transverse mass spectra of strange mesons (K+, K-, ) and baryons (, ) are consistent with the presence of collective transverse flow, which is already visible in small systems (C+C) and increases with the system size. The ratio together with the ratio yields information about the baryochemical potential . The potential, determined at midrapidity, increases with the system size since the stronger stopping shifts baryons from near beam and projectile rapidity towards midrapidity. For the yields is almost independent of the size of the colliding system.
1 Introduction
Strangeness enhancement in heavy ion reactions compared to elementary interactions and strong radial expansion of the collision fireball were treated, among others, as indications for the formation of deconfined strongly interacting matter [1]. Both were observed in Pb+Pb reactions at the CERN SPS [2]. Prior results from sulfur induced reactions at 200 GeV [3] also showed a strangeness enhancement. These results provoked questions about the evolution of strangeness production and radial flow with the size of the fireball.
Central collisions of small systems will be compared to previously measured p+p and central Pb+Pb interactions instead of centrality selected Pb+Pb reactions, because it was recently shown in the framework of Glauber and UrQMD calculations [4] that the peripheral collision geometry leads to a different fraction of nucleons suffering multiple collisions and to different space time densities of inelastic collisions compared to central reactions of small nuclei at the same number of wounded nucleons.
2 Experimental procedure
In this section the definition of the C and Si beams and the event statistics as well as the experimental setup and the particle identification procedures are described.
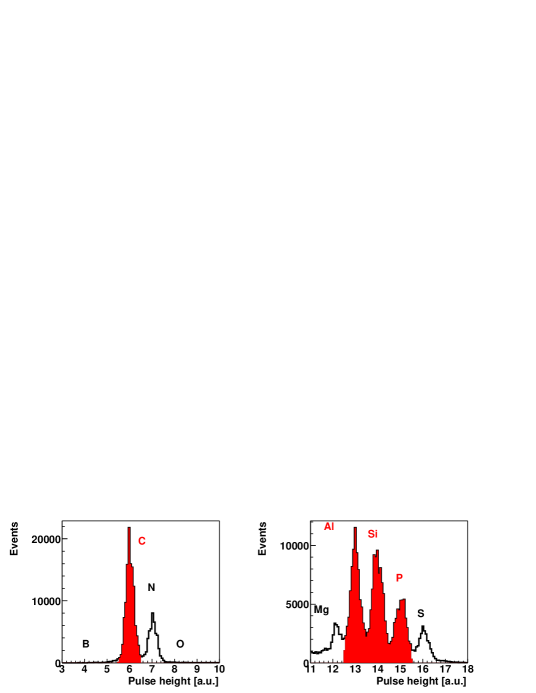
The CERN SPS accelerator provided a 158 GeV Pb beam, which was steered onto a C fragmentation target. The fragments were selected in the beam line according to their rigidity. Figure 1 shows the pulse height distributions, which correspond to the charge distributions of the beam particles, selected online by additional energy loss cuts, for the C setting (left) and Si (right). The final identification was carried out offline by charge and energy loss measurements obtained from beam line detectors. The pion, kaon and meson analysis is based on a mixed beam of C and N ions, while the pure C beam was used for the hyperon analysis. Both will be called C+C later on, the Si+Si named results arise from a mixed Al, Si and P beam for all analysed particles.
The data sets consist of 46k C+C events, taken with a 2.4 interaction length C target (0.56 ) for the meson analysis. In addition a interaction length C target (1.84 ) was used to increase the statistics to 252k events for the hyperon analysis. The Si target (1.17 ) had an interaction length of , 43k events were used for the mesons analysis and 173k events in case of the hyperons. The centrality selection was performed by an online trigger on the energy deposited in the zero degree calorimeter, which measures the energy of the projectile spectators. The most central C+C (Si+Si) events were selected. The corresponding numbers of wounded nucleons are derived from VENUS simulations [5].
The NA49 large acceptance hadron spectrometer [6] consists of four time projection chambers, two of them are placed inside a magnetic field downstream of the target and two further downstream on either side of the beam line. Tracking of charged particles in the forward hemisphere () and measurement of the specific energy loss (dE/dx) give access to the momentum and particle identification. The mesons were identified by calculating the invariant mass of pairs, for the hyperons () requirements on the invariant mass and decay topology were used. Losses due to geometrical acceptance and reconstruction inefficiency were determined from GEANT simulations. The simulations were also used to correct for and decay in flight and and finding inefficiency and losses due to restrictions in the decay topology. Corrections for the feeding from weak decays are not yet applied.
3 Particle yields and spectra
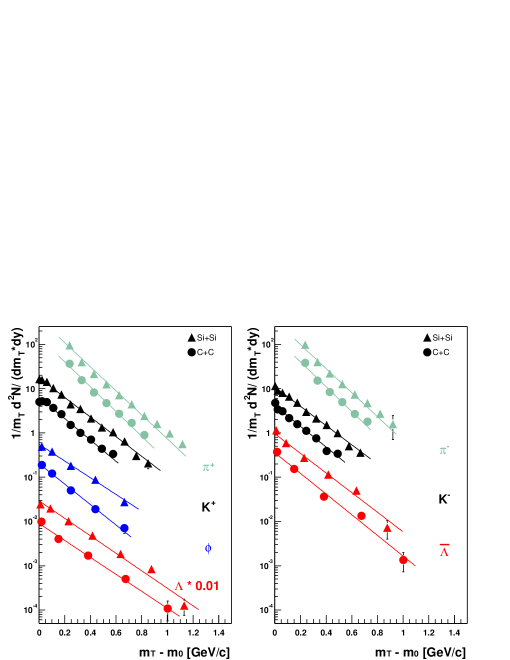
Particle yields of charged pions and kaons, mesons and hyperons in C+C and Si+Si collisions were obtained in rapidity and bins. The transverse mass spectra () measured close to midrapidity are shown in figure 2. Motivated by the thermal ansatz they were fitted with an exponential
The fitted inverse slope parameters are shown in figure 3 as a function of the particle mass. Results of p+p [7] and Pb+Pb reactions [2] are included for comparison. The lines are meant to guide the eye, their increasing slope can be interpreted as increasing radial flow, which is not visible in p+p interactions, but already present in C+C interactions and further rising with the system size. This is an indication of collective effects already established in small systems. The inverse slope parameter of hyperons is 20 above the one of hyperons in p+p interactions, this difference is decreasing with the system size and vanishes in the largest colliding system.

The exponential fits were used to extrapolate the measured transverse mass spectra in order to obtain rapidity densities, which were finally fitted by single Gaussians for the pions, kaons and mesons. The integration results in the total yields of the various particles (see [4] for details). The rapidity distributions for hyperons, shown in figure 4a, were fitted by a single Gaussian as well, but because of the lack of data far-off midrapidity there is a large uncertainty in the extrapolation. This leads to large systematic errors. The total multiplicities amount to and , respectively. The extrapolation of the rapidity distributions of hyperons, shown in figure 4b, is even more complicated, because the almost flat distributions provide no indication for the shape in the not measured rapidity region. Two extreme cases were assumed to estimate upper and lower limits of the yields. The curve on the right hand side (figure 4b) is a scaled parametrisation of the rapidity distributions measured in p+p interactions. The forward/backward peaked shape provides an upper limit of the yield. The straight line on the left hand side, obtained from the scaled distribution measured in S+S reactions, should create a lower limit, since the hyperons are expected to be shifted towards midrapidity due to stronger stopping in S+S compared to the smaller C+C and Si+Si systems. The yields, calculated as the average of both extrapolation methods are and , respectively.
4 System size dependence
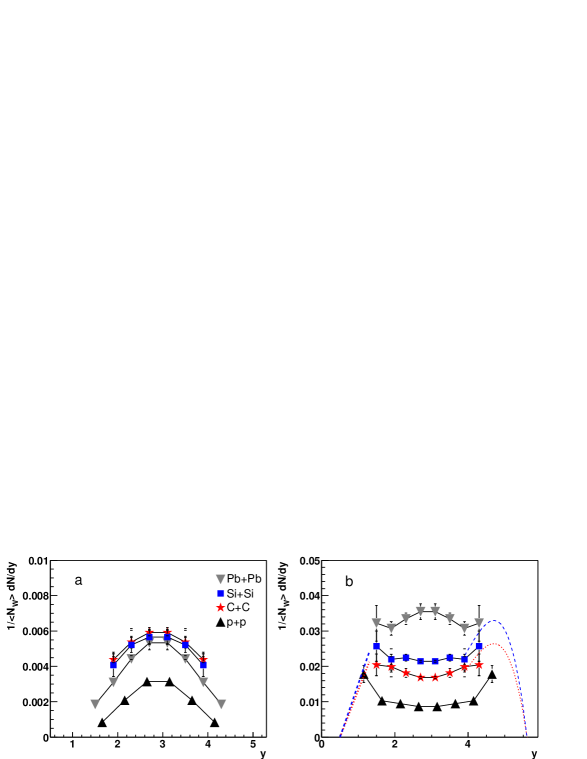
The increasing baryon stopping with the system size, mentioned above, is illustrated in figure 4, where the rapidity spectra of and hyperons, measured in several collision systems are compared. The newly produced hyperons are always peaked at midrapidity and their width is not affected by the increasing probability of multiple collisions, while, especially in the small systems, an essential fraction of the hyperons carry quarks (momentum) of the beam and projectile nucleons. So, their evolution from the forward/backward peaked shape to a maximum at midrapidity with the size of the fireball is a clear indication for increasing stopping of the incident nucleons.
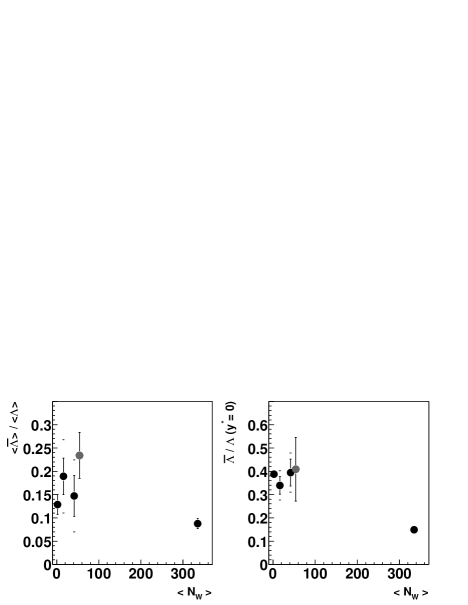
This has a strong effect on the ratio at midrapidity (figure 5 right), which is decreasing by more than a factor of two when going from p+p interactions to Pb+Pb collisions. The ratio of the total yields (figure 5 left) exhibit a less pronounced dependence on the system size. A similar behavior is seen for the ratios (not shown), both at midrapidity and in full phase space. The higher value of the ratio in S+S reactions might be due to the lower stopping at higher beam energy. The clear difference between the system size dependence of midrapidity and ratios has a significant impact on the comparison of the data with statistical models. In this framework the ratio together with the ratio is a measure of the baryochemical potential, since they are related by [8] and the chemical freeze-out temperature can be assumed, as a good approximation, to be about 160 MeV for all systems [9]. The potential, calculated from the total yields, is in the range of 190 MeV and shows only a weak dependence on the system size. This is slightly below statistical model fits [10] based on different particle yields except the hyperons, while , deduced from midrapidity ratios, reaches just 110 MeV in the small systems.
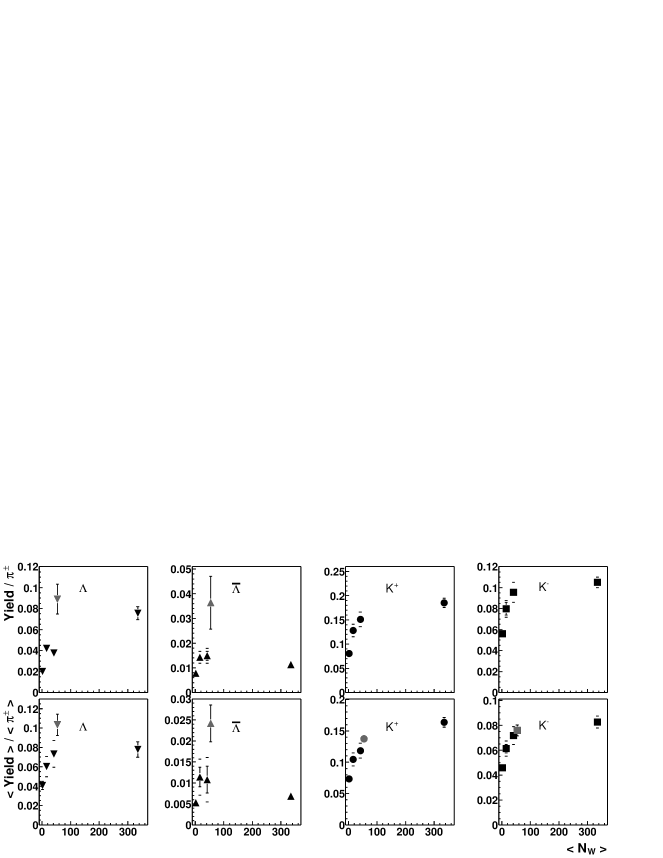
The yield of strange particles per pion () as a function of the number of wounded nucleons is shown in figure 6 for the midrapidity densities (top) and for the total multiplicities (bottom). The relative K+, K- and production is steeply rising with the system size, most of the enhancement obtained in Pb+Pb collisions is already reached in Si+Si and S+S interactions. This behaviour is expected in the thermal picture for the transition from canonical to grand canonical ensembles. In the same picture the maximum in the ratio again at intermediate system sizes can be attributed to the increasing production because of this volume effect followed by a decrease due to the larger baryochemical potential in larger systems.
References
References
- [1] Heinz U 2001 Nucl. Phys. A 685 414c
- [2] Afanasiev S V et al2002 Phys. Rev. C 66 054902, Fanebust K et al2002 J. Phys. G 28 1607
- [3] Bartke J et al1990 Z. Phys. C 48 191, Alber T et al1994 Z. Phys. C 64 195
- [4] Höhne C for the NA49 Collab. nucl-ex/0209018, to appear in Nucl. Phys. A (Proc. of QM 02)
- [5] Werner K 1993 Phys. Rep. 232 87
- [6] Afanasiev S et al1999 Nucl. Instr. Meth. A 430 210
- [7] Susa T et al2002 Nucl.Phys. A 698 491
- [8] Sollfrank J et al1994 Z.Phys. C 61 659
- [9] Becattini F and Pettini G 2003 hep-ph/0204340
- [10] Cleymans J, in this volume