0
Precision neutron interferometric measurements
and updated evaluations of the n-p and n-d coherent neutron
scattering lengths
Abstract
We have performed high precision measurements of the coherent neutron scattering lengths of gas phase molecular hydrogen and deuterium using neutron interferometry. After correcting for molecular binding and multiple scattering from the molecule, we find fm and fm. Our results are in agreement with the world average of previous measurements, fm and fm. The new world averages for the n-p and n-d coherent scattering lengths, including our new results, are fm and fm. We compare with the calculations of the doublet and quartet scattering lengths of several nucleon-nucleon (NN) potential models and show that almost all known calculations are in disagreement with the precisely-measured linear combination corresponding to the coherent scattering length. Combining the world data on with the modern high-precision theoretical calculations of the quartet n-d scattering lengths recently summarized by Friar et al., we deduce a new value for the doublet scattering length of (exp)(theory)) fm. This value is a factor of 4 more precise than the previously accepted value of (exp)) fm. The current state of knowledge of scattering lengths in the related p-d system, ideas for improving by a factor of five the accuracy of the and measurements using neutron interferometry, and possibilities for further improvement of our knowledge of the coherent neutron scattering lengths of 3H, 3He, and 4He are discussed.
pacs:
03.75.Dg, 07.60.Ly, 61.12.-qI Introduction
The three-nucleon system is both fascinating and remarkable. Despite decades of intensive study with increasingly sophisticated theoretical tools, fundamental facets of the system remain mysterious, confusing, and contradictory. Realistic nucleon-nucleon (NN) potentials underbind 3He and 3H by several hundred keV Fri83 . The p-d and n-d scattering lengths in the doublet s-wave channel, which are apparently strongly correlated to the 3He and 3H binding energies respectively, are likewise poorly predicted by NN force models. Convergence between theory and experiment for these fundamental parameters can be obtained only by the ad hoc admixture of three-nucleon (3N) forces. Although it is well understood that 3N forces must exist with a weaker strength and shorter range than the NN force, little else is known. The incomplete nature of current 3N force models is demonstrated by their tendency to resolve certain problems, such as tri-nucleon underbinding, at the expense of exacerbating discrepancies in other observables Ish99 ; Wit93 ; Glo96 ; Kie95a ; Ros95 ; Kie95b ; Pud97 ; Car94 .
Of course one must first understand two-nucleon forces in detail before one can isolate possible 3N force effects. A wide variety of NN forces are deployed in modern nuclear physics calculations, but they have certain features in common. They all employ short-range, semi-phenomenological forces matched to a one pion exchange potential (OPEP) tail beyond fm, and they all give roughly the same results for the low-energy observables. They are all constrained to reproduce the NN observables as well as the properties of the deuteron. They also must incorporate deviations from isospin symmetry to describe the data. One of the most sophisticated of the modern potentials–the AV18 potential–includes, in addition to purely electromagnetic terms, terms accounting for charge independence breaking (CIB) and charge symmetry breaking (CSB), which are phenomenologically adjusted to replicate the n–n, p–p and n–p scattering lengthsWir95 .
The accessible places to look for 3N force effects are the bound states of 3H and 3He and the scattering states of n-d and p-d. Since 3H and n-d are free from electromagnetic complications (both theoretical and experimental), they are the systems of choice for precision tests. For all of these systems, the computational tools presently available are believed to be excellent. “Exact” Fadeev solutions are available for the scattering states below the deuteron breakup threshold. Above breakup threshold, the n-d equations can also be solved exactly throughout the entire range of applicability of the potential models employed. In addition to these exact models, other methods based on the reactance matrix (K-matrix), such as the hyperspherical harmonic expansion of Kievsky et al.Kie93 , the effective field theory of Bedaque et al.Bed97 , as well as dispersion theory/phenomenological models such as that of HaleHal00 , provide complementary insights and information that goes beyond tests of potential models.
Recently, significant insight into certain features of three-nucleon systems has come from the effective field theory (EFT) approach Bed98 ; Ham99 . EFT has been used to solve the three nucleon problem with short-range interactions in a systematic expansion in the small momentum region set by , where is the momentum transfer and is the scattering length. For the two-body system EFT is equivalent to effective range theory and reproduces its well-known results Kol98 ; Kap98 ; Geg98 . The chiral EFT expansion does not require the introduction of an operator corresponding to a 3N force until next-to-next-to leading order (NNLO) in the expansion, and at this order it requires only two low energy constantsEpe01 . With these two parameters determined from experiment, chiral EFT can make precise predictions for other three-body observables. It is clear that precision measurements of the three-nucleon scattering lengths provide both valuable theoretical benchmarks and critical input parameters for the study of three-nucleon systems.
The most important data, of course, is the measurement of the zero-energy scattering. With the neutron interferometer at NIST, we have made measurements of the coherent n-p and n-d bound scattering lengths, , which are related to the free scattering length by
| (1) |
Here, is the mass of the neutron and is the mass of the atom. For hydrogen, is the linear combination of the singlet and the triplet scattering lengths given by,
| (2) |
and for deuterium it is the linear combination of the doublet and quartet scattering lengths,
| (3) |
These new measurements have uncertainties that are comparable to (in n-p) and smaller than (in n-d) previous results.
The n–d measurement yields a linear combination of the doublet and quartet scattering lengths and not the separate channel scattering lengths. There are good reasons however to have confidence that the doublet (2S1/2) scattering length can be extracted from this measurement reliably with some help from theory. In the first place, the quartet -wave scattering length (4S3/2) can be unambiguously determined. Because the three nucleons in this channel exist in a spin-symmetric state, and hence have an antisymmetric space-isospin wavefunction, the scattering in this state is completely determined by the long range part of the triplet -wave NN interaction in the n-p channel; i.e. by n-p scattering and the properties of the deuteron. Furthermore, the use of multi-energy phase shift analysis, such as that conducted by Black et al. in the p-d systemBla99 , could allow one to extrapolate to the very low energy quartet phase shifts on the basis of data at higher energies. This is possible because, unlike the 2S1/2 effective range function, the 4S3/2 effective range function is free of singularities. Therefore, one can independently predict the zero energy quartet -wave scattering length both from fundamentally sound theory and from the totality of the sub-breakup n-d database.
A high accuracy determination of the 2S1/2 scattering length in the n-d system is of interest for a number of reasons. The Pauli principle does not deter this channel from exploring the shorter-range components of the interaction, where 3N forces should appear, and the Coulomb interaction is not present to complicate experiment or analysis. The n-d system is also in principle sensitive to charge symmetry breaking (CSB) effects. Due to charge symmetry breaking, the n-p force and the n-n force are different. CSB is explicitly included in modern NN potentials such as the Argonne AV18 potential. The accuracy in this observable that can be achieved in modern calculations is sufficient to be sensitive to CSB.
It was discovered in the early days of work on nuclear three-body systems that there is an empirical relation between the calculated doublet n-d scattering length and the binding energy of the tri-nucleon system. These so-called “Phillips lines” Phi77 have been shown to be strictly linear for the n-p system, (in which case it is the triplet scattering length that is linked with the deuteron binding energy) and they are approximately linear for n-d scattering. When Phillips lines are plotted for the n-d calculations, the physical triton binding energy (8.48 MeV) intersects the currently accepted doublet value fm Che91 , in excellent agreement with the measurement of Dilg et al. of fm Dil71 . By contrast, a charge-symmetric R-matrix analysis of n-d data conducted by Hale Hal00 at energies up to the three-body breakup threshold gives the preliminary value fm, even though the Dilg et al. measurements were the only ones included in the n-d data set. These results, although preliminary, call into question the experimental values of the n-d scattering lengths, particularly in the doublet spin state. If the value of really is significantly less than 0.65 fm, then the presumably well-understood phenomenology of the Phillips line is thrown into disarray.
The current values of the n-d scattering lengths were determined by measurements performed almost 30 years ago using a neutron gravity reflectometer Dil71 . These measurements were not performed using pure D2 gas samples because the experimental technique required samples in liquid or solid form: they were performed on D2O, SiO2 and Si from which the scattering length for n-d was deduced. This report describes the first high-precision measurement of the n-d coherent scattering length performed using a pure sample. In addition, we chose to pursue a precision measurement of the n-p coherent scattering length. The measurement of should yield a result that is consistent with the world average of other n-p measurements. If it doesn’t then we may have an unaccounted for systematic effect in our measurement. Therefore the measurement of provides a secondary check on possible unknown systematic errors of our method.
We use neutron interferometry to measure the coherent scattering lengths of these gases. Interferometry measures a phase shift which is simply related to the coherent scattering length of the nuclei and is therefore sensitive to a particular linear combination of the scattering amplitudes in the two channels. From an experimental point of view, it is possible to measure this linear combination to much higher precision than one can determine the individual scattering lengths. For example, the coherent scattering length of silicon has been measured using neutron interferometry to the incredible accuracy of %, surely one of the most accurate measurements of a nuclear scattering amplitude ever performedIof98 . The experiment requires neither polarized beams nor polarized targets and is sensitive to the amplitude as opposed to the square of the amplitude that enters into cross section measurements.
The remainder of this paper is organized as follows. Section II outlines results from the theory of neutron optics that are relevant to the interpretation of the measurements. Sections III.1 and III.2 describe the neutron interferometry technique and measurement. Section III.3 covers the gas cell design, which is also chosen to minimize the sample cell phase shift. Section III.4 describes the procedure by which the target cell was aligned on the interferometer to make the measurement insensitive to the large phase shifts introduced by the gas sample cell. Section III.5 presents the phase shift data, uncorrected at this point for various slow changes in gas density. Section III.6 describes the measurements which determine the gas density using the ideal gas law with virial coefficient corrections. Section III.7 shows the measurements which establish the gas composition of the deuterium sample, which has non-negligible HD and H2 contaminants. Section III.8 describes the sample thickness measurements with and without pressurized gas in the cell and presents the last time-dependent correction to the gas density, which removes all time dependence to the phase shift data. Section III.9 outlines the measurement of the neutron wavelength and describes the measurement that establishes its stability over time. Section IV relates our measurement of the coherent scattering lengths of H2 and D2 molecules to the nuclear scattering lengths, outlines the correction to neutron optical theory due to the breakdown of the impulse approximation, presents our final values for the scattering lengths, and compares them with past measurements. Section V describes the comparison of the world’s data on the n-d coherent scattering length to existing theoretical calculations and uses the recently-available high precision calculations of the quartet n-d scattering length in second generation NN potential models to determine the doublet n-d scattering length. It also places the measurements in the n-d system into the wider context of p-d measurements. Finally section VI summarizes our results and their significance and discusses the possibilities for further improvements in the precision of coherent n-p and n-d scattering length measurements as well as the possibilities for high-precision coherent scattering length measurements in n-3He, n-4He, and n-3H systems. Appendix .1 describes in more detail the small corrections to the theory derived by Nowak, to which our experiment is sensitive. Appendix .2 discusses the procedure used to determine the world average using published values of the scattering lengths.
II Neutron Optics Theory
In this section we give a brief review of the relevant results from the theory of neutron optics that are needed to understand precisely how the phase shift measured in the interferometer is related to the neutron scattering lengths of interest. For a more detailed treatment see SearsSearsbook .
Neutron optics is based on the existence of the “coherent wave” which is the coordinate representation of the coherent state formed by the incident wave and the forward scattered wave in a scattering medium. It is determined by the solution of a one-body Schrodinger equation
| (4) |
where is the coherent wave and is the optical potential of the medium. The coherent wave satisfies the Lippmann-Schwinger equation
| (5) |
where is the incident wave, is the one-body Green’s function for nonrelativistic motion of a neutron and is the optical potential. The optical potential is related to the one body matrix by
| (6) |
and this combination forms the usual coupled system of equations of nonrelativistic scattering theory. Given a form for the matrix one can determine the optical potential and then solve the one-body Schrodinger equation for the coherent wave.
One must make an approximation for the matrix of the neutron in a medium of scatterers. The usual approximation is essentially the Born approximation in which and
| (7) |
Finally one must approximate the one-body matrix . Using the impulse approximation for scattering, one gets
| (8) |
Here, denotes the elemental species, is the coherent scattering length for element , is a random spatial coordinate and defines the coordinate of each atom the neutron can scatter from. From Eq. 8 we then arrive at an expression for the optical potential
| (9) |
where is the number density of scatterers.
The effect of the optical potential on the beam for a nonabsorbing uniform medium is to slow down the neutrons as they encounter the potential step due to the matter, thereby decreasing the neutron wave vector, K, within the medium. The neutron index of refraction is defined by this relative change in the magnitude of the wavevector . Conservation of energy at the boundary determines the relation to the optical potential
| (10) |
In general the scattering amplitude is complex to account for incoherent scattering and absorption of the wave amplitude. The imaginary part of the scattering amplitude is related to the total reaction cross section by the optical theorem and leads to the more accurate form of the index of refraction
Here, () is the real (imaginary) part of the index of refraction, is the neutron deBroglie wavelength, is the bound coherent scattering length, and is the total reaction cross section (scattering plus absorption). For typical neutron-nucleus potentials, the real part of is near unity, . In less accurate treatments, the second term in the square root of the real part is omitted. However, its presence is required by the optical theorem and is included here for completeness.
In neutron optics experiments with unpolarized neutrons and unpolarized samples the coherent scattering length is the sum of the scattering lengths in both scattering channels weighted by the number of spin states in each channel. From a quantum mechanical point of view, this is the total amplitude for a neutron to scatter without a change in the internal state of the target. In the forward direction only this amplitude can interfere with the unscattered incident wave. In atomic deuterium with nuclear spin , for example, the coherent scattering length is the weighted sum of the doublet () and quartet () states
| (12) |
and for atomic hydrogen it is the weighted sum of the corresponding singlet and triplet states
| (13) |
Here the superscripts label the number of spin states for each scattering channel. In the next section the relation between the phase shift of the coherent wave in the interferometer and the bound coherent scattering length is derived.
III Experimental Procedure and Results
III.1 Apparatus and basic ideas of neutron interferometry
Scattering length measurements were performed at the National Institute of Standards and Technology (NIST) Center for Neutron Research (NCNR) Interferometer and Optics Facility Ari94 . This facility, situated on cold neutron guide seven (NG7), consists of a perfect crystal silicon neutron interferometer with high phase contrast () and long-term phase stability (C per day). The single crystal interferometer is schematically illustrated in Fig. 1. A monochromatic cold neutron beam ( MeV, nm, ) is diffracted into the facility using a pair of pyrolytic graphite (PG) crystals operated in a non-dispersive double crystal mode using the (002) reflection. This beam is collimated and vertically focused onto the interferometer. The neutron beam is coherently divided in the splitter slab near point A by Bragg diffraction into two beams that travel along paths and . These beams are again split in the mirror slab near points B and C by Bragg diffraction. Two of the wave fields are coherently recombined to interfere in the third Si mixer slab near point D. The perfect single crystal nature of the device ensures the required alignment precision which allows the Bragg diffraction condition to be met by all three silicon slabs simultaneously. In addition, the narrow phase space acceptance of the device is an efficient filter for all incoherent neutron interactions in the silicon, phase shifter, and samples.
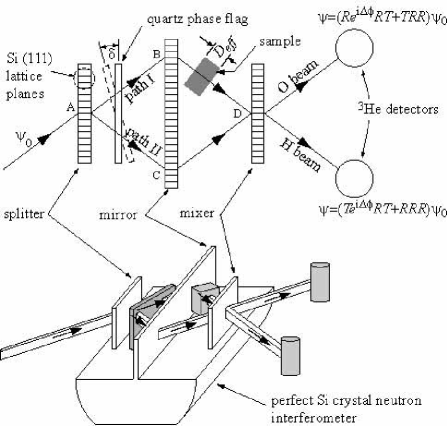
The geometry traced out by this kind of interferometer is commonly referred to as Mach-Zehnder by analogy with similar optical interferometers. Here, however, the splitter, mirror and mixer crystals have been machined from a monolithic Si ingot in which the lower backbone maintains the perfect lattice registry of the original ingot. This avoids the mechanical difficulties associated with permanently aligning separated crystals to tolerances much less than the angular acceptance of a perfect crystal (rad). The interferometer crystal geometry is denoted as a Laue-Laue-Laue (LLL) crystal since there are three transmission Bragg reflecting crystals in the Laue geometry. For a detailed description of neutron interferometry techniques and experiments, refer to the book by Rauch and Werner Werbook .
The relative intensities recorded for the two exit beams, called the O-beam and the H-beam here, depend upon the phase difference of the neutron waves traversing path relative to path . The phase shift that we measure is due to the phase difference of the neutron wave traversing path with the sample in this path relative to its phase with the sample removed. For the samples used in these measurements, the attenuation cross section does not significantly influence the real part of the refractive index. To very high accuracy, the phase shift due to the sample can be written as,
| (14) |
where is the effective neutron optical thickness of the sample medium along the direction of wave propagation. Thus, a measurement of the coherent scattering length to % absolute accuracy demands an absolute measurement of the following quantities at the % level:
(1) the neutron optical phase shift of the gas, ,
(2) the atom density ,
(3) the sample thickness , and
(4) the wavelength .
III.2 Measurement of the molecular H & D gas phase shift
The phase shift, , is measured by a secondary sampling method in which a flat phase shifter plate (denoted as the quartz phase flag in Fig. 1) is positioned between the splitter and mixer blades to intercept both neutron paths. This phase flag has an optical thickness described by
| (15a) | |||||
| (15b) | |||||
Here is the thickness of this quartz flag (1.5 mm), is the Bragg angle of the neutron beam reflecting from interferometer Si (111) lattice planes, and is the rotation angle offset of the phase flag in the horizontal plane.
The intensities of the O and H beams (see Fig. 1) as a function of the phase flag angle, , are referred to as interferograms and can be described by the following relations:
and
Here or is the Si crystal reflection or transmission coefficient, and the parameters , , , , and are extracted from fits to the data. The value of and its corresponding uncertainty is used to determine the phase difference between the two interfering beams.
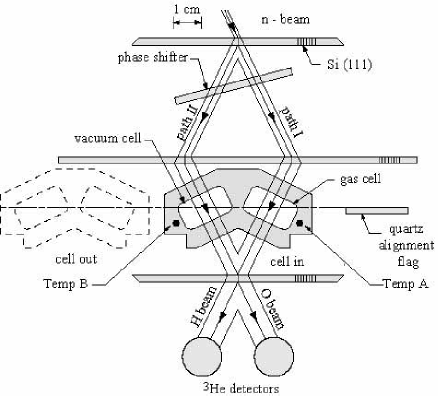
This experiment measures the phase shift when a gas sample is placed into neutron path (see Fig. 2). The gas and sample housing (cell) contribute separate phase shifts, . The effective thickness of the sample depends upon misalignment according to,
| (18) |
where is the true thickness and and correspond to the horizontal rotation and vertical tilt of the sample. The condition and occurs when the beam is incident normally on the sample. In this experiment is measured when the beam is incident normally. In this orientation the phase shift is insensitive in first order to the misalignment angles and . However the phase shift due to the empty aluminum cell is two orders of magnitude larger than the gas. If the cell was present in only one of the interferometer beams, a small unknown misalignment would lead to a large systematic uncertainty in the background phase shift. To minimize this systematic effect a unique design was chosen for the gas sample cell, as discussed in the next section.
III.3 Gas cell design
In order to minimize the phase shift due to the cell, the cell walls were designed to extend across both beam paths to produce compensating phase shifts for paths and . Mechanically this was achieved by machining two gas cells from a single block of aluminum. The design of the cell is shown in Fig. 2. When the cell is perfectly aligned the beams strike both cell compartments perpendicular to their surfaces. This ensures that the effective thicknesses along both paths are nearly equal. The phase shift due to the cell obtained from Eqs. 14 and 18 is,
| (19) |
where and are the cell wall thicknesses along paths and . From Eq. 19 we see that the phase shift along path is opposite that of path so that the total phase shift is minimized when and are equal or nearly equal, as is the case. In this experiment the total phase shift of the cell was first measured before filling with D2 gas to be rad and rad. The two cell phase shift measurements differed by a slight amount due to thin (m thick) film of thermal grease that was present during the the D2 gas measurement, but was removed (with acetone) prior to the H2 measurement. These cell phase shift values are considerably lower than 670 rad, which would have been seen with the cell in only one beam. The relative uncertainty introduced by a 17 mrad () misalignment of the cell is 0.001 %. This is an order of magnitude below the uncertainty goal of this experiment. In practice, it is possible to align the cell in the beam such that both mrad and mrad so that the systematic alignment uncertainty is completely negligible.
III.4 Alignment of the cell
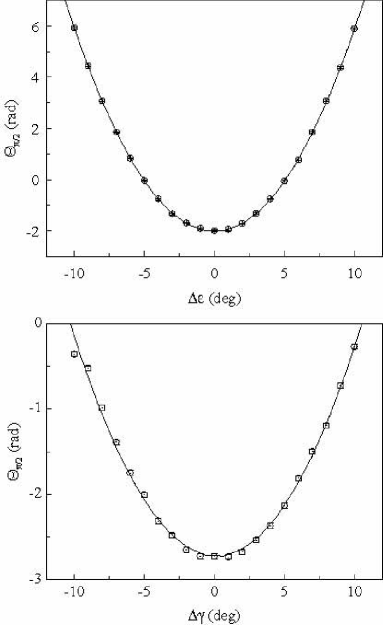
Although the experiment is insensitive in first order to both of the missets and , it is still necessary to actually measure these values. The fact that the cell was designed to be extremely insensitive to changes in these angles introduces some experimental difficulties in actually performing these measurements. Aligning the cell experimentally requires measurement of the cell phase shift as a function of both and . To solve this problem a kinematic mount was designed to allow the cell to maintain the previous alignment and relative to the beam after being removed and replaced. The alignment phase shift measurement was performed using a quartz alignment phase plate that only crossed one beam in order to produce a noticeable phase shift. (See Fig. 2.) This optically flat, 1.5 mm thick quartz plate was mounted on the same flat surface as the cell. The procedure that was used to align the quartz is much the same as the alignment procedure described in Ref. Iof98 and is described below. However, here the sample is rotated by (90∘) relative to the non-dispersive phase shift position discussed in Iof98 .
This method of alignment required that the quartz alignment sample be parallel translated from path to path . Upon translation the horizontal misset angle changes sign ) yielding a difference between the two phase shift measurements of
Note that when is held fixed, Eq. III.4 is a quadratic function of , which means that the center can be accurately determined in order to minimize the misset angle . Similarly Eq. III.4 is a quadratic function of when and is held fixed. Independently varying the tilt for a fixed value of allows the experimental determination of the optimum tilt position for . The experimental measurements of these two alignment parabolas are plotted in Fig 3. All phase shift data were taken with and at their minimum values.
III.5 Data Collection
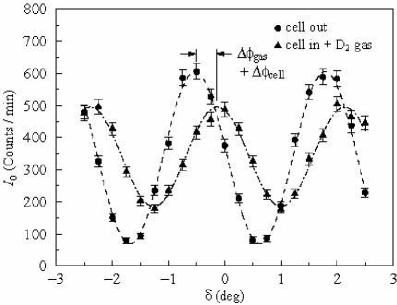
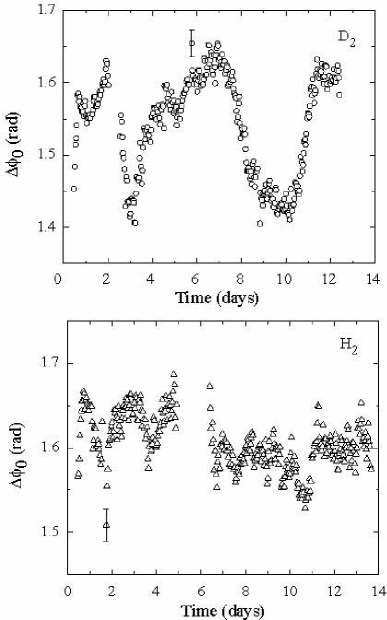
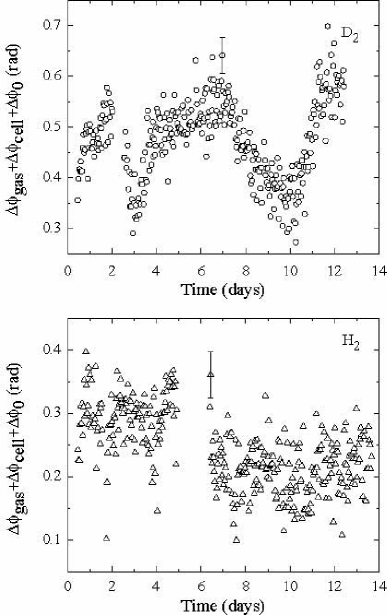
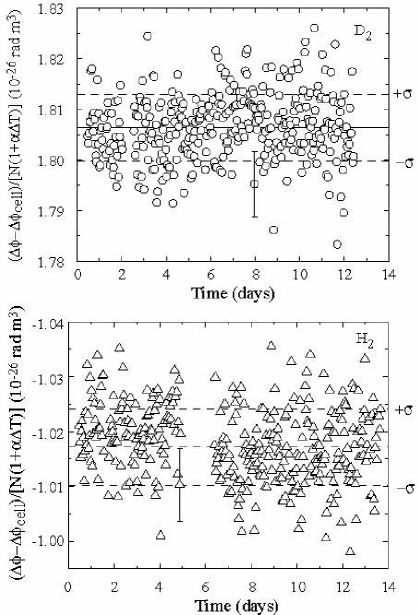
Once the cell mount was aligned using the above technique, the phase plate was replaced by the gas cell on its kinematic mount. The gas chamber on path was then filled with sample gas, while the compensation cell oriented symmetrically on path was evacuated. Interferograms with the cell first in the “cell in” position and then translated to the “cell out” position (see Fig. 2) were collected in order to determine the phase shift due solely to the gas and the small difference in thickness between the two chamber walls of the cell (discussed earlier in section III.3). Each set of interferograms (see Fig. 4) required approximately 42 min to obtain a measurement of with a relative uncertainty of 0.3 %. The two interferograms in Fig. 4 were fitted to Eqs. III.2 and III.2 to obtain the time dependent phase shifts, , shown in Fig. 5. The total phase shifts of the cell, the gas, and the time dependent offset phase shifts, , are plotted in Fig. 6. Since each measurement of was performed within 42 min of the previous one, the time dependence of the phase shift could be directly measured and removed from the total phase shift. The time dependence of the empty interferometer phase shift, discussed later in section III.9, is believed to be due to slight temperature fluctuations that cause small geometric shifts between the two paths of the interferometer. The phase shift values with the time dependence removed are plotted in Fig. 7. The total amount of data taken, 353 runs for D2 and 358 runs for H2, was based on a statistical uncertainty target of 0.02 %.
III.6 Measuring the atom density
To obtain a value for the coherent scattering length from the phase shift data plotted in Fig. 7 using Eq. 14, several additional measurements must be performed and a few time-dependent density changes must be corrected for. First, it is necessary to determine the atom density, , of the gas for each phase shift measurement. To do this we employ the following form of the virial equation for a real diatomic gas given by,
| (21) |
where is the pressure, is Boltzmann’s constant (value taken from Moh00 ), is the temperature, is the second pressure virial coefficient and is the third pressure virial coefficient. (Note that the extra factor of two in Eq. 21 is included to account for the fact that each molecule contains two atoms.) The virial coefficients for hydrogen and deuterium have been measured Mic59 ; Dym80 with sufficient accuracy to determine with a relative uncertainty of 0.001 % (for example: for deuterium bar-1, bar-2 and for hydrogen bar-1, bar-2 at T=297.15 K). The correction to due to is about 0.7 %, which is a significant contribution. The correction due to is about 0.004 % and is included in the calculation of for completeness.
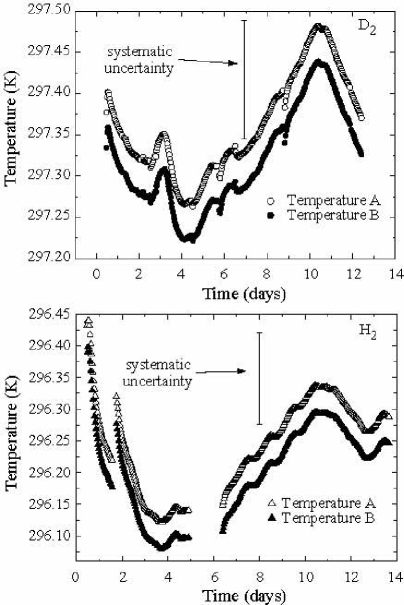
To determine using Eq. 21 both the absolute temperature and the absolute pressure are needed. The absolute temperature of the gas was measured each time that the gas pressure was measured. To determine the absolute temperature, two calibrated platinum resistance thermometers were placed on the gas cell at the positions labelled Temp A and Temp B in Fig. 2. Although these thermometers have a precision of , the electronic readout accuracy was limited to at 300 K. These thermometers were calibrated at NIST by measuring the triple point temperature of pure H2O. Before absolute calibration, probe A reported the triple point temperature as K and probe B reported K, consistent within the absolute accuracy. Since the triple point of pure H2O is the operational definition of 273.15 K absolute temperature, a shift of K was applied to the temperature scales of both thermometers. The small differential nonlinearity of the platinum thermometers allows us to apply the same shift at the 300 K temperature of the measurements. A plot of the temperature variation of the two probes using the original probe calibration curves corrected for the absolute calibration using the triple point is shown in Fig. 8. Note that for both gases the temperature of the two cells was the same to within the absolute accuracy of the thermometry indicating that there is no thermal gradient across the cell. Since the thermal conductivity of the aluminum cell is high and there are no heat sources or sinks other than the surrounding environment the temperature of the gas can be inferred from the temperature of the aluminum cell by assuming thermodynamic equilibrium. The data show there are slow temperature fluctuations: the amplitude of these fluctuations is consistent with the rated temperature stability of the interferometer enclosure.
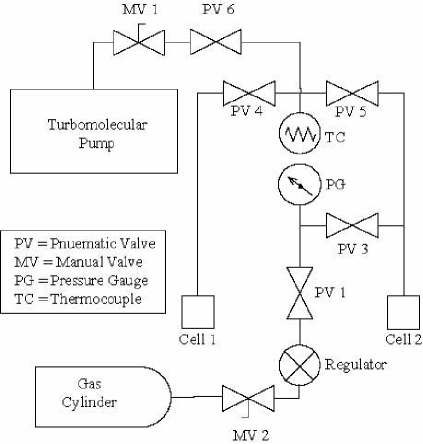
The pressure was measured using a Mensor DPG II model 15000 disclaimer digital pressure gauge. This pressure gauge uses a silicon pressure transducer (SPT), which modifies the output from a precision micro-machined silicon wafer used as a pressure sensor. It was calibrated by the Mensor Corporation disclaimer using a dead weight test with NIST traceable standards. The dead weight test involves putting NIST traceable weights on a piston filled with dry nitrogen. The pressure exerted by the weight can be determined absolutely by knowing the masses and the cross sectional area of the cylindrical piston and compared with the output of the SPT. Calibration measurements with the dead weight established that the SPT readings were repeatable and linear functions of absolute pressure to better than 0.01 % Men00 .
This pressure gauge was directly coupled to the sample cell through a high-pressure gas handling system schematically illustrated in Fig. 9. The top plate of the cell, which connects to the body through an indium o-ring seal, was connected to the gas handling system through two flexible 1 m long gas and vacuum lines made from HiP disclaimer thin stainless steel tubes 1.59 mm OD, and 0.76 mm ID. The thin flexible lines also allowed the cell to be thermally insulated while allowing it to be translated in and out of the interferometer without having to move the gas handling system. All connections in the gas handling system were made with all metal seals to minimize contamination of the sample.
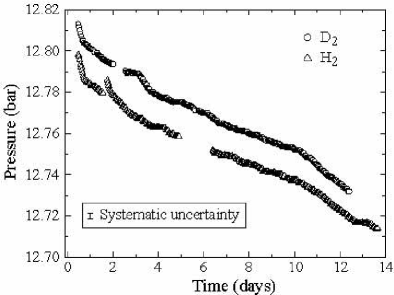
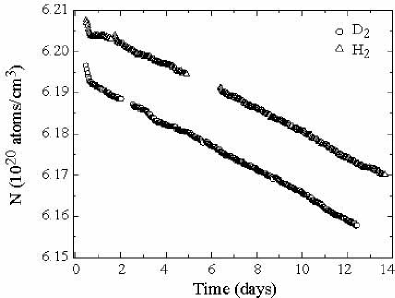
The pressure shown in Fig. 10 decreases with time. This pressure change is not correlated with the temperature change of the cell nor is it due to an external leak into to the system from atmosphere. It is also not due to diffusion of the gas into aluminum: the known rate of diffusion of hydrogen into aluminum is much too slow Ichi92 . This leak appeared only when one cell was evacuated and the other cell was pressurized. The conclusion drawn from this information is that the cell leaked into the evacuated cell from the filled cell through gas valve PV5 in Fig. 9. Although not an ideal condition, the presence of such an internal leak does not compromise the purity of the gas. Also, the evacuated side was continuously pumped during the experiment so that there would not be enough gas in the evacuated section to cause a systematic error in the phase shift measurement. The leak did change the atom density, , at a rate of h-1. However, this slow change was measured and can be corrected for easily in the data analysis. With data for both the temperature and pressure, the time-dependent atom density is calculated from Eq. 21, with the results shown in Fig. 11.
III.7 Gas Purity
The D2 gas used in these measurements was “Research Grade” quality purchased from Air Products disclaimer . The quoted purity from the manufacturer was 99.99 %, but HD and H2 impurities were not included in this analysis. The H2 gas was “Ultra High Purity” purchased from Matheson Tri-Gas disclaimer with quoted purity of 99.999 %.
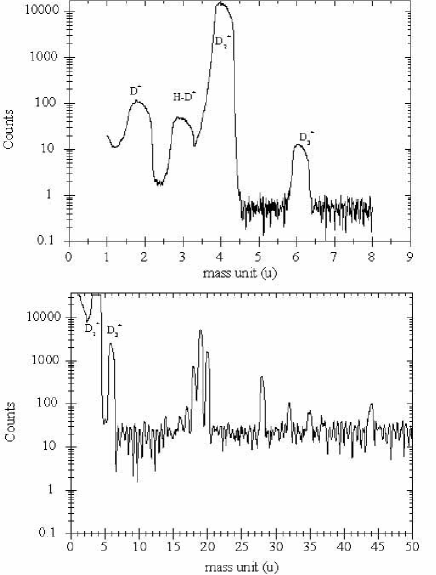
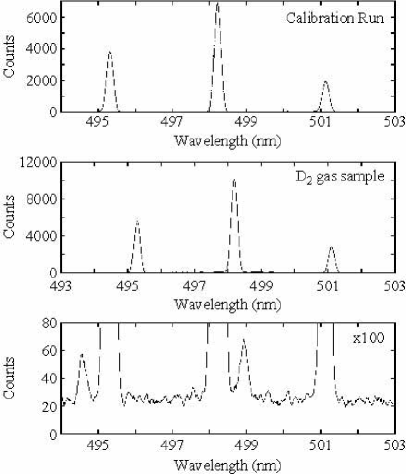
Measurement of the actual impurity species and concentrations in the gas samples used is important to correct the measured value of at the 0.01 % level. To do this both mass spectroscopy and Raman spectroscopy were employed. The mass spectra allowed one to see the contaminating components in the samples as shown for example for D2 gas in Fig. 12. From the data, the main contaminants found in the D2 gas were HD at 0.3 % and D2O at a 0.02(1) % level. However, the relative ionization efficiencies of HD and D2 are not known for the mass spectrometer used in this measurement. Therefore, to measure the HD concentration to better than 5 % accuracy, Raman spectroscopy was used Comp93 .
Raman spectroscopy measures the amount of light scattering from the rotational levels of HD and D2, which are shifted due to the isotopic mass difference. Measurements were made using the apparatus described in Ref. Liu02 . The spectrometer was first calibrated with a known 2 % HD sample (see Fig. 13a). Next, the D2 gas was introduced into the apparatus and rotational spectra were taken (Fig. 13b,c). From this data the mole fraction of HD was determined to be . The accuracy (4 %) of this measurement was limited by the sample pressure and in principle could be lowered to 1 % with minor changes.
With the Raman data for HD it is then possible to calibrate the mass spectrum data in order to determine the amount of other contaminants relative to D2. The mole fractions of D, H, and O were inferred to be , , and . The final expression for , corrected for impurities, was obtained using the following relation:
| (22) |
where fm and fm Koe91 were used.
III.8 Sample thickness
Measurement of the sample thickness was performed using the NIST Precision Engineering Division Coordinate Measuring Machine (CMM) Stoup . This device is a temperature controlled coordinate measuring apparatus capable of measuring macroscopic distances with an uncertainty of 250 nm within a 98 % confidence interval. This measurement showed that the thickness of the gas filled chamber of the cell was uniform at the 0.01 % level and that the cell was cm thick at an absolute temperature of C. Variation of the temperature resulted in a systematic change in the thickness at the 0.01 % level during the scattering length measurement. Using the coefficient of linear expansion for aluminum CRC , this variation was taken into account in order to obtain the ratio , where is the difference between the temperature measured in the experiment and the temperature at which the cell dimensions were measured by the NIST CMM. This ratio is plotted in Fig. 14 from which a mean value and a standard error of the mean was calculated.
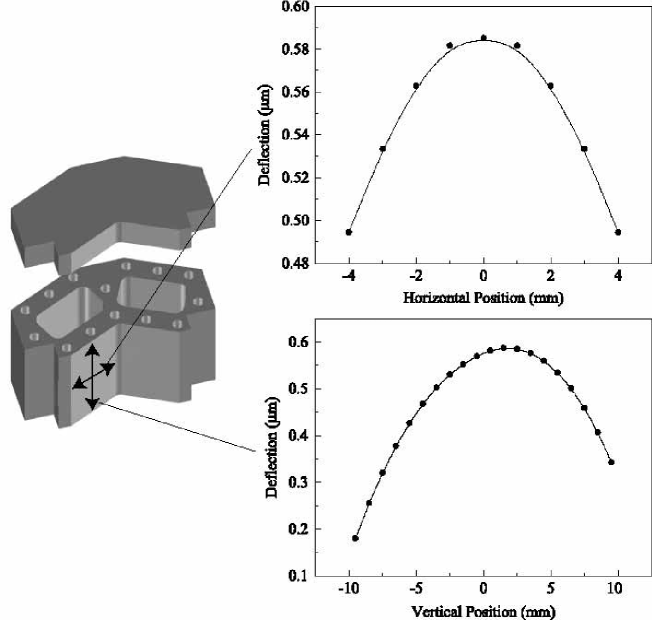
Dimensional changes in the cell also occurred when the cell was pressurized to bar, which caused the walls to flex slightly outward. An upper limit for this effect was determined by both measurement using a Mitutoyo indicator disclaimer with 1 m resolution and calculation using finite element analysis (see Fig. 15). Both calculation and measurement confirmed that this flex resulted in a change in thickness at the center of the cell of less than 1 m, which amounts to a systematic effect on the thickness of less than 0.01 %.
The fact that the time dependence of the measured phase shifts shown in Fig. 14 has disappeared after all the known time-dependent effects on the gas density are accounted for is a nontrivial result. The odds that other time-dependent effects not accounted for are present and conspire to cancel are very low, and there are no plausible physical mechanisms for other time-dependent effects on the phase shift beyond the ones mentioned so far (time-dependent wavelength shifts were eliminated as a possibility as described in the next section). Since the coherent scattering length being measured is a time-independent constant, establishing the time-independence of the phase shift is a necessary condition for a valid measurement.
In addition, the statistical spread of the measured phase shifts is consistent with that expected based on Poisson statistics and the statistical accuracy of the individual phase shift measurements based on neutron counting statistics. This confirms that there are no unknown sources of noise present in the measurement and places further indirect constraints on possible interfering influences on the data.
III.9 Measuring
The wavelength was measured using an analyzer crystal in the H-beam of the interferometer shown in Fig. 1. Rotating the analyzer crystal through both the symmetric and the anti symmetric Bragg reflections allows the absolute Bragg angle, , to be determined, and thereby the wavelength, using Bragg’s law, , where is the lattice plane spacing of the crystal. Analyzer crystals of both pressed Si and pyrolytic graphite (PG) were used to determine . Silicon is ideal since the lattice constant is known with an uncertainty much lower than our requirement of 0.01 %Bas94 . The Si crystal was used at first along with the PG crystal to allow the PG lattice constant to be measured. The PG crystal was mounted kinematically to the interferometer setup to ensure that the neutron beam was always sampled by the same part of the PG crystal. Therefore each measurement of the wavelength is correlated with the original measurement performed using silicon.
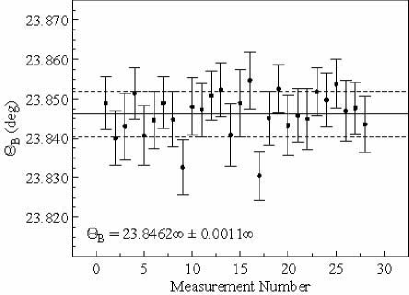
The crystal was rotated about the vertical axis to locate the two angles where the Bragg condition is satisfied. This condition is manifested as a dip in the transmitted beam measured in the 3He detector. These rocking curves (intensity versus angle) are fitted to Gaussians to determine the centroids of the dips (Fig. 16). The wavelength, obtained from the angle was determined from the angular difference between the centroids. By performing measurements of the angle with both Si and PG with the same neutron wavelength the lattice constant of PG can be calibrated relative to that of Si.
For the Si measurements it was necessary to include an additional linear term in the fit to account for a changing background due to a parasitic Bragg reflection of reciprocal lattice points that lie near the Ewald sphere of reflection. This effect does not appear in the data for PG since the lattice of PG is randomly oriented about the hexagonal c-axis. (This random orientation effectively makes the reciprocal lattice of the PG crystal one-dimensional.)
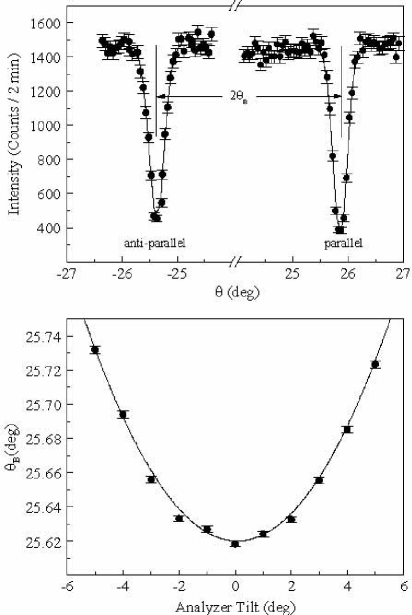
The measurement of the angle is also sensitive to the relative tilt between the interferometer lattice planes and the analyzer lattice planes. In order to align the analyzer crystal, measurements of were performed for various tilt angles of the analyzer lattice planes. The functional form of plotted versus the tilt angle is a parabola (see Fig. 16) with a minimum corresponding to the condition that the lattice planes of the analyzer crystal are perpendicular to the scattering plane of the interferometer. This method allows to be determined with an uncertainty of 0.001 %. The resulting value for , determined from the data shown in Fig. 17, was found to be nm for the D2 gas experiment and nm for the H2 gas experiment. These two numbers differ slightly at the 0.01 % level due to minor changes in the mechanical configuration of the apparatus between the experiments. These changes were due to the need to remove the cell between the measurements.
Not only is it necessary to know the mean value of the wavelength of the beam passing through the interferometer, but it is also necessary to ensure that this value does not change during the course of the experiment. Unlike the temperature and pressure measurement the wavelength was measured only twice during the experiment for practical reasons. To prove that the time-dependent phase drift described previously was not due to time-dependent wavelength changes a thick aluminum sample was placed in the beam which amplified the phase shift in the interferometer by a factor of 100, thereby amplifying any fluctuations in the phase due to possible wavelength changes by the same factor. The result of this test showed that as long as no mechanical changes in the experimental configuration have been made, the long-term stability of the wavelength is better than 0.001 %. This means that, within limits of the statistical uncertainty, the phase drift is due to temperature fluctuations and not due to a drift of the wavelength.
IV Results for and
All of the measurements required to calculate the coherent scattering lengths in H2 and D2 gas are now determined. It remains to relate the coherent scattering lengths of the molecules, , and , to the coherent scattering lengths of the nuclei, , and .
The general expression for the low energy neutron scattering length of an atom away from nuclear resonances for unpolarized atoms and neutrons is
| (23) |
where is the scattering amplitude due to the neutron-nucleus strong force, is the neutron-electron scattering amplitude due to the internal charge distribution of the neutron, is the Mott-Schwinger scattering due to the interaction of the magnetic moment of the neutron with the magnetic field seen in the neutron rest frame from electric fields, is the scattering amplitude due to the electric polarizability of the neutron in the intense electric field of the nucleus, and is the charge form factor (the Fourier transform of the electric charge distribution of the atom). We first note that the electromagnetic contribution to the scattering lengths of both hydrogen and deuterium from and are exactly zero for forward scattering due to the neutrality of the atoms, which forces the charge form factor as Searsbook . In addition, the contribution from the electric polarizability of the neutron for both H and D is less than fmSch91 and is therefore negligible. Thus this measurement is sensitive only to that part of the scattering length due to the strong interaction, which is precisely what can be calculated using theoretical models of the NN interaction. Although there are in principle additional contributions due to local field effects that arise from multiple scattering in the medium and its modification of the amplitude of the incident waves on the scattering centers, these corrections are completely negligible for gases and only reach the level in solids and liquidsSearsbook . Therefore both our measurement, and the most accurate of the past measurements, measure the same physical quantity and therefore can be directly compared to each other as well as to NN theory.
A summary of the parameters discussed in the previous section are given in Table 1. Using these values as input to Eq. III.4 we obtain the average molecular bound coherent scattering length per atom for deuterium of fm and for hydrogen of fm.
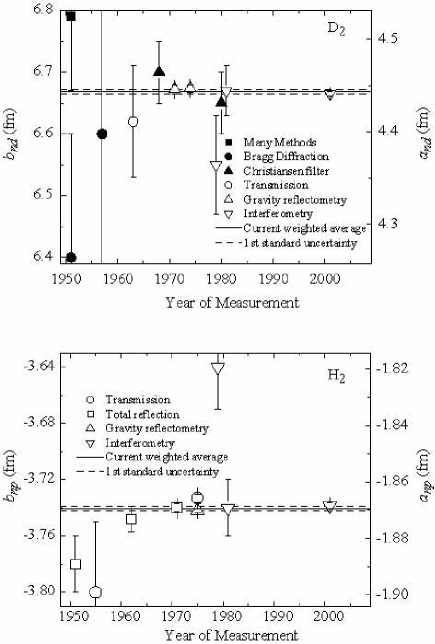
To compare this result with other measurements we must calculate an average value from the previous world values of the and bound nuclear coherent scattering lengths. The details of this calculation are left to Appendix .2 and the result of this evaluation shown in Fig. 18 is fm and fm. Our result differs from the average of previous measurements by for H and for D.
| Parameter | Value(D2) | Relative (D2) | Value(H2) | Relative (H2) |
| 13.64 rad | -4.9192 rad | |||
| 2.4794 rad | 1.3788 rad | |||
| 0.271266 nm | 0.271305 nm | |||
| Temperature | see data | see data | ||
| Pressure | see data | see data | ||
| 1.0016 cm | 1.0016 cm | |||
| rad m3 | rad m3 | |||
| x D2 | 0.9968 | 0.0000 | 0.0000 | |
| x HD | 0.0030 | 0.043 | 0.0000 | 0.0000 |
| x D2O | 0.00020 | 0.5 | 0.0000 | 0.0000 |
| x H2 | 0.0000 | NA | 1.0000 | |
| x H2O | 0.0000 | 0.0000 | 0.0000 | 0.0000 |
| 6.6649 | 6.0 | -3.7458 | 5.3 | |
| 0.0000 fm | 0 | 0.0070 fm | 0 | |
| 6.6649 | 6.0 | -3.7384 | 5.3 | |
| 6.6727 | 6.7 | -3.7410 | 2.7 | |
| 6.6683 | 4.5 | -3.7405 | 2.5 |
This comparison is not yet complete since there remains one class of effects, which although not generally taken into account in past measurements, can in principle be large enough to introduce a nontrivial correction in the usual relation between the scattering length of the molecule and the scattering lengths of the constituent atoms. In 1982, Nowak Now82b revisited the approximations inherent in the use of the Fermi pseudopotential to describe the refractive index, , for neutrons, which had first been investigated by Lippman Lip50b and was the first application of the Lippmann-Schwinger formulation of scattering theoryLip50a . Nowak came to the conclusion that the static local field corrections Searsbook were of the order of , in agreement with Lax’s earlier estimates Lax52 . However, he found that dynamic effects due to virtual excitations to the low lying states, within second order perturbation theory, make a relative contribution of order to . The effect is most pronounced for light target molecules such as H2 and presumably for this reason have rarely been taken into account in n-p coherent scattering length measurements, most of which involve measurements in which the hydrogen is bound in hydrocarbons. (These corrections are also mentioned in the n-p parahydrogen cross section measurements of Callerame Cal75 , which is one of the measurements used to determine the n-p scattering length.) The lowest lying excitations of the molecule are rotational states, , where is the molecule’s moment of inertia. For H2, meV; the vibrational energy levels are separated by 546 meV. Nowak carried out a detailed numerical calculation of this dynamic correction, finding it to be a relative correction of . A later estimate by Summerfield Sum84 agrees with this conclusion. Nowak also calculated the correction to due to multiple scattering of the neutron within the H2 molecule. This leads to a relative correction of about . Both of these corrections are spin-dependent so that the para- and ortho-states of the H2 molecule must be considered separately. The absolute correction to the scattering length calculated from the sum of these two relative corrections is fm fm, which is consistent with the difference between our neutron interferometry measurement of and the previous world average calculated using . This previous world average includes results from reflectometry measurements of hydrocarbon liquids. It is presumed that the measurements of for hydrogen bound in a hydrocarbon sample will not need to be corrected for multiple scattering or virtual excitations due to the inverse molecule mass dependence of the effect.
This measurement of by neutron interferometry on H2 gas may therefore be regarded as the first observation of the corrections to the index of refraction due to virtual excitations and multiple internal scattering within a molecule as predicted by Nowak 20 years ago. This conclusion must be regarded as tentative at this point, since the calculation of Nowak was done in the long wavelength limit ( = bond length of H2 = 0.74611 nm, for D2 = 0.74164 nm CRC ). We are currently performing a calculation for the conditions of our experiment, which correspond to =1.73.
If we apply the existing Nowak correction to our H2 data, our result for the coherent n-p scattering length is fm. Taking this value we calculate the new world average value to be fm, (our result lies within of the average). The Nowak correction is expected to be much larger for H2 than for D2 due to the fact that there is a sign difference between the singlet and triplet scattering lengths of hydrogen, which results in an amplification of the correction to the scattering amplitude given by Eq. 26. The consequence of this sign difference is most prominently seen in the the incoherent scattering cross section of hydrogen, which as a consequence is disproportionately larger than the incoherent scattering cross section of deuterium. Therefore, we do not make a similar Nowak correction to the D2 data. With this uncorrected value of we arrive at a new weighted average of fm (our result is within of the average value). Our results are consistent with past measurements conducted decades earlier by completely different methods.
V Comparison to Theory and Implications for Three-Body Forces
We propose to show in this section that the physics impact of these coherent scattering length measurements in the n-d system are greater than has been recognized in the theoretical few body community. The reason is simple: rather than compare theoretical calculations to the coherent scattering lengths, which are measured to high precision, theorists in the field have instead compared their results to the scattering lengths in each of the two channels individually despite the fact that these are known with a precision that is lower by an order of magnitude.
To illustrate the impact of comparing theoretical calculation to the precision data on the coherent scattering length, which has actually existed now for decades, we show several modern calculations of the scattering lengths in the p-d and n-d systems, some of which include a three-nucleon force. The dependence of the theoretically calculated 2S1/2 scattering length on the inclusion of a 3N force is clearly seen in Table 2, which gives the n-d and p-d doublet and quartet scattering lengths (in fm) calculated with a number of different potential models. The results in boldface come from models in which the 3N force has been adjusted to replicate the trinucleon binding energy.
| Ref. | Potential | |||||
|---|---|---|---|---|---|---|
| model | [fm] | [fm] | [fm] | [fm] | [fm] | |
| Fri83 | Yukawa | -3.6 | 13.6 | -2.1 | 6.39 | 5.34 |
| Exponential | -7.6 | 13.4 | -6.4 | 6.44 | 3.24 | |
| MT I–III | 0.15 | 13.8 | 0.70 | 6.44 | 6.79 | |
| Fri84 | RSC-5 | 2.23 | — | 1.76 | — | — |
| AV14 | 1.42 | 13.57 | 1.35 | 6.38 | 7.06 | |
| SSCC | 1.35 | 13.67 | 1.32 | 6.41 | 7.07 | |
| RSC-5111for this potential, the 3S-wave NN potential has been adjusted to replicate the trinucleon binding energies | 0.06 | — | 0.60 | — | — | |
| Che91 | RSC | 1.569 | 13.55 | 1.52 | 6.302 | |
| RSC+TM3NF | -0.509 | 13.568 | 0.393 | 6.308 | 6.505 | |
| AV14 | 0.967 | 13.764 | 1.200 | 6.372 | 6.972 | |
| AV14+BR3NF | -1.133 | 13.764 | 0.001 | 6.378 | 6.378 | |
| RSC+TM3NF | 0.0 | 13.52 | 0.66 | 6.30 | 6.63 | |
| AV14+BR3NF | 0.0 | 13.76 | 0.57 | 6.38 | 6.67 | |
| Ber86 | Yamaguchi | 0.257 | 13.68 | 0.656 | 6.27 | 6.60 |
| Che89 | MTI–III | 0.17 | 13.8 | 0.71 | 6.43 | 6.79 |
| Kie94 | MTI–III | 0.003 | 13.96 | 0.702 | 6.442 | 6.793 |
| AV14 | 0.954 | 13.779 | 1.196 | 6.380 | 6.798 | |
| Kie97b | AV14 | — | — | 1.189 | 6.379 | 6.974 |
| AV14+TM3NF | — | — | 0.5857 | 6.371 | 6.664 | |
| Kie95a | AV14+BR3NF | -0.178 | — | 0.575 | — | — |
| AV18+UR3BF | -0.022 | — | 0.626 | — | — | |
| Kie97a | 0.024 | 13.8 | — | — | — |
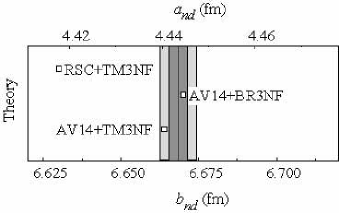
In addition, the values of the coherent scattering lengths from Table 2 are plotted in Fig. 19 along with the world average value for with and confidence bands. We note that, as expected, none of the theories which do not incorporate a 3N force of some sort come close to matching the n-d coherent scattering length. Of the potential models that include a 3N force of some type, only the AV14 potential with the Brazil 3N forceChe91 and the AV14 potential with the Tucson-Melbourne 3N forceKie97b are in agreement with the data. The AV18 potential with the Urbana 3N force, the AV14 potential with the Brazil 3N force, the Malfliet-Tjon-III potential, the Reid soft-core+Tuscon-Melbourne 3N force, the Reid soft-core adjusted to fit the triton binding energy, and none of the other potential models which include the Brazil 3N forceChe91 ; Kie94 are in agreement with the data on the n-d coherent scattering length or, in cases where there is no separate calculation of the quartet n-d scattering length, in agreement with the doublet n-d scattering length derived below. This indicates that the precision with which the coherent n-d scattering length is known sets a tight constraint on NN potential models and, in our view, ought to be considered as automatically as is the value of the triton binding energy when such potentials are compared to the low energy observables. With the new result of the analysis of n-d scattering in chiral effective field theoryEpe02 including chiral 3N forces which shows that only two low energy parameters are required at NNLO order (surprisingly none are required at NLOKol94 ), the question of which observables to use to fix these low energy constants becomes timely. We believe that the best two low energy observables in the n-d system to determine these low energy constants are not the triton binding energy and the doublet n-d scattering length but rather the triton binding energy and the coherent n-d scattering length.
We can also use the coherent scattering length data in combination with theoretical calculations of the quartet scattering length to infer the doublet scattering length with significantly higher precision than the currently quoted value of (expt)) fm. As is well-known, the quartet scattering length is mainly sensitive to the well-known long-range components of the NN interaction due to pion exchange, which are fixed by measurements of the s-wave component of the deuteron wave function. So the results of NN model calculations should give the same answer for this channel to high accuracy independent of the details of the short-range components of the NN interaction where 3-body forces start to manifest themselves. Then this procedure can be used to more tightly constrain the short-range interactions, including 3-body forces, which must be introduced to agree with the triton binding energy and to calculate the doublet scattering length.
Table 3 shows calculations of the quartet n-d scattering length using a new class of potentials which provide good fits to the NN databaseFri00 . We observe that all of these results fit within a range fm. If we accept this average and range as a fair representation of the precision with which modern NN potentials can calculate , then we can combine this result with our measurement of the coherent scattering length to obtain the following value for the doublet scattering length: (expt) (theory)) fm. Compared with the direct measurement (expt)) fm, we see that this approach can improve on the precision of our knowledge of the doublet n-d scattering length by a factor of 4.
| Potential | |
|---|---|
| N93Sto94 | 6.346 |
| NIIFri93 | 6.343 |
| RSC93Sto94 | 6.353 |
| CDBMac96 | 6.350 |
| AV18Wir95 | 6.339 |
| Chiral PTBed98 | 6.33 |
At this point it would also be interesting to compare these new results with the scattering lengths in the p-d system. Unfortunately, there are at present no currently accepted values for the low energy p-d scattering lengths. The analysis of Black et al., did reproduce some of the theoretically predicted energy dependence of the p-d 2S1/2 effective range function–a singularity near threshold–but the singularity was located at higher than expected energies and did not match the theoretical values within quoted uncertaintiesBla99 . None of the other experimentally determined values for this parameter were even close to the calculated values, and the effective range functions did not display the expected pole. For the p-d case, the conflict between theory and experiment persists whether or not 3N forces sufficient to correctly bind 3He are added to the potential.
VI Conclusions and Further Work
We have performed high precision measurements of the coherent neutron scattering lengths of gas phase molecular hydrogen and deuterium using neutron interferometry. We find fm and fm. Our result for H differs from the world average of previous measurements, fm, by fm, which is accounted for by the Nowak correction. Our result for the n-d coherent scattering length is in agreement with the world average of previous measurements, fm. We feel that the precision of these results has yet to be properly appreciated. We note that calculations of the doublet and quartet scattering lengths of the best potential models show that almost all known calculations are in disagreement with the precisely-measured linear combination corresponding to the coherent scattering length. Combining the world data on with the modern high-precision theoretical calculations of the quartet n-d scattering lengths recently summarized by Friar et al., we deduce a more precise value for the doublet scattering length of (expt) (theory)) fm. This value is a factor of 4 more precise than the previously accepted value of (expt)) fm and is in agreement with the Argonne AV18 potential with a 3N force.
We hope that this work will contribute to the extensive theoretical and experimental efforts now underway to understand the nuclear 3-body force. When possible, we urge theorists who calculate both scattering lengths in the n-d system to compare to the precisely known coherent scattering length in addition to the lower-precision values of the separate scattering lengths. In trying to use the n-d system to constrain possible forms of the 3-body force this procedure should be more sensitive. In particular, we hope that the n-d coherent scattering length and the triton binding energy will be used to constrain the two NNLO low energy constants that model 3N forces in chiral effective field theory.
It would of course be very useful to have another precision measurement in the n-d system which is sensitive to a different linear combination of scattering lengths so that both scattering lengths could be extracted from experiment alone with high precision. Performing a interferometry measurement with a polarized D2 target of sufficient density to operate stably in a neutron interferometer seems impractical at the moment due to the cryogenic and high magnetic field requirements needed to make polarized D2. Although polarized D2 gas targets using spin-exchange optical pumping are under development, the densities reached so far are still too low for a precise neutron interferometer experimentRholt . One possibility is to perform a measurement of the pseudomagnetic precession of polarized neutrons in a polarized D2 target. Such a measurement determines a phase shift proportional to the difference in the scattering lengths. Recently such a high-precision measurement was performed with polarized 3He at the ILLZim02 . It would be very interesting if it were possible to adapt the elegant neutron spin precession measurement technique used by Zimmer et al. in this measurement to the case of polarized D or H.
Another natural question to ask is how the current measurements can be improved if more neutron flux with a neutron interferometer were to become available. The absolute measurement of the gas density can be improved by at least an order of magnitude before one needs to worry about the accuracy of the virial coefficients. A skew symmetric interferometer with 10 cm beam paths could be constructed that would allow the sample cell path to be increased by nearly an order of magnitude reducing the relative dimensional uncertainty by that amount as well. Designing the interferometer to work at a longer wavelength of 0.38 nm would also increase the sensitivity by a factor of 1.4. Measurement of the HD contamination of the gas in the case of D2 could be improved from 4 % relative uncertainty to 1 %. With all of these improvements taken into account the uncertainty can in principle be reduced by nearly an order of magnitude.
Finally it is worth noting that the last decade has witnessed exciting advances in the accuracy of calculations in few-body nuclei. Therefore it is possible now to envision the accurate calculation of low energy neutron scattering lengths for systems with . The next most interesting systems to measure are clearly 3H, 3He, and 4He, and as room temperature gases all the techniques described in this paper are applicable to them. In a future paper we will present results of a precision measurement of the n-3He coherent scattering length, which in combination with the recent measurement of the scattering length difference in the same nucleus will be used to determine separately the scattering lengths in both channels. This should improve the accuracy of our knowledge of low energy scattering observables in the 4-body system by an order of magnitude. It would also be possible to improve the current measurements of the coherent neutron scattering length of tritium. Again the motivation would need to come from theoretical developments in the 4-body problem.
Any NN potentials that correctly describe the two and three-body systems, even if a three-body force needs to be added, must predict correctly the n-3He scattering length with no adjustable parameters. A deviation would indicate either the presence of four-body forces (but these are believed to be even smaller than three-body forces on theoretical grounds) or a distortion of the NN interaction in the nuclear medium. Recent theoretical calculations exist for the n-3He systemKie98 .
VII Acknowledgements
We would like to thank the NIST Center for Neutron Research for support and use of the neutron facilities during this experiment, Los Alamos National Laboratory for the use of the Raman Spectroscopy facilities, Philip Lawson for translating a paper for us from German, and Dr. William Dorko of the NIST Analytical Chemistry Division for assistance with the mass spectroscopy measurement of the gas sample composition.
This work was supported by the U.S. Department of Commerce, the NIST Ionizing Radiation Division, the Department of Energy, the National Science Foundation Grant No. PHY-9603559 at the University of Missouri, and National Science Foundation Grant No. PHY-9602872 at Indiana University.
Appendix
.1 Corrections to the Impulse Approximation used in Neutron Optics and Consequences for High Precision Scattering Length Determinations
We have chosen to describe in some detail the assumptions of the usual theory of neutron optics in section II because we need to consider an effect which violates some of the approximations which underly this formalism. The approximation fails in two places: in Eqs. 7 and 8, due to effects from atomic binding and multiple scattering respectively.
To understand the effects of atomic binding, it is worth recalling the approximations which underly equation 8. Since the neutron-nucleus interaction is much stronger and much shorter range than the binding forces of the atoms in matter, it is reasonable to neglect the effects of chemical binding during the neutron-nucleus collision. In addition, the short-range of the interaction means that the timescale of the collision is much shorter than the timescales associated with the motion of the atom in the potential well. For both of these reasons, the operator is usually approximated by the operator for a free atom. This is known as the impulse approximation in scattering theory.
In this approximation, the neutron optical properties of a medium depend only on the coherent scattering length of the atoms and not at all on the details of the binding of the atoms. This independence from the medium has been exploited for decades in precision measurements of neutron coherent scattering lengths, which have typically been determined by measurements in mixtures and compounds chosen for their experimental convenience. As a matter of principle, however, at some point this approximation will no longer be valid and binding effects will need to be taken into account. When this regime is reached, it will be necessary to know enough details about the atomic binding to calculate their effects on the optical potential. It is our assertion that this regime has now been reached in our experiment.
The calculation of corrections to the impulse approximation for neutron scattering lengths was plagued for decades by the singular nature of the delta function potential for the matrixLip50b ; Lip50b ; Bre47a ; Bre47b ; Sum64 . However in a series of papersNow82b ; Die81 ; Now82a manifestly divergence-free expressions for the first-order corrections to the impulse approximation were finally obtained which are consistent with the optical theorem and reduce in appropriate limits to previous results in the limit of static scatterersSea82 . As an example, the case of a nucleus of mass in an atom bound in a harmonic oscillator potential, the first-order correction to the impulse approximation was evaluated analyticallyDie81 with the result
| (24) |
where is the scattering amplitude, is the ratio of the nuclear mass to the neutron mass, is the bound scattering length, and is the average amplitude of the oscillator in the ground state
| (25) |
with the oscillator frequency. The scale of the correction is set by the ratio of the scattering length (a few fm) to the vibration amplitude of the atom (0.1 nm or so), which is small and typically neglected in neutron optics theory. However, since the size of this correction is a decreasing function of , it is largest for H and D. In the particular case of a bound proton the scattering amplitude becomes
| (26) |
where and are the triplet and singlet n-p scattering lengths and the numerical factor of comes from evaluating the integral. The factor multiplying the expression is the usual coherent scattering length for hydrogen. For the particular case of hydrogen, where fm and fm, the size of the correction term is anomalously large from the small denominator, for a typical atomic oscillation amplitude of nm.
However there is another effect of the same order of magnitude that must be taken into account associated with intraparticle multiple scattering. In Eq. 7 the matrix of the bound system of scatterers is expressed as the sum of the (impulse approximation) one-body matrix. But this is known in exact treatments of scattering theory to be an approximationGol64 . The next order of approximation for the matrix of the system is
| (27) |
where is the Green’s function. Therefore the operator for the system to second order is not the sum of the operators for the individual particles due to interparticle multiple scattering. So to calculate the full operator of the system, which is what is required to obtain the optical potential in Eq. 4 one must take multiple scattering also into account. Then finally the optical potential, which is now a function of the neutron momentum, must be solved from Eq. 6 and inserted into Eq. 10.
NowakNow82b performed this calculation to obtain the modified expression for the index of refraction
| (28) |
and two correction terms at second order: one from the binding potential
and the other from multiple scattering
and
| (31) |
In these equations is the number density of scatterers, and are the wave vectors of the incident and in-medium neutrons (very close to identical for cold neutrons), is the (spin dependent) scattering length operator of atom , and the averaging is the usual trace over spins and internal states of the scattering system. These expressions are related to (but not identical with) the well-known dynamic structure factors defined in the theory of thermal neutron scatteringMar71 and make it clear that the second order approximation to the optical potential is a function of the dynamics and correlations of the scattering medium.
From this expression we can understand why the multiple scattering correction to the optical potential is especially large for the case of H and D gas molecules and much smaller for hydrogen atoms embedded in the large polyatomic molecules that have been used for the most precise n-p and n-d coherent scattering length measurements in past work in liquid. First of all, the multiple scattering term vanishes if the nuclei in the polyatomic molecule possess uncorrelated nuclear spin directions and uncorrelated relative motions, which is true to an excellent approximation. From a physical point of view, multiple scattering from uncorrelated nuclei cannot contribute to coherent scattering. By contrast, as is well-known, the spins of hydrogen and deuterium molecules are tightly correlated as a result of the identical particle constraints, and the relative motions are perfectly correlated for isolated molecules by the conservation of momentum. Therefore the multiple scattering correction will be much larger for H and D molecules than for larger polyatomic molecules.
In addition, one can see that the size of this effect will be larger for hydrogen than for deuterium. In addition to the effect of the larger mass, deuterium has a smaller ratio of incoherent to coherent scattering, and as one can see from Eq. 26 the effect is proportional to this ratio, which is anomalously large for hydrogen.
The expression for the dynamic structure factor in the corrections calculated by Nowak can be evaluated exactly for hydrogen and deuterium gas in thermal equilibrium in the rigid rotor approximation.Mar71 The calculation draws on the work of Young and KoppelYou64 on the dynamic structure factor for neutron scattering from hydrogen and deuterium molecules. The rigid rotor approximation is known to be an excellent approximation for slow neutron scattering in hydrogen and deuterium. Since the neutron energy is too low to excite the first vibrational level only transitions to rotational states need to be taken into account. These detailed calculations are presently in progress.
.2 Calculating the world scattering length average
We consulted the existing compilations of previous measurementsKoe91 ; Rau00 for which we found the measurements of the coherent scattering length of hydrogen Cal75 ; Bur51 ; Squ55 ; Dic62 ; Koe71 ; Koe79 ; Kai79 ; Ham81 and deuteriumDil71 ; Kai79 ; Ham81 ; Hur51 ; Shu51 ; Wor57 ; Gis63 ; Koe68 ; Nis74 ; Koe80 . We excluded all measurements that were not published in a refereed journal and all measurements that were later retracted for hydrogenKoe67 ; Koe75 and for deuteriumNik55 ; Bar63 ; Bar68 ; Cop69 ; Gra79 ; Mei85 with the exception of Ref. Koe79 , which updates a previous value reported in Ref. Koe75 for isotopic purity. Although the result of Bartolini et al.Bar68 was never formally withdrawn it was excluded here due to the fact that the result was from the world average. The value quoted by Bartolini et al.Bar68 was due to a reanalysis of the H2O content of the sample used 4 years prior in Ref. Bar63 . This large discrepancy was also discussed by Dilg et al.Dil71 , and Nistler Nis74 who found this result to be inconsistent. In addition, there were two measurements of the ratio of the bound coherent scattering lengths of hydrogen and carbon whose originally reported uncertainties could be lowered by a factor of 2 as a result of subsequent precision measurements of the bound coherent scattering length of carbon, which is now known to be fmKoe75 . Including this new value for with the measurement of Dickinson et al.Dic62 of fm gives fm for which permission was obtained from one of the coauthors Pas02 to modify the original published result (original value: fm). However permission was not obtained to modify the measurement of Burgy et al.Bur51 . Without permission to modify this result we will only state the result here of how the new value of affects the published value for , but this updated value will not be used in the calculation of the average value of . From the measurement of Burgy et al.Bur51 fm gives fm (original value: fm. Note that Burgy et al. reported the ratio of the atomic scattering lengths as opposed to the nuclear scattering lengths: we have converted their ratio into a ratio of nuclear scattering lengths using the expression where fm is the neutron-electron scattering lengthKoe86 ; Koe95 ; Kop95 ; Kop97 .
To calculate an average of all previous measurements we have followed the following procedure given by Hagiwara et al PDG02 . The data was combined into an average with results weighted inversely with the size of their () uncertainties. The result of this evaluation is fm and fm. The reduced chi square, , of the average value for H is 3.6 and for D is 0.7. Since the for H is greater than 1 we chose to scale up the uncertainty by based on the method of Hagiwara et al PDG02 .
References
- (1) J.L. Friar, B.F. Gibson, and G.L. Payne, Phys. Rev. C28 983(1983).
- (2) S. Ishikawa, Phys. Rev. C59, R1247 (1999).
- (3) H. Witala, D. Huber, and W. Glockle, Few-Body Syst. 14, 171 (1993).
- (4) W. Glockle, H. Witala, D. Huber, H. Kamada, and J. Golak, Phys. Rep. 274, 107 (1996).
- (5) A. Kievsky, M. Viviani, and S. Rosati, Phys. Rev. C52, R15 (1995).
- (6) S. Rosati, M. Viviani, and A. Kievsky, Few-Body Syst. Suppl. 8, 21 (1995).
- (7) A. Kievsky, Few-Body Syst. Suppl. 9, 405 (1995).
- (8) B. S. Pudliner et al., Phys. Rev. C56, 1720 (1997).
- (9) J. Carlson and R. Schiavilla, Few-Body Syst., Suppl. 7, 349 (1994).
- (10) R. B. Wiringa, V. G. J. Stoks, and R. Schiavilla, Phys. Rev. C51, 38 (1995).
- (11) A. Kievsky, M. Viviani, and S. Rosati, Nucl. Phys. A551, 241 (1994).
- (12) P. F. Bedaque and U. van Kolck, Phys.Lett. B428, 221 (1998).
- (13) G. M. Hale, Los Alamos National Laboratory (unpublished).
- (14) P. F. Bedaque, H. W. Hammer, and U. van Kolck, Nucl.Phys. A646, 444 (1999).
- (15) H. W. Hammer, LANL e-Archives, nucl-th/9905036, (1999).
- (16) U. van Kolck, Nucl.Phys. A645, 273 (1999).
- (17) D. B Kaplan, M. J. Savage, and M. B. Wise, Phys. Lett. B424, 390 (1998).
- (18) J. Gegelia, LANL e-Archives, nucl-th/9802038 (1998).
- (19) E. Epelbaum, H. Kamada, A. Nogga, H. Witala, W. Glockle, and U. G. Meissner, Phys. Rev. Lett. 86, 4787 (2001).
- (20) T. C. Black, H. J. Karwowski, E. J. Ludwig, A. Kievsky, M. Viviani, and S. Rosati, Phys. Lett. B 471 (1999) 103.
- (21) A. C. Phillips, Rep. Prog. Phys. 40, 905 (1977).
- (22) C. R. Chen, G.L. Payne, J.L. Friar, and B.F. Gibson, Phys. Rev. C44, 50 (1991).
- (23) W. Dilg, L. Koester, and W. Nistler, Phys. Lett. B36, 208 (1971).
- (24) A. Ioffe, D.L. Jacobson, M. Arif, M. Vrana, S.A. Werner, P. Fischer, G.L. Greene, and F. Mezei, Phys. Rev. A58, 1475 (1998).
- (25) V.F. Sears, Neutron Optics, Oxford University Press, 1989.
- (26) M. Arif, D. E. Brown, G. L. Greene, R. Clothier, and K. Littrell, edited by C. G. Gordon, Proc. SPIE 2264, 21 (1994).
- (27) H. Rauch, S. Werner, Neutron Interferometry: Lessons in Experimental Quantum Mechanics, Oxford University Press, 2000.
- (28) P. Mohr and B.N. Taylor, Rev. of Mod. Phys., 72, 351 (2000).
- (29) A. Michels, W. de Graaff, T. Wassenaar, J.M.H. Levelt, and P. Louwerse, Physica,’s Grav. 25, 25 (1959).
- (30) J. H. Dymond, The virial coefficients of pure gases and mixtures: a critical compilation, (New York, Oxford University Press, 1980).
- (31) Certain trade names and company products are mentioned in the text or identified in illustrations in order to adequately specify the experimental procedure and equipment used. In no case does such identification imply recommendation of endorsement by the National Institute of Standards and Technology, nor does it imply that the products are necessarily the best available for the purpose.
- (32) d. Centreras, Mensor calibration report # 13255 2000 (unpublished).
- (33) M. Ichimura, Y. Sasajima, and M. Imabayashi, Mat. Trans., JIM, 33, 449 (1992).
- (34) A. Compaan, A. Wagoner, and A. Aydinli, Am. J. Phys. 62, 639 (1994).
- (35) C.-Yu Lin, Ph.D. Thesis, Princeton University (2002).
- (36) Koester, L., Rauch, H., and Seymann, E., Atomic Data and Nuclear Data Tables 49, 65 (1991).
- (37) John Stoup (NIST Test No. 821/265253-01).
- (38) In CRC Handbook of Chemistry and Physics, 68th Edition, edited by R. C. Weast (Cleveland, Ohio, CRC Press, 1987).
- (39) G. Basile, A. Bergamin, G. Cavagnero, G. Mana, E. Vittone, and G. Zosi, Phys. Rev. Lett. 72, 3133 (1994).
- (40) J. Schmiedmayer, P. Riehs, J. A. Harvey, N. W. Hill, Phys. Rev. Lett. 66, 1015 (1991).
- (41) E. Nowak, Z. Phys. B 49, 1 (1982).
- (42) B. A. Lippmann, Phys. Rev. 79, 481 (1950).
- (43) B. A. Lippmann and J. Schwinger, Phys. Rev. 79, 469 (1950).
- (44) M. Lax, Phys. Rev. 85, 621 (1952).
- (45) J. Callerame, D.J. Larson, S.J. Lipson, and R. Wilson, Phys. Rev. C12, 1428 (1975).
- (46) D. Adli, and G. C. Summerfield, Phys. Rev. A30, 119 (1984).
- (47) J.L. Friar, B.F. Gibson, G.L. Payne, and C. R. Chen, Phys. Rev. C30, 1121(1984).
- (48) G.H. Berthold and H. Zankel, Phys. Rev. C34 1203 (1986).
- (49) C.R. Chen, G.L. Payne, J.L. Friar, and B.F. Gibson, Phys. Rev. C39, 1261 (1989).
- (50) A. Kievsky, M. Viviani, and S. Rosati, Nucl. Phys. A577, 511 (1994).
- (51) A. Kievsky, Nucl. Phys. A624, 125 (1997).
- (52) A. Kievsky, S. Rosati, M. Viviani, C.R. Brune, H.J. Karwowski, E.J. Ludwig, and M.H. Wood, Phys. Lett. B406, 292 (1997).
- (53) E. Epelbaum, A. Nogga, W. Glockle, H. Kamada, U. G. Meissner, and H. Witala, nucl-th/0208023v1, (2002).
- (54) U. van Kolck, Phys. Rev. C49, 2932 (1994).
- (55) J. L. Friar, D. Huber, H. Witala, and G. L. Payne, Acta Phys. Polon. B31, 749 (2000).
- (56) V. G. J. Stoks, R. A. M. Klomp, C. P. F. Terheggen, and J. J. deSwart, Phys. Rev. C49, 2950 (1994).
- (57) J. L. Friar, G. L. Payne, V. G. J. Stoks, and J. J. deSwart, Phys. Lett. B311, 4 (1993).
- (58) R. Machleidt, F. Sammarruca, and Y. Song, Phys. Rev. C53, 1483 (1996).
- (59) R. Holt, private communication.
- (60) O. Zimmer, G. Ehlers, B. Farago, H. Humblot, W. Ketter, and R. Scherm, EJPdirect A1, 1 (2002).
- (61) A. Kievsky et al., Phys. Rev. Lett. 81, 1580 (1998).
- (62) G. Breit and P.R. Zilsel, Phys. Rev. 71, 215 (1947).
- (63) G. Breit, Phys. Rev. 71, 232 (1947).
- (64) G. C. Summerfield, Annals of Physics: 26, 72-80 (1964).
- (65) H. D. Dietze and E. Nowak, Z. Phys. B44, 245 (1981).
- (66) E. Nowak, Z. Phys B45, 265 (1982).
- (67) V. F. Sears, Phys. Rep. 82, 1(1982).
- (68) M. L. Goldberger and K. M. Watson, Collision Theory, Wiley, New York (1964).
- (69) W. Marshall and S. W. Lovesey, Theory of Thermal Neutron Scattering, Oxford University Press (1971).
- (70) J. A. Young and N. U. Koppel, Phys. Rev. A135, 603 (1964).
- (71) H. Rauch and W. Waschkowski, in Landolt-Bornstein, New Series I/16A, ed. H. Schopper, Chap. 6, Springer, Berlin (2000).
- (72) M.T. Burgy, G.R. Ringo and D.J. Hughes, Phys. Rev. 84, 1160(1951).
- (73) Squires, Proc. Roy. Soc. A230, 19 (1955).
- (74) W.C. Dickinson, L. Passell, and O. Halpern, Phys. Rev. 126, 632 (1962).
- (75) L. Koester and W. Nistler, Phys. Rev. Lett. 27, 956 (1971).
- (76) L. Koester, W. Nistler, Unpublished Munich (1979).
- (77) H. Kaiser, H. Rauch, G. Badurek, W. Bauspiess, and U. Bonse, Z. Physik A291, 231 (1979).
- (78) S. Hammerschmied, H. Rauch, H. Clerc, U. Kischko, Z. Physik 302, 323 (1981).
- (79) D.G. Hurst and N.Z. Alcock, Can. J. Phys. 29, 36 (1951).
- (80) C. G. Shull and E. O. Wollan, Phys. Rev. 81, 527 (1951).
- (81) J.E. Worsham, Jr., M.K. Wilkinson, and C.G. Shull, J. Phys. Chem. Sol. 3, 303 (1957).
- (82) W. Gissler, Z. Krist. 118, 149 (1963).
- (83) L. Koester, Z. Phys. 219,300(1968).
- (84) W. Nistler, Z. Naturf. A29, 1284(1974).
- (85) L. Koester, Nuc. En. Ag. Nuc. Dat. Com. E-212U, 64 (1980).
- (86) L. Koester, Z. Phys. 198, 187 (1967).
- (87) L. Koester and W. Nistler, Z. Phys. A272, 189 (1975).
- (88) S.J. Nikitin, W.T. Smolyankin, W.Z. Kolganow, A.W. Lebedew, and G.S. Lomkazy, First International Conference on Peaceful Uses of Atomic Energy (The United Nations, New York, 1956) 2, 81 (1955).
- (89) W. Bartolini, R. E. Donaldson, and L. Passell, Bull. Am. Phys. Soc. 8, 477 (1963).
- (90) W. Bartolini, R. E. Donaldson, and D. J. Groves, Phys. Rev. 174, 313 (1968).
- (91) P. Coppens, T.M. Sabine, A. Cryst. B25, 2442 (1969).
- (92) Granzer, Unpublished Viena (1979).
- (93) J. Meier, diploma thesis TU-Munich, Reaktorstation Garching 1985.
- (94) L. Passell, private communication.
- (95) L. Koester, W. Waschkowski, and A. Kluever, Physica B & C (Netherlands) B37, 282 (1986).
- (96) L. Koester, W. Waschkowski, L. V. Mitsyna, G. S. Samsovat, P. Prokofjevs, and J. Tambergs, Phys. Rev. C51, 3363 (1995).
- (97) S. Kopecky, P. Riehs, J. A. Harvey, and N. W. Hill, Phys. Rev. Lett. 74, 2427 (1995).
- (98) S. Kopecky, J. A. Harvey, N. W. Hill, M. Krenn, M. Pernicka, P. Riehs, and S. Steiner, Phys. Rev. C56, 2229 (1997).
- (99) K. Hagiwara it et al., Phys. Rev. D66, 010001-11 (2002).