Neutrons transition densities for the multiplet of states in 90Zr
Abstract
The neutron transition densities of the levels in 90Zr were extracted in the process of analysing (p,p’) scattering at 400 Mev. Its comparison with the proton transition densities for these levels was undertaken. The radial shapes of the experimental neutron and proton transition densities for each state were found to be different.
pacs:
24.10.Eq;24.10.Ht;25.40.Ep;21.10.-kNUCLEAR REACTIONS 90Zr (polarized p,p’), E = 400 MeV; calculated () and A. Experimental Neutron transition densities for low-lying positive-parity excitations.
The Nuclear structure of 90Zr has been analysed in proton inelastic scattering in various publications (see [1, 2, 3] and references there for earlier papers). In these works, the authors tried to describe experimental data by the shell-model procedure with a limited basis size or by the collective model of inelastic excitation. The lack of the necessary transition strength in the microscopic calculations made them introduce enhancement factors needed to adjust the calculated cross-sections to experiment.
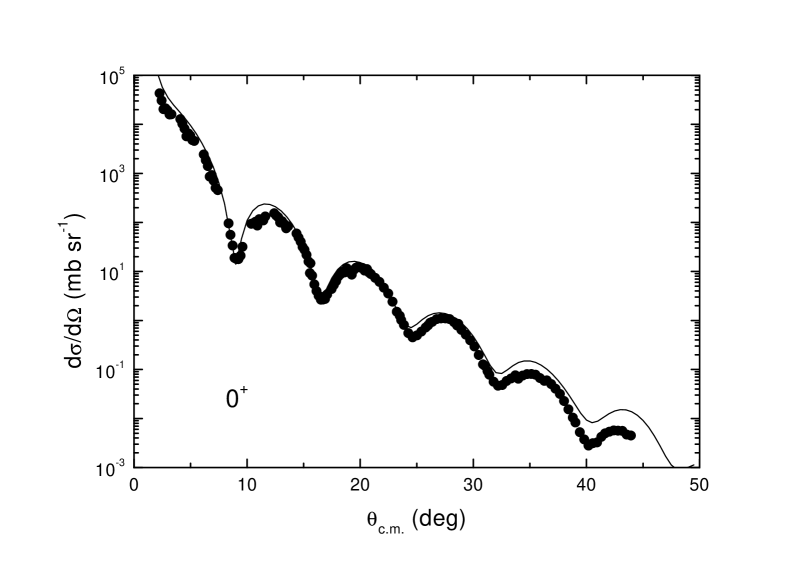
In the present paper, we employ a semi-microscopic approach in which only the matter component of transition densities is used to describe the cross-section and analysing power of inelastic scattering. Earlier [4, 5, 6] it was demonstrated that this approach was adequate for the description of inelastic scattering at medium and intermediate energies for low-lying states with a large admixture of a core-polarisation component in their nuclear wave functions. Since the proton transition density can be determined independently in an electron scattering experiment, proton scattering can be used to obtain the second component of the matter density - the experimental neutron transition density. In this letter, we use the experimental data of [3] to deduce these important characteristics of nuclear excitation for the whole multiplet of the levels in . Earlier a slightly similar procedure was undertaken to deduce the model- dependent neutron transition density. It was done for the first member of this multiplet only (). The result will be examined in our letter further on. In our study of proton scattering, we have used the calculation scheme provided by the linear expansion analysis (LEA) code from Kelly [7]. Our calculations have been performed in the DWBA framework. The same density-dependent nucleon-nucleon interaction [8] is used in the calculations of the optical potential and transition potential for inelastic scattering in the folding-model formalism. These potentials are folded with the nucleon densities of the ground state [9] and the transition densities of the excited states, respectively. We employ a zero-range approximation for exchange and use the local density approximation based upon the density at the projectile position in the analysis of a 400 MeV proton scattering experiment. The comparison of the calculated elastic cross- sections with the experimental data is presented in Fig. 1. The overall agreement is satisfactory. Therefore, we can be confident of the adequate use of the nucleon-nucleon g- matrix interaction and folding procedure at the given energy. For the description of inelastic excitations only matter transition densities are used in the folding procedure to obtain scattering potentials. The proton transition densities have been obtained by unfolding the proton charge densities from the charge transition densities extracted in inelastic electron scattering [10]. According to [7], neutron transition densities for a transition of multipolarity L have been parametrised using the Laguerre-Gaussian expansion (LGE)
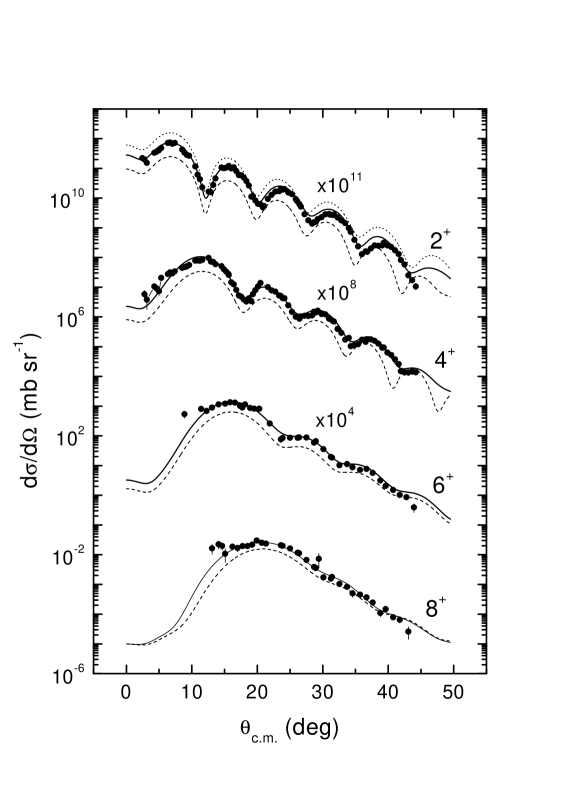
where and . The fitting procedure is similar to that employed in [12] for the nucleus. The oscillator parameter has been set to 2.2 fm. is a generalised Laguerre polynomial of order . The unknown coefficients have been obtained by fitting the calculated differential cross-sections for the nuclear levels in question to the experimental data of [3, 11]. The analysis includes a high- bias and an estimate of the incompleteness error that results from limitation of the data to finite momentum transfer. A tail bias is used to damp unphysical oscillations of the density for , where it is assumed that is beyond the match radius . The parameter is adjusted to the fitted density at the match radius . The fits to the cross-section data are displayed in Fig. 2. The LGE expansion coefficients for the neutron transition densities in question are tabulated in Table 1. The fitted neutron transition densities presented in Fig.3 are compared with proton transition densities for the same levels. In Fig. 2 the dash curve also represents the calculated cross-sections in the approximation of a pure isoscalar character of the excitations. It can be seen there from the comparison with experiment that this approximation is unacceptable. The transition strength is customarily characterised by the moment
where = p or n for protons and neutrons, respectively, and is the radial dependence of the corresponding transition density. The value is highly sensitive to the tail bias of the radial density distribution. The latter, in its turn, is determined by small momentum transfer experimental data for the transition analysed. Unfortunately, we have a lack of such data for the and especially for the states [3, 11]. Therefore, the extracted neutron transition densities may be inaccurate for high multipolarities. The obtained results for multipolarity L are presented in Table 1. In Fig.4 we also present comparisons between the calculated analysing powers and the corresponding experimental data for the considered transitions. It can be seen that the use of the fitted neutron transition densities improves the phase structure of the analysing powers for the and states at large scattering angles, though it slightly reduces the calculated values in the region of 30 degrees in comparison with the calculations using isoscalar transition densities for these states. The overall agreement with experiment is nearly the same for the both options of the transition densities. As a result, the radial dependence of the neutron transition density has a small influence upon the analysing powers; consequently, the analysing power data have not been included in the fitting procedure in our paper as well as in [13]. The surface lobes in the extracted neutron transition densities for the states are greater in absolute value than those in the proton densities; however, they are shifted to the interior of the nucleus. That is why the ratio of the transition strengths is smaller than a value of 1.0 (see Table 1). A comparable shifting of the surface lobes is also observed for the level. However, the ratio between the peaks of the two transition densities is reverse here, as compared with the above mentioned states. The application of our transition densities, including that for the , will be reported in a separate paper. Earlier the model-dependent neutron transition density for the level was extracted [13] in the description of inelastic proton scattering at 500 Mev. Besides, inelastic scattering of 6Li ions was used [14] to extract the ratio and to test the transition densities of this level, obtained from open-shell random phase approximation (RPA) calculations. The value of obtained in [14] is and in a special fit there is , which agrees with our value . However, the value obtained in [13] () considerably deviates from ours. The radial dependence of the neutron transition density from [13] for this state is also presented in Fig.3 in comparison with that extracted in the present paper. Their fitted result is slightly shifted to the exterior of the nucleus, as compared with our experimental neutron transition density, and it does not have any inner structure. When we used the transition density of [13] in our calculations, we overestimated the differential cross-section for this level (see Fig. 2). The deficiency exhibited by the transition densities of the microscopic shell-model calculation (valence protons) is often remedied by the coherent addition of a phenomenological core vibration amplitude (see [1, 3] e.g.). However, our results (Fig. 3) clearly demonstrate that such assumptions present too naive a picture of 90Zr. Furthermore, our radial densities provide much more insight into the structure of a transition than other predictions, especially into the interior of the nucleus. The proton transition densities for the to multiplet arise from the same dominant configuration , and thus the shape of all these densities is determined likewise by the shape of the radial wave function. The neutron shell is closed in 90Zr, but, as is seen from Fig. 3, the contributions of neutron excitations are not weak and mostly outmeasure the proton contributions. Although the shapes of both contributions are different across-the-board and, consequently, all the analysed excitations are far from isoscalar, contrary to many common assumptions. We have also used the obtained transition densities for inelastic proton scattering at 61.2 MeV and 800 MeV. The description appears to be rather good. Our demonstration of the energy independence of the extracted neutron densities confirms the accuracy of the analysis procedures.
-
1 2 3 4 5 6 1 2 3 4 5 6
References
References
- [1] Gazally M M, Hintz N M, Franey M A et al 1983 Phys. Rev.C 28 294
- [2] Baker F T, Scott A, Grimm M A et al 1983 Nucl. Phys.A 393 283
- [3] Lee L, Drake T E, Wong S S M et al 1989 J. Phys. G: Nucl. Part. Phys.15 L91
- [4] Plavko A V, Onegin M S and Ponkratenko O A 1986 Bulletin of the Russian Academy of Sciences, Physics Series 50 No. 5 117
- [5] Khandaker M A, Kelly J J, Boberg P et al 1991 Phys. Rev.C 44 1978
- [6] Plavko A, Onegin M, Kudriashov V et al 1995 AIP Conf. Proc. 339 ed E J Stephenson and S E Vigdor (New York; AIP) p 581
- [7] Kelly J J Computer program LEA (unpublished,private communication)
- [8] von Geramb H V 1983 AIP Conf. Proc. 97 ed H O Meyer (New York; AIP) p 44
- [9] Ray L, Coker W R and Hoffman G W 1978 Phys. Rev.C 18 2641
- [10] Heisenberg J, Dawson J, Milliman T et al 1984 Phys. Rev.C 29 97
- [11] Lee L PhD thesis Univercity of Toronto
- [12] Kelly J J, Flanders B S, Hersman F W et al 1993 Phys. Rev.C 47 2146
- [13] Bartlett M L, Hoffman G W and Ray L 1987 Phys. Rev.C 35 2185
- [14] Horen D J, Auble J, Gomes del Campo J, Sachler G R et al 1993 Phys. Rev.C 47 629