Near-threshold production of mesons in the reaction
Abstract
The first measurement of the total cross section has been achieved at mean excess energies of and MeV by using a deuterium cluster-jet target. The momentum of the fast deuteron was measured in the ANKE spectrometer at COSY-Jülich and that of the slow “spectator” proton from the reaction in a silicon telescope placed close to the target. The cross sections lie above those measured for but seem to be below theoretical predictions.
pacs:
25.40.VeOther reactions above meson production thresholds (Energies MeV) and 25.40.FqInelastic neutron scattering and 14.40.CsOther mesons with , mass 2.5 GeV1 Introduction
The last few years have seen several measurements of production in nucleon-nucleon collisions ppeta but relatively few of production Hibou ; TOF . The -wave amplitude in the case is strong and the total cross section largely follows phase space modified by the final state interaction up to an excess energy MeV, though there is some evidence for an final state enhancement at very low FJW . Here is the total centre-of-mass (cm) energy and are the masses of the particles in the final state. Quasi-free production in proton-neutron collisions has been measured by detecting the photons from decay and it is found that for MeV the cross section ratio Cal1 . Now the final state is pure isospin , whereas the is a mixture of and . Up to MeV the cross section for is larger than that for Cal2 , and this can be understood quantitatively in terms of phase space in a largely model-independent way FJW . In all meson production reactions it is important to have data on the different possible isospin combinations in order to constrain theoretical models. It is therefore interesting to see whether a similar isospin dependence is found for the , the next heavier isoscalar meson.
Unlike the case, the -meson has a significant width (8.4 MeV/c2) and so is here defined with respect to the central mass value of 782.6 MeV/c2 PDG . The total cross section has been measured at five energies in the range MeV at the SATURNE SPESIII spectrometer Hibou and at MeV at COSY-TOF TOF where, in both cases, the was identified through the missing mass technique. The energy dependence deduced is rather similar to that of the , except that the phase space and final state interaction have to be smeared over the finite width, a feature which becomes important close to the nominal threshold Hibou .
Attempts to measure the reaction using a neutron beam are complicated by the intrinsic momentum spread, which is typically 7% FWHM even for a stripped deuteron beam Sawada . The alternative is to use a deuterium target and effectively measure the momentum of the struck neutron. This is made possible by detecting the very low momentum recoil protons, MeV/c, in the reaction in a silicon telescope placed close to the target. Such an approach is feasible at internal experiments at storage rings such as CELSIUS or COSY because of the thin windowless targets that can be used there. Under these conditions the recoil proton can be largely treated as a “spectator” that only enters the reaction through its modification of the kinematics. The measurement of the fast deuteron in coincidence would then allow us to identify the by the missing mass method. By varying the angle and momentum of the spectator proton it is possible to change the value of while keeping the beam momentum fixed. The principle of this method has been proved at CELSIUS for the reaction, where could be determined to 2 MeV Tord .
2 Experimental Set-up
Our experiment was performed using a deuterium cluster-jet target Mue at the ANKE spectrometer ANKE situated inside the COoler SYnchrotron COSY-Jülich, with the fast deuteron being measured in the ANKE Forward Detector and the spectator proton in solid state counters. The silicon telescope used for this purpose is described in detail in Ref. NIM_SP and only the principal features will be mentioned here. The three silicon layers indicated in Fig. 1, of respectively 60m, 300m, and 5 mm, covered polar angles and in azimuth. Protons with kinetic energies in the range MeV traversed the first layer but were stopped in the second, while those in the range MeV were stopped rather in the final thick layer. Energy resolution of the order of keV was obtained. The second and third layers were composed of strips arranged perpendicular to the beam such that for MeV a resolution of could be achieved. For the lower energy protons, neglecting the small non-target background, the finite target size led to .
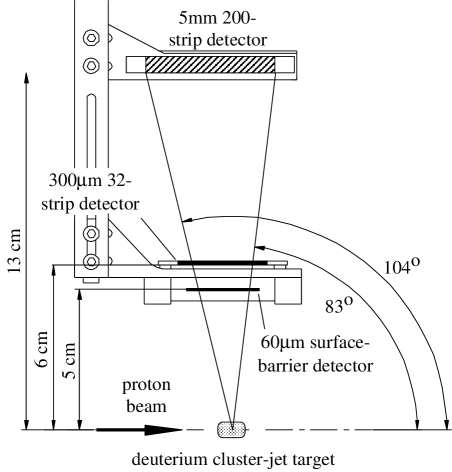
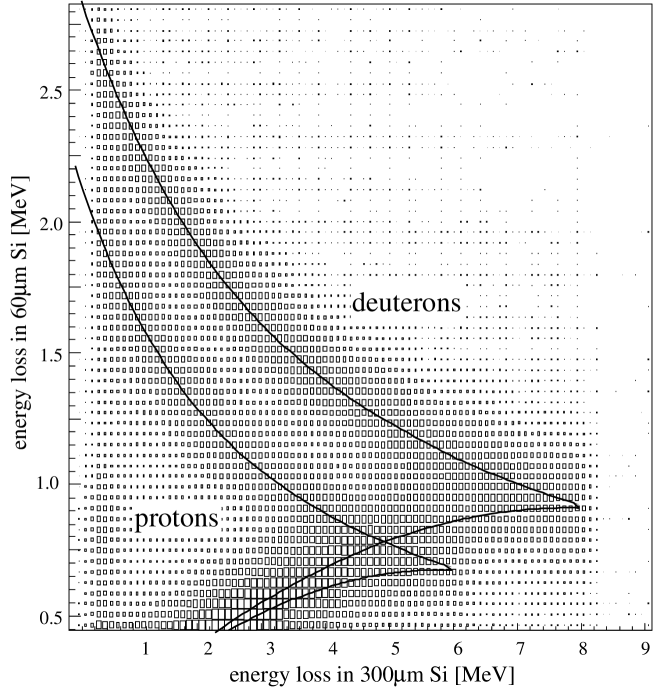
There was no difficulty in separating slow deuterons from protons via the method in two ranges: MeV (MeV/c) and also MeV (MeV/c). This is illustrated for the lower range in Fig. 2. It is seen here that, by choosing the 4.4 MeV upper limit, one avoids the possibility of misidentifying deuterons traversing the first two layers but missing the third.
The ability to identify a deuteron in the telescope in coincidence with a proton in the forward detector also allows us to obtain simultaneously the luminosity by measuring proton-deuteron elastic scattering through a determination of the deuteron kinetic energy. For this purpose we have calculated the elastic proton-deuteron cross section at our energies within the Glauber model Glauber . Such an estimate agrees with the available experimental data at 2.78 GeV/c to within the quoted error of about 10% pd_data . The 1% uncertainty in the energy of the recoil deuteron, and hence in the momentum transfer, induces only a 3% error through the angular variation of the normalising reaction. Due to uncertainties in the geometrical constraints in the target chamber, the acceptance correction introduces a 15% systematic error in the absolute cross section normalisation. The overall systematic luminosity error used to determine absolute cross sections was thus taken to be 20%. It should be noted, however, that the error in the relative normalisation between different beam energies is at most 5%.
In order to distinguish deuterons with momenta around 2 GeV/c, arising from the reaction, from a proton background that is two orders of magnitude higher, inclined Čerenkov counters were installed behind the multi-wire proportional chambers and scintillator hodoscope of the forward detection system of ANKE ANKE ; FD . To understand the detection principle, consider the detector response for a proton and deuteron with the same momentum. The opening angle of the Čerenkov light cone for the faster proton is larger. Thus part of the light can reach the photomultiplier after being totally reflected in the counter, whereas all the light produced by the deuteron leaves the counter. A momentum-dependent threshold was applied so as not to change the differential distributions.
The hodoscope, consisting of two layers of scintillation counters, provides an additional criterion for the deuteron identification using the energy loss in both layers. By simultaneously varying the -cut and Čerenkov efficiency level, an optimal combination was found which leads to only a 20% loss of deuterons while giving a 92% suppression of protons due to the Čerenkov counters alone. Projecting the energy loss in the second layer along the predicted energy loss of deuterons (), one obtains the dotted histogram shown in Fig. 3. A further cut on the analogous distribution in the first layer reveals a clear deuteron peak (solid line). Moreover, the shape of the remaining proton background can be determined using the energy loss distribution of suppressed particles which, after scaling, is drawn as the dashed line. This shows that the proton background is on the 10% level.

3 Data Analysis
Having identified a spectator proton in the telescope and a deuteron in the forward array and furthermore measured their momenta and directions, one can evaluate the missing mass in the reaction. To clarify the effects of the kinematics, it is sufficient to treat the spectator as being non-relativistic. To order we have then
| (1) |
where is the value obtained at . Here and are the laboratory momentum and total energy of the incident proton, and those of the produced deuteron, and and the masses of the deuteron and proton respectively. The square of the cm energy, , can be evaluated purely using measurements in the spectator counter and from this can be derived:
| (2) |
where is the value for a stationary neutron. Because the telescope is placed around , is then maximal and so the value of depends sensitively upon the determination of the polar angle of the spectator with respect to the beam direction.
Since in our set-up the fast deuteron is measured near the forward direction, the same sort of sensitivity is also found for when using Eq. (1). Now for each beam momentum the beam direction could not be established to much better than , and this may induce a systematic shift of a few MeV/c2 in the value of . On the other hand, in view of the width, the uncertainty in the beam momentum (MeV/c) is unimportant for both and at this level of accuracy. The struck neutron is slightly off its mass shell but the off-shellness is controlled by the spectator momentum and rests small throughout our experiment.
In Fig. 4 we show our results from the first two silicon layers (MeV/c), where the spectator hypothesis should be very good. The angular information is important for the missing mass determination but, in view of the limited statistics, we had to sum over rather wide bins in excess energy. Experience with production in proton-proton collisions shows that there is considerable multi-pion production under the peak Hibou . Without measuring the products of the decay, this can only be reliably estimated by comparing data above and below the threshold. Two of the four momenta correspond to largely below-threshold measurements and two above, at mean values of equal to about 28 and 57 MeV.
There is an indication of a weak signal at the highest energy and, in order to evaluate its significance, we have to master the large multipion background over our range of energies. Two different approaches have been undertaken to overcome this problem. In the first, pion production is modelled within a phase-space Monte Carlo description. The second method is identical to that used in the analysis of the experiment Hibou , where the data below threshold were taken to be representative of the background above, being merely shifted kinematically due to the changed beam energy such that the upper edges of phase space match. This matching of the ends of phase space can also be used to check the set-up of the system at each momentum. The only significant discrepancy was found at 2.807 GeV/c where, in order to account for a slight displacement observed in the data, 3 MeV/c2 has been subtracted from all values at this beam momentum. As will be shown in the next section, the two different analysis methodologies give consistent results within the error bars.
Most of the background can be described by phase space convoluted with the ANKE acceptance, which provides a severe cut at low . It should be noted that the available data in our energy range show the deuteron distribution to be fairly isotropic in the cm system Abd . In the absence of neutron data, we parameterised the total cross section for the production of pions in proton-proton collisions by
| (3) |
where is the threshold for production. The exponent is fixed by phase space, but and are free parameters adjusted to reproduce the data for 2, 3 and 4 pion production pi_data . The assumption that each of the three contributions follows a -body phase space, undistorted by or resonances, gives a description of the distributions for different beam energies. To model the background, the energy dependence from the case has been used to fix the , with the being adjusted to reproduce simultaneously our experimental distribution at 2.7 GeV/c and the phase-space maximum at 2.9 GeV/c. The relative normalisation between these two momenta was determined from the elastic scattering data. The adjusted A values, together with the relative normalisation established from the luminosity measurement, were used to describe the multi-pion background at 2.6 GeV/c and at 2.8 GeV/c, as shown in Fig. 4.
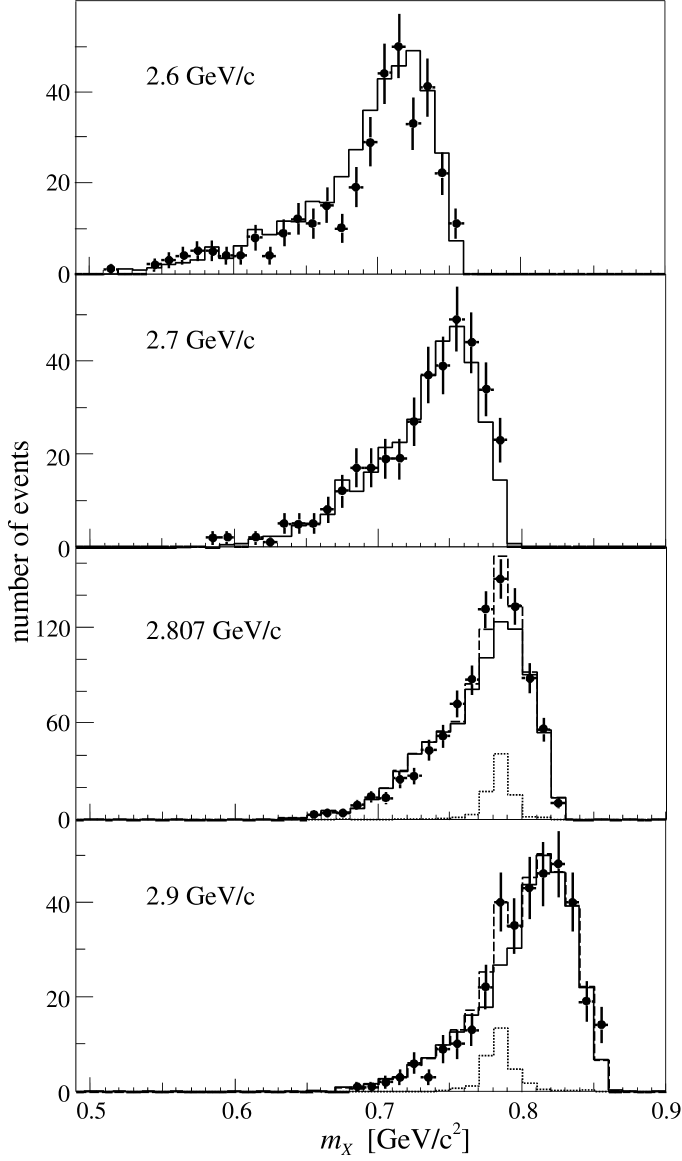
Our method gives a plausible description of the background under the peak at MeV but any signal at MeV lies close to the maximum of the phase-space acceptance and the evaluation of its strength depends much more critically upon the background assumptions. Nevertheless, within the parametrisation of Eq. (3), it is impossible to describe the phase-space maxima simultaneously at the four energies in Fig. 4 without invoking some signal at MeV.
To describe the contribution to the missing mass spectra, we take the matrix element to be constant over the -bin so that the cross section follows phase space. This, combined with the decrease of acceptance at large , means that the mean value of is not quite at the centre of the bin. Other plausible assumptions, such as a constant cross section, would lead to negligible changes in the evaluation of the cross section and mean value of . In the simulation of the reaction, the cross section is smeared over the Fermi motion in the deuteron using the PLUTO event generator PLUTO . This employs the Hamada-Johnston wave function DWF though, at these small values of spectator momenta, other more realistic wave functions give indistinguishable results. The same event generator is used also for the multipion background.
Turning now to our second approach, the authors of ref. Hibou noticed that, apart from the signal, the shape of the missing mass spectrum varied little with beam energy provided that one looked at the distribution with respect to the maximum missing mass. More quantitatively, if and are c.m. velocities at energies and respectively, the measured momenta and angles of the protons were first transformed, event-by-event, from the laboratory to the c.m. system with the velocity and then transformed back to the laboratory with the velocity . To see to what extent this approach is valid for the ANKE spectrometer, which has a much smaller overall acceptance than that of SPESIII Hibou , we have reconstructed the missing mass for the copious proton production . The data at the four different beam momenta, kinematically shifted to 2.9 GeV/c and normalised to the same total number of events, are shown in Fig. 5.

It is clear from the figure that for GeV/c2 the shifted data are in mutual agreement at all beam momenta. For lower missing masses one sees the effect of the production of the isobar, whose position in the shifted mass scale depends, of course, upon the beam momentum. The figure also nicely illustrates the influence of the ANKE acceptance cut, which strongly favours events close to the maximum missing mass.
When the identical analysis procedure is applied to the data, the backgrounds away from the peak at the different momenta are again found to be completely consistent. An average background could therefore constructed and this is shown for the two above-threshold momenta in Fig. 6. The differences between the experimental data and constructed background shows evidence for structure in the region and these have been fitted to peaks whose widths were fixed by the Monte Carlo simulation. The masses obtained from the fits at the two momenta, and MeV/c2, do not differ significantly from the expected value.

4 Results
By comparing the residual signal in Fig. 4 with a simulation of production over this range of spectator energies and angles, we would conclude from simulated background model that b at MeV and b at MeV, where the uncertainty in reflects the total width of the bin and only the statistical error in the cross section is quoted. The corresponding numbers obtained using the SPESIII background technique, b and b respectively, are consistent with the first method, though the statistical errors are larger because we had to subtract a background with limited statistics. This contrasts with our first approach where we imposed the condition that the background should be smooth. Averaging the two sets of results, we obtain b and b at the two excess energies. The second, systematic, error bar includes some contribution arising from the ambiguity of the background discussed above but others, such as the uncertainty in the luminosity, are common to both the signal and background.
In view of the limited statistics it might be helpful to quote upper limits resulting from the fits to the count differences shown in Fig. 6. At the 90% confidence level the cross sections at 2.8 and 2.9 GeV/c are below b and b respectively, where the second figure is the rescaled systematic uncertainty.
One source of systematic uncertainty comes from the restricted angular acceptance of ANKE ANKE , a problem that becomes more serious with increasing . The simulation of the acceptance, illustrated in Fig. 7 for an isotropic production distribution, shows that, while the distribution is fairly flat at 2.8 GeV/c, few events would be accepted close to at 2.9 GeV/c. Although at our energies we might expect -wave production to dominate, when this acceptance is weighted with the possible pure -wave angular variations of or , the resulting overall acceptance estimate at 2.9 GeV/c is changed by factors of of 1.7 and 0.65 respectively. These are, however, extreme scenarios and a systematic error of half of the difference between these values is a generous estimate of this uncertainty. In more refined experiments, where the statistics will allow us to determine the angular distribution, this limitation will be avoided.

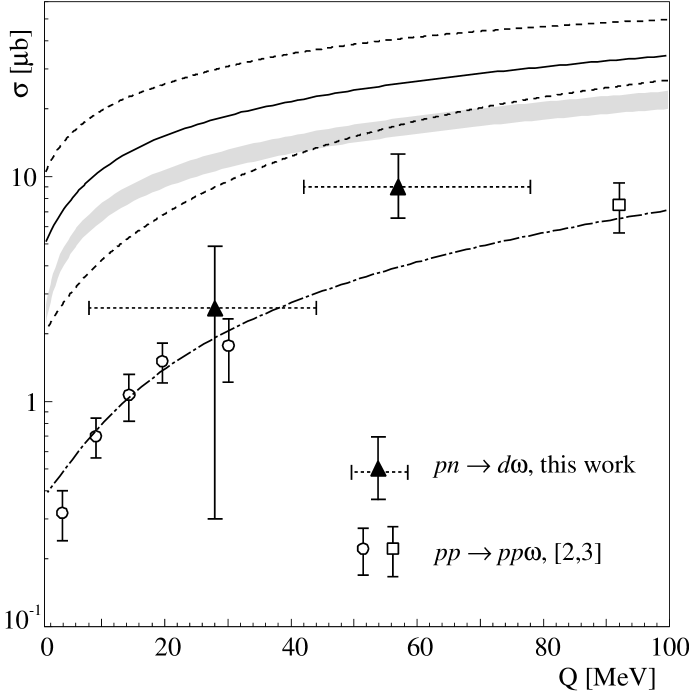
The reduction of flux due to the presence of a second nucleon in the deuteron target (shadowing) has been estimated in the -production case to be about 5% of the cross section PINOT and such a correction has been applied to our data. These values are shown in Fig. 8 along with those for the reaction.
Due to the momentum distribution in the deuteron, the statistics for spectators in the higher range, MeV, are only about a third of those in the lower range. Nevertheless, the corresponding missing mass spectra are consistent with those shown for the lower spectator energies in Fig. 4, with cross sections compatible with our results in Fig. 8.
We have checked our methodology by identifying events corresponding to the reaction at 1.22 GeV/c. Using the same procedures as for the analysis, we find mb at MeV, where the statistical error is negligible. This value is to be compared to mb deduced from a compilation of the isospin-related reaction SAID .
5 Conclusions
In any meson exchange model, the relative strength of production in and collisions depends sensitively upon the quantum numbers of the exchanged particles. If only a single isovector particle, such as the or , were exchanged then, neglecting the differences between the initial and final interactions, one would expect . This would explain most of the 6.5 factor found in the case Cal2 . Assuming that the ratio to is as for production, the parametrisation of the available data Hibou ; TOF leads to the solid curve, which lies about a factor of three above our data. Another estimate is a little lower but similar in shape Grishina . Both curves lie within the extremes of the predictions of the Jülich theory group JTG , where the major uncertainty arises from the relative strengths of production and exchange current terms.
Taking our 90% C.L. upper limit on the cross section, augmented by the corresponding systematic uncertainty, would barely bring the data into agreement with the solid line of Fig. 8. Even considering only these upper limits, the model predictions appear higher than the data. Any theoretical overestimation might be explained if there were significant isoscalar exchange, perhaps through the itself.
In summary, we have carried out the first measurement of the reaction by detecting the spectator proton from a deuterium target in coincidence with a fast deuteron. Although the data are of very limited statistical significance, they suggest that the cross section lies below the published theoretical predictions.
In order to clarify the situation further, we are constructing second generation silicon telescopes that will increase the acceptance significantly. It would then be of interest to try to extend this study to the region so that one could investigate the OZI rule in the channel to see if the deviations are similar to those in the channel.
The work reported here formed part of the PhD thesis of one of the authors [IL]. We are most grateful to the team of the IKP semiconductor detector laboratory, D. Protić, T. Krings and G. Fiori, who developed and supported the necessary material for our spectator counters. We wish to thank D. Prasuhn, J. Stein, B. Lorentz and the COSY team for carrying out the beam development required by the condition that our detectors are only 5 cm from the circulating proton beam. P. Wieder, W. Borgs and S. Mikirtichiants helped in preparing and performing the experiment. The work has been financially supported by the DFG (436 RUS 113/630/71), the Russian Academy of Science (RFBR02-02-0425) and the FZ-Jülich (COSY-064).
References
- (1) See for example H. Calén et al., Phys. Lett. B 366 (1996) 39; J. Smyrski et al., Phys. Lett. B 474 (2000) 182.
- (2) F. Hibou et al., Phys. Rev. Lett. 83 (1999) 492.
- (3) S. Abd El-Samad et al., Phys. Lett. B 522 (2001) 16.
- (4) The field is summarised in G. Fäldt, T. Johansson and C. Wilkin, Phys. Scrip. T99 (2002) 146.
- (5) H. Calén et al., Phys. Rev. C 58 (1998) 2667.
- (6) H. Calén et al., Phys. Rev. Lett. 79 (1997) 2642, idem 80 (1998) 2069.
- (7) K. Hagiwara et al., Phys. Rev. D 66 (2002) 010001.
- (8) S. Sawada et al., Nucl. Phys. A 615 (1997) 277.
- (9) R. Bilger et al., Nucl. Instr. Meth. A 457 (2001) 64.
- (10) H. Dombrowski et al., Nucl. Instr. Meth. A 386 (1997) 228; A. Khoukaz et al., Eur. Phys. J. D 5 (1999) 275.
- (11) S. Barsov et al., Nucl. Instr. Meth. A 462/3 (2001) 364.
-
(12)
I. Lehmann, PhD thesis, University of Cologne, 2003;
I. Lehmann et al., Nucl. Instr. Meth. A (in press). - (13) V. Franco and R. J. Glauber, Phys. Rev. 142 (1966) 1195.
- (14) N. Dalkhazav et al., Sov. J. Nucl. Phys. 8 (1969) 196.
- (15) B. Chiladze et al., Part. and Nucl. Lett. 4 (2002) 113.
- (16) A. Abdivaliev et al., Nucl. Phys. B 168 (1980) 385.
- (17) Landolt-Börnstein, 12 (1980) p. 97, reactions 71, 72 and 73.
- (18) http://www-hades.gsi.de/computing/pluto/html/PlutoIndex.html
- (19) T. Hamada and I.D. Johnston, Nucl. Phys. 34 (1962) 382.
- (20) E. Chiavassa et al., Phys. Lett. B 337 (1994) 192.
- (21) http://gwdac.phys.gwu.edu/analysis/pd_analysis.html
- (22) K. Nakayama, J. Haidenbauer and J. Speth, Phys. Rev. C 63 (2001) 015201.
- (23) V. Grishina et al., Phys. Atom. Nucl. 63 (2000) 1824.