Hadron Correlations and Fluctuations in 40, 80, and 158 AGeV/ Pb-Au Collisions
Measurements of HBT correlations and event-by-event fluctuations of mean and the net charge in Pb-Au collisions at 40, 80, and 158 AGeV/ are presented. From comparisons of HBT radii measured from AGS to RHIC energies, a universal mean free path of pions at the thermal freeze-out of about 1 fm is derived. Non-statistical mean fluctuations of about 0.7 % are measured, which are somewhat smaller than fluctuations at RHIC. No indication for the QCD critical point is observed. Fluctuations of the net charge are reproduced by RQMD and URQMD models, but significantly larger than prediction in equilibrated QGP.
1 Introduction
The HBT interferometry measurements of pions provide information on the space-time extent and the dynamical behavior of the pion source in relativistic heavy ion collisions. The present data by CERES at 40, 80, and 158 AGeV serve as an important link between the existing results from AGS, SPS, and RHIC, which may provide a hint to the recently found RHIC puzzle . By systematic comparisons of the source size among different collision energies, thermal freeze-out conditions may be derived.
Event-by-event mean fluctuations have been proposed as a probe to search for the QCD critical point, where the fluctuations are predicted to be enhanced . Fluctuations of the net electric charge have been proposed as a probe to search for initial fluctuations in the QGP phase, where the fluctuations are predicted to be suppressed . The present data may also provide a hint to answer the question whether initial suppressed fluctuations in the QGP can survive hadronization and subsequent rescattering.
A detailed description of the CERES experiment is found elsewhere . In the present analysis, the primary vertex and charged particle tracks are reconstructed by two silicon drift detectors (SDD’s) located just after the target, and a Time Projection Chamber (TPC) located m downstream from the target. The acceptance of a full-length track in the TPC is . Momentum of a charged particle track is calculated from its azimuthal deflection inside the TPC under the magnetic field. The centrality of a Pb-Au collision is determined by the charged particle multiplicity in SDD’s at 40 AGeV/, and an analog signal in the multiplicity counter at 80 and 158 AGeV/. The data analyzed here correspond to the % most central events.
2 Results of HBT correlations
Two identical pion correlation functions are fitted to a formula based on the Bertsch-Pratt parameterization with the Cartesian decomposition of in the longitudinally comoving system (LCMS) assuming pion mass. The fitting formula includes a consistent Coulomb correction . Fig. 1 shows the three components of the source radii, , , and as a function of mean pair () at AGS, SPS, and RHIC. The variations of the source radii in these collision energies are small. The dependence shows a strong decrease. At SPS energies, this dependence is shown to be described with collective expansion models .
, proportional to the source life time, increases from AGS to RHIC energies. , corresponding to the transverse source size at small pair transverse-mass, decreases from AGS energy to 158 AGeV/ at SPS, and then increases to the RHIC energy. The ratio is observed to be close to 1 at each collision energy, which may be related to a short duration of particle emission, and possible opaqueness of a pion source .
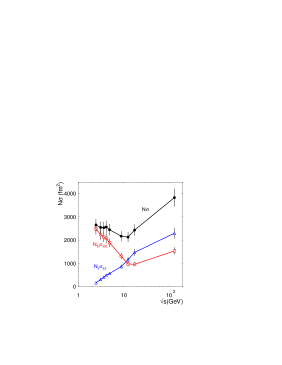
The freeze-out volume is expressed as at small . The obtained from the measured source radii at GeV is plotted in the left panel of Fig. 2 as a function of . The shows a non-monotonic dependence, with a minimum between AGS and SPS energies. To understand this, we consider , where is the number of the particles inside , and is the cross section of a particle in the medium with a pion. Neglecting particles except for pions and nucleons, we can express nucleon and pion components separately as . The two components of and the sum are plotted in the right panel. The total shows again a non-monotonic dependence. In the left panel , the shows a very similar collision energy dependence to . The scaling factor is given by the mean free path of pions at the freeze-out, . Thus, a universal freeze-out condition fm is derived from AGS to RHIC energies.


3 Results of event-by-event fluctuations
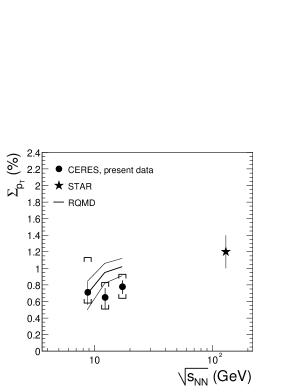
A measure of mean fluctuations is defined as , where is the mean , is the r.m.s. of the event-by-event mean distribution from the real events, and is that from the statistical distribution, which is defined as with the r.m.s. of the inclusive distribution, , and the mean multiplicity, . The left panel of Fig. 3 shows mean fluctuations measured by CERES at 40, 80, and 158 AGeV/ in the 6.5 % most central events at GeV/ and , which are compared to the measurement by STAR at GeV in GeV/ . The CERES data, corrected for short range correlations and two-track resolutions are about 0.7 %, which are smaller than the uncorrected STAR data of about 1.2 %. No indication of non-monotonic dependence from SPS to RHIC indicating the crossing of the QCD critical point was observed. The RQMD model gives slightly higher fluctuations than the CERES data.
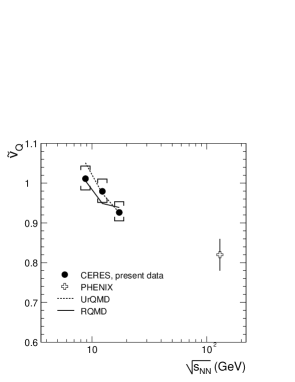
A measure of net charge fluctuations is defined as . Here is the r.m.s. of the event-by-event net charge () distribution from the real events, where and are positive and negative charged particle multiplicity, respectively. Two correction factors are applied; for the global charge conservation, and for the non-zero mean net charge. The right panel of Fig. 3 shows the net charge fluctuations measured by CERES at the three beam energies in the 6.5 % most central events at GeV/ and at , which are compared with the measurement by PHENIX at RHIC . A decrease of from 1 to as a function of is observed from SPS to RHIC. The observed fluctuations at SPS are reproduced well by the RQMD and URQMD models, while they are significantly underestimated by QGP predictions of .
4 Conclusions
We measured pion source radii in 40, 80, and 158 AGeV/ Pb-Au collisions. The collision energy dependence of the freeze-out volume obtained with and shows non-monotonic behavior with a minimum between AGS and SPS energies. We derived a universal mean free path of about 1 fm at the thermal freeze-out, which is independent of the collision energy. The small mean free path may indicate opaqueness of the source, which may explain also the observation of the smaller than at SPS and RHIC .
We measured mean fluctuations of about 0.7%, which are somewhat smaller than the measurement by STAR at GeV. The collision energy dependence does not show an indication for the QCD critical point . The RQMD model is slightly higher than the observed data at SPS energies.
The magnitude of net charge fluctuations at 40, 80, and 158 AGeV/ is significantly larger than the expectation for an equilibrated QGP. The good agreement of the observed fluctuations with hadronic cascade models suggests that resonance dynamics and hadronic diffusions are the dominant sources of the observed fluctuations .
The diffusion size of hadrons in rapidity is modeled as , where is a mean rapidity shift per collision, is the life time of the hadronic phase, and is the mean free time. The two time scales are expected to be much smaller than the source size from the HBT measurements, and they affect the diffusion size oppositely. It is therefore a key to evaluate those time scales precisely to search for the onset of the QGP.
Acknowledgments
This work was supported by the German BMBF, the U.S. DoE, the Israeli Science Foundation, and the MINERVA Foundation.
References
References
- [1] CERES Collaboration, D. Adamová, et al., Nucl. Phys. A 714, 124 (2003).
- [2] CERES Collaboration, D. Adamová, et al., Phys. Rev. Lett. 90, 022301 (2003).
- [3] L. McLerran, Proc. ICPAQGP 2001, Jaipur, India, Nov 2001, hep-ph/0202025.
- [4] M.A. Stephanov, K. Rajagopal, and E.V. Shuryak, Phys. Rev. Lett. 81, 4816 (1998).
- [5] M.A. Stephanov, K. Rajagopal, and E.V. Shuryak, Phys. Rev. D 60, 114028 (1999).
- [6] M. Asakawa, U. Heinz, B. Mueller, Phys. Rev. Lett. 85, 2072 (2000).
-
[7]
S. Jeon and V. Koch, Phys. Rev. Lett. 85, 2076 (2000);
M. Bleicher, S. Jeon, and V. Koch, Phys. Rev. C 62, 061902 (2000). - [8] D. Adamová, et al., submitted to Nucl. Phys. A, nucl-ex/0305002.
- [9] Yu.M. Sinyukov, et al., Phys. Lett. B 432, 249 (1998).
- [10] H. Heiselberg and A.P. Vischer, Eur. Phys. J. C 1, 593 (1998).
- [11] B. Tomášik and U. Heinz, Act. Phys. Slov 49, 251 (1999).
- [12] S. Voloshin, V. Koch, and H. Ritter, Phys. Rev. C 60, 024901 (1999).
- [13] STAR Collaboration, S. Voloshin, et al., nucl-ex/0109006.
- [14] PHENIX Collaboration, K. Adcox, et al., Phys. Rev. Lett. 89, 082301 (2002).
- [15] L. McLerran and S.S. Padula, nucl-th/0205028.
- [16] J. Zaranek, Phys. Rev. C 66, 024905 (2002).
- [17] E.V. Shuryak, M.A. Stephanov, Phys. Rev. C 63, 064903 (2001).