Event-by-event fluctuations of the mean transverse momentum in 40, 80, and 158 A GeV/ Pb-Au collisions
Abstract
Measurements of event-by-event fluctuations of the mean transverse momentum in Pb-Au collisions at 40, 80, and 158 A GeV/ are presented. A significant excess of mean fluctuations at mid-rapidity is observed over the expectation from statistically independent particle emission. The results are somewhat smaller than recent measurements at RHIC. A possible non-monotonic behaviour of the mean fluctuations as function of collision energy, which may have indicated that the system has passed the critical point of the QCD phase diagram in the range of under investigation, has not been observed. The centrality dependence of mean fluctuations in Pb-Au is consistent with an extrapolation from collisions assuming that the non-statistical fluctuations scale with multiplicity. The results are compared to calculations by the rqmd and urqmd event generators.
keywords:
Nuclear reactions 197Au(Pb, X), GeV; event-by-event transverse momentum fluctuations, QCD phase transition, critical point.PACS:
25.75.Gz , 25.75.Nq, , , , , , , , , , , , , , , , , , , , , , , , , , , , , , , , , , , , , , , , , , , , , , , , , , , , , , , ,
1 Introduction
The investigation of high energy nucleus-nucleus collisions provides a unique tool to study the properties of hot and dense nuclear matter. The motivation largely comes from QCD calculations, particularly on the lattice, which predict, at sufficiently high temperatures and densities, a transition from hadronic matter to a plasma of deconfined quarks and gluons. In this phase chiral symmetry is also restored. For the case of vanishing net baryon density (or baryon chemical potential ), state of the art lattice calculations suggest that the QCD phase transition occurs at a critical temperature of =1758 MeV [1]. However, a full exploration of the QCD phase diagram in the --plane is desired to obtain insight into the mechanism of deconfinement and chiral symmetry restoration, as well as the properties of astrophysical objects such as neutron stars. At finite net baryon chemical potential , lattice calculations run into technical limitations, which have been partially overcome recently [2, 3], showing how drops with increasing . Complex structures of the QCD phase diagram have been unveiled, such as the possible existence of a critical point of the phase boundary, and a color-superconducting phase at very high baryon density and low temperature [2, 4, 5, 6].
Most theoretical studies of the phase transition imply that it is second order or a continuous but rapid cross-over, at least for values less than 500 MeV [1, 2, 3]. Passage of a system through a second order transition or close to a critical point may lead to critical phenomena, long-range correlations and large fluctuations. The study of event-by-event fluctuations therefore provides a novel probe to explore the QCD phase diagram, searching for the quark-gluon plasma (QGP) and the QCD critical point. Such measurements became possible with large acceptance experiments at SPS and RHIC, where the high multiplicity of charged particles produced in collisions of lead and gold nuclei allows a precise determination of global observables on an event-by-event basis. Pioneering experimental studies have been performed by the NA49 experiment at the SPS, on fluctuations of the mean transverse momentum [7] and of the ratio [8] in central Pb-Pb collisions at 158 A GeV/.
Mean fluctuations have been investigated in collisions at the ISR [9]. These data may be used as a reference to study the degree of thermal equilibration in nucleus-nucleus collisions [10, 11]. On the other hand, an enhancement of mean fluctuations might be related to non-trivial effects showing up specifically in nuclear reactions. It was predicted that mean fluctuations can be enhanced if the system passes through the QCD critical point, where long wave length fluctuations of the sigma field develop, leading to fluctuations of pions through the strong -- coupling [12, 13]. Decay of the Polyakov loop [14] and random color fluctuations [15] are also proposed as possible mechanisms to enhance momentum fluctuations when the system passes the phase boundary from the QGP to the hadronic phase. At high baryon chemical potential (), the possible occurence of large baryon number density fluctuations has been discussed [16].
The NA49 experiment observed non-statistical mean fluctuations consistent with zero [7] at forward rapidity in 158 A GeV/ Pb-Pb collisions at the SPS. This result was explained by a small positive contribution from Bose-Einstein correlations, which is quantitatively compensated by a negative contribution arising from the finite two-track resolution of the detector. No indications for additional non-statistical fluctuations were observed at forward rapidity. However, the complex structure of the QCD phase diagram requires a detailed study of event-by-event fluctuations in the central rapidity region and at all available beam energies. In particular, the data taken at lower SPS energies allow for an investigation of event-by-event fluctuations at larger . The observation of a possible non-monotonic behaviour of the fluctuation strength as function of may indicate the location of the critical point in the QCD phase diagram.
In this paper, we present measurements of event-by-event fluctuations of the mean transverse momentum of charged particles produced near mid-rapidity in Pb-Au collisions at 40, 80, and 158 A GeV/.
2 Experimental setup
The CERES spectrometer at the CERN-SPS was originally conceived for the measurement of low mass -pairs produced in proton and heavy-ion induced collisions with nuclei [17]. This version of CERES consisted of two radial silicon drift detectors (SDD’s) and two ring-imaging Cherenkov counters (RICH1,2), supplemented with a pad detector behind the RICHes. In 1998, after removal of the pad detector, a major upgrade of the spectrometer was performed by the addition of a large cylindrical Time Projection Chamber (TPC) (see Fig. 1). All subdetectors have a common acceptance in the polar angle range of at full azimuth, corresponding to a pseudorapidity acceptance of .
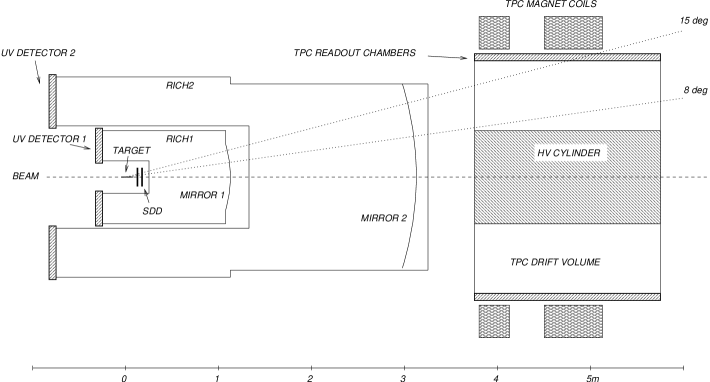
The SDD’s are located about 12 cm downstream of the target system. Each SDD has a uniform radial drift field, with 360 equally spaced readout anodes arranged along the outer perimeter of the Si-wafer. A SDD track segment is defined by a hit in each of the two detectors whose straight line connection points to the vertex of the interaction.
The TPC, located about 3.8 m downstream of the target, has an active length of 2 m and a diameter of 2.6 m. It is filled with a mixture of 80% Neon and 20% CO2, and operated inside the magnetic field generated by two opposite-polarity solenoidal coils, which are placed around the TPC. In the TPC drift volume, the ionization electrons created along charged particle tracks drift outwards along the field lines of a radial electric drift field. They are detected in 16 multi-wire proportional chambers with cathode pad readout, which form the polygon-shaped outer termination of the active TPC volume. The TPC provides the reconstruction of up to 20 space points along a curved charged particle track, thereby improving the momentum resolution of the spectrometer and supplementing its particle identification capability via the measurement of the specific energy loss d/d.
In 1999 (40 A GeV/ Pb-beam period) the target system consisted of eight Au foils of 25 m thickness, separated by 3.1 mm in beam direction and adding to 0.82% of a hadronic interaction length. In 2000 (80 and 158 A GeV/ Pb-beam period) the target was replaced by 13 Au foils of the same dimensions and 2 mm spacing, with a total thickness of 1.33% of an interaction length.
The beam trigger (BEAM) is defined by the coincidence of two Beam Counters BC1 and BC2 located in front of the target. Absence of a signal in a third Beam Counter BC3 located behind the target, in coincidence with BEAM, defines the interaction trigger (INT). An online centrality selection was performed by an additional threshold on the integrated pulse height in the SDD in 1999, or on the signal in a scintillation Multiplicity Counter (MC) in 2000. The data taking rate was 300-500 events per burst, at a typical Pb beam intensity of ions per burst. In 1999, the TPC readout was not yet fully operational. As a consequence, the signals of only % of the 15360 TPC channels could be stored. The 80 A GeV/ data were taken while setting up for the 158 A GeV/ beam period, therefore no SDD information is available for the 80 A GeV/ data.
3 Data analysis
3.1 Event selection and track reconstruction
In the present analysis we have applied an offline centrality selection of the upper 20% of the total geometric cross section. The centrality of the collision was defined by the number of charged particle tracks reconstructed in the SDD (for the 40 A GeV/ data) or the pulse height in the Multiplicity Counter MC (for the 80 and 158 A GeV/ data). The corresponding mean number of participating nucleons and mean number of nucleon-nucleon collisions was derived from a geometric nuclear overlap model using and resulting, with mb, in a total cross section of b [18]. Our classification of central events comprises the 6.5% most central fraction of the total geometric cross section. For the centrality dependent studies we have subdivided our sample into the 0-5%, 5-10%, 10-15%, and 15-20% most central events (see Table 1).
| 337 | 347 | 287 | 239 | 200 | |
| 781 | 809 | 638 | 503 | 393 |
Additional offline cuts have been applied to reject pile-up events and non-target interactions. The total number of analyzed events, after centrality and quality cuts, is 1.5M at 40 A GeV/ and 0.5M at 80 and 158 A GeV/, respectively.
SDD track information has only been used for the centrality definition in 40 A GeV/ events, and for a number of systematic consistency checks as described in Section 3.3. All final results presented below are based on TPC track information only.
A TPC track is defined by a number of hits reconstructed in subsequent readout-planes of the TPC and matching a momentum-dependent track model generated by a Monte Carlo simulation. Depending on the polar angle, a TPC track consists of up to 20 hits. The momentum of the track is evaluated from the azimuthal deflection of the track inside the active TPC volume. At the stage of the calibration used for this analysis, we achieved a momentum resolution of about for tracks containing more than 18 hits (in the 80 and 158 A GeV/ data sets).
A number of fiducial and quality cuts have been applied to provide stable tracking conditions and to reject tracks from secondary particles:
-
•
In the 40 A GeV/ data set, a fiducial cut in the azimuthal angle is applied. Outside this region the efficiency was low due to malfunctioning read-out electronics during the 1999 beam period. No such cut was applied for the 80 and 158 A GeV/ data from the year 2000, where the read-out worked properly. The effect of the azimuthal fiducial cut on the final results has been studied and is included in the systematic errors (see Section 3.3).
-
•
For the analysis of the mean fluctuations only TPC tracks inside the full-length TPC track acceptance () were used to provide sufficient resolution. For the same reason, the analysis was restricted to tracks with transverse momenta GeV/.
-
•
The minimum number of hits per track is 11 at 40 A GeV/ and 12 at 80 and 158 A GeV/ in the full-length TPC track acceptance .
-
•
To suppress secondary particles it is required that the back-extrapolation of the particle trajectory into the target plane misses the interaction point by no more than 10 cm in transverse direction.
-
•
The of the track momentum fit has to be less than three times the r.m.s. of the distribution.
These cuts are used for all final results presented below. A systematic variation of these cuts has been applied to estimate our systematic uncertainties, as described in Section 3.3.
3.2 Measures of mean fluctuations
In the following, we briefly review quantities which have been proposed as measures for event-wise mean fluctuations and summarize notations used in this paper.
The event-wise mean of a single-particle observable , averaged over particles in the acceptance of an event , is given by:
| (1) |
where is the multiplicity of event .
For a quantity which is defined for each event we calculate its mean over all events:
| (2) |
where indicates the total number of events. The weighting factor for each event is equal to for variables which are already an average over particles, i.e. . For other quantities , such as multiplicity , the weighting factor is equal to 1.
The variance of the distribution of is given by:
| (3) |
The inclusive mean (the mean over all particles in all events) and the variance of a single particle observable are defined as:
| (4) |
and
| (5) |
The mean and the variance of are obtained by substituting for in the above equations, and including the event multiplicities as appropriate weighting factors. This weighting procedure provides the most precise estimate of the variance of the parent distribution in case of a finite mean multiplicity [13]:
| (6) |
and
| (7) |
In the present event-by-event analysis, we search for dynamical mean fluctuations beyond those expected in a purely statistical scenario. Dynamical mean fluctuations would therefore result in an event-by-event distribution of which is wider than that expected from the inclusive distribution and the finite event multiplicity.
In previous analyses, the measure has been used to quantify non-statistical mean fluctuations [10]:
| (8) |
where and are defined as for each particle, and for each event, respectively. The measure vanishes in the absence of correlations and dynamical mean fluctuations. There is an approximate expression for in terms of the variances of the event-wise and the r.m.s. of the inclusive distributions [19]:
| (9) |
A different measure for dynamical mean fluctuations has been proposed in [19]:
| (10) |
This expression provides a direct relation between the variance of the inclusive distribution, the mean multiplicity, and the variance of the event-by-event mean distribution. In case of vanishing non-statistical fluctuations and correlations, is equal to zero. It has also been shown that is the mean of the covariances of all possible pairs of two particles from the same event [19].
An alternative approach to evaluate is based on the analysis of subevents [19]. The subevent method was applied for a number of consistency checks, however, all final results presented below are obtained using Eq. (10) for the evaluation of .
There is an important relation between and [19]:
| (11) |
Based on our results presented below we find that this relation holds extremely well.
In order to account for a possible change of mean at different beam energies, we define a dimensionless measure, the ”normalized dynamical fluctuation” :
| (12) |
Due to the central limit theorem, the two measures and are equal to zero in a purely statistical distribution. If dynamical mean fluctuations are present, both measures are finite and positive. However, also (anti-) correlations in momentum space cause non-vanishing values. Long-range correlations occur as a consequence of energy and momentum conservation, while Bose and Fermi statistics, final state interactions, and experimental effects such as the finite two-track resolution are the origin of short-range correlations. Since such correlations mask the true fluctuation signal, it is crucial to investigate their contribution to Eq. (8) and Eq. (10) quantitatively, as will be described in Section 4.
The best way for a quantitative determination of mean fluctuations is clearly the use of a dimensionless measure. In addition, a comparison between different experiments should be possible. In this context we note that is neither dimensionless nor independent of the event multiplicity. This makes a comparison between experiments and to theory difficult because the multiplicity depends on the acceptance window of the experiment and on beam energy. Since different contributions to the fluctuation signal have different multiplicity dependences, the multiplicity dependence of is a priori unknown.
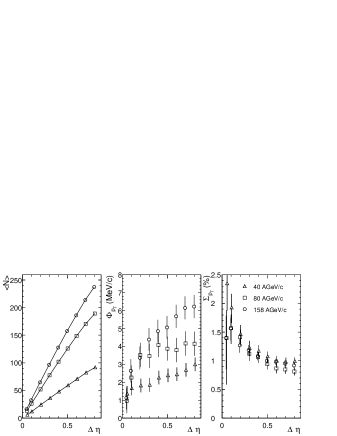
In Fig. 2 (left panel) the mean multiplicity is shown as function of the size of the pseudorapidity acceptance window at 40, 80, and 158 A GeV/. The much smaller multiplicity at 40 A GeV/ is related to the smaller azimuthal fiducial window in this data set. The measure , shown in Fig. 2 (middle panel), exhibits a strong dependence on and beam energy. However, comparison to the left panel in Fig. 2 indicates that this dependence is strongly correlated with the change in mean multiplicity. In contrast, the normalized dynamical fluctuation changes very little with beam energy, as shown in Fig. 2 (right panel). The increase of towards small may be attributed to physical correlations occuring on small scales. These contributions appear to vanish at and does not any longer depend on , although the multiplicity is still increasing111 We have checked that the definition of in terms of the mean of covariances and the definition in Eq. (10) lead to the same results for within statistical errors, also for small multiplicities. In particular, the dependence on is observed using both definitions. . This suggests that is a more universal measure of fluctuations and it will be mainly used in the present work. In Section 4 we will discuss the implications of the results presented in this figure.
3.3 Study of systematic uncertainties
In this subsection, we briefly summarize the different contributions to the systematic uncertainties of the fluctuation measurements presented below. The contributions to the systematic errors of the mean fluctuation measurements are listed in Table 2.
Biases due to our analysis chain have been evaluated
with the help of the urqmd (version 1.1) event generator [20]
(without rescattering), which exhibits mean
fluctuations
of similar magnitude as observed in the data. The generated
events were processed through a full Monte Carlo simulation
of the detector using the detector simulation package geant [21]
including signal digitization,
and analyzed by our reconstruction software applying all cuts
listed before.
No significant bias on the initial fluctuation
signal was observed after event reconstruction.
This implies also that a small remaining contribution of secondary particles
does not alter the fluctuation signal.
The systematic uncertainty due to the finite tracking
efficiency was evaluated using the same Monte Carlo chain
as before.
The number reported in Table 2
corresponds to the change of the reconstructed
when randomly
a fraction of the tracks (up to 20%) is artificially
removed from the sample.
The estimated tracking efficiency in real data is 90%.
An online before- and after-protection of s
against a second beam particle was applied during data
taking. In the offline analysis, we systematically increased
this protection to s via event selection
but found very little effect on the reconstructed value
of .
The absolute momentum scale of the spectrometer has been verified
by the peak position of the invariant mass distributions of
reconstructed and decays [22].
At the present stage of the calibration, the uncertainty of the
absolute momentum scale is at most in .
We have artificially shifted of each reconstructed
track by a constant offset to study the effect of this uncertainty.
As a test of the long-term stability of the momentum scale
we divided our events into subsamples which were taken close
in time and analyzed them separately. After proper
calibration the results of the subsamples were consistent
with each other and with the result of the full data set.
The impact of the azimuthal fiducial cut in the 40 A GeV/
data set
was studied by applying the same cut to the 158 A GeV/ data
and comparison to the full acceptance result.
We found that the contribution of the fiducial cut to
the final result is very small.
The inclusion of SDD track information leads to a powerful rejection
of non-vertex tracks, if only TPC tracks with a match
to the SDD are used in the analysis.
We compared the fluctuation results with and without
use of the SDD in the 158 A GeV/ data set.
From the difference we estimated the systematic uncertainty
if SDD information is not used.
Since SDD information is not
available for all data sets, we used TPC tracks
only for all final results presented below and included
the uncertainty into the systematic error, assuming it is the
same at all beam energies.
The systematic contribution of track quality cuts
was investigated by variation of these cuts (, vertex) within
reasonable limits. The observed effect on the reconstructed value
of was also included into the systematic error.
We developped a strategy to remove from our data set
contributions of short-range correlations (SRC)
which may alter the measured fluctuation signal.
The occurence of short-range correlations
is due to quantum statistics, final state
Coulomb interactions and the finite two-track resolution.
The systematic uncertainty introduced by this procedure
is also listed in Table 2. For a detailed
description of the procedure see Section 4.
The sum of all systematic uncertainties reported in Table 2 is small compared to the experimentally observed values of .
| 40 A GeV/ | 80 A GeV/ | 158 A GeV/ | |
|---|---|---|---|
| Tracking efficiency | % | % | % |
| Beam pile-up | % | % | % |
| Absolute momentum scale | % | % | % |
| Azimuthal fiducial cut | % | - | - |
| Non-vertex track contribution | % | % | % |
| , vertex cut | % | % | % |
| SRC removal | % | % | |
| Total (no SRC removal) | % | % | % |
| Total (with SRC removal) | % | % | % |
4 Results on mean fluctuations
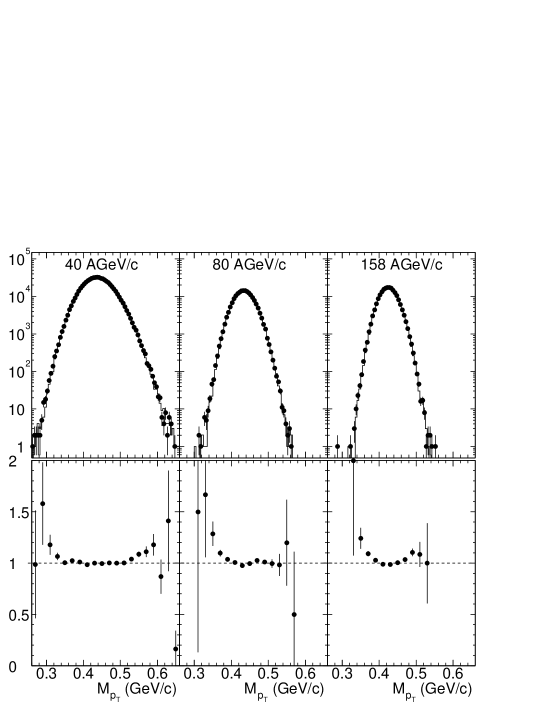
We obtain a first qualitative hint for the presence of non-statistical mean fluctuations by an investigation of the event-by-event mean distributions as shown in Fig. 3. The larger width at 40 A GeV/ is a consequence of the smaller azimuthal fiducial window and hence smaller multiplicity in this data set. We compare the event-by-event mean distributions to reference distributions obtained by event mixing. The mixed events are constructed from particle momenta randomly chosen from data events of the same centrality class. Only one particle per measured event is used for a given mixed event, and the multiplicity distribution of mixed events is generated by sampling that of the data events. We calculated and for the mixed event samples and found them to be consistent with zero within statistical errors at all three beam energies.
The mixed event mean distributions exhibit a Gamma distribution shape [23]. The subtle but clearly significant differences between the data and mixed event distributions are emphasized in Fig. 3 (bottom), where the ratio of the two is shown. The real event distributions are slightly wider, indicating a small but finite non-statistical contribution to the mean fluctuations at all three energies. A preliminary account of these results was presented in [24].
Before we turn to a quantitative analysis of the observed non-statistical fluctuations, we discuss the effect of short-range correlations, which are not present in our mixed event sample but which may contribute to the fluctuation signal. Physical short-range correlations are caused by Bose-Einstein quantum statistics and the final state Coulomb interaction; detector effects such as the finite two-track resolution lead to anti-correlations due to track merging.
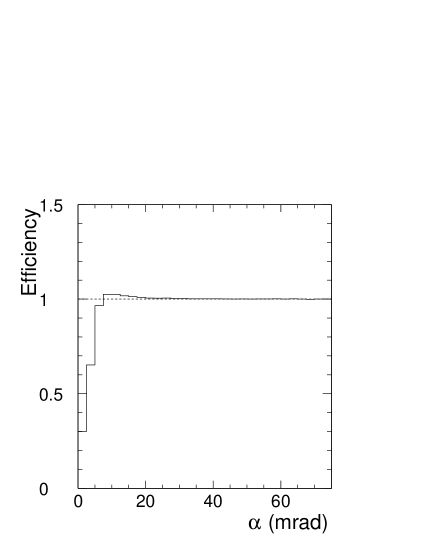
In Fig. 4 we present the opening angle distribution of particle pairs detected in the TPC divided by the corresponding mixed-event distribution. The resulting two-track detection efficiency is normalized to unity at large opening angles . The slight increase towards smaller can be attributed to small angle correlations such as Bose Einstein correlations and flow. At mrad the efficiency drops due to track merging.
It was demonstrated by NA49 [7] that the effects of Bose-Einstein correlations and two-track resolution on the fluctuation signal quantitatively cancel in their data set. In general, this is not necessarily the case but rather depends on the details of the momentum range under investigation, the bending power of the spectrometer and the two-track resolution.
Short-range correlations show up at small momentum differences and can be investigated by a study of the two-particle correlation function . The four-momentum difference is the momentum difference in the pair rest frame, where and are the differences in three-momentum and energy of a particle pair assuming the pion mass for each particle. A systematic analysis of the two-pion correlation functions at SPS energies has been presented in [25].
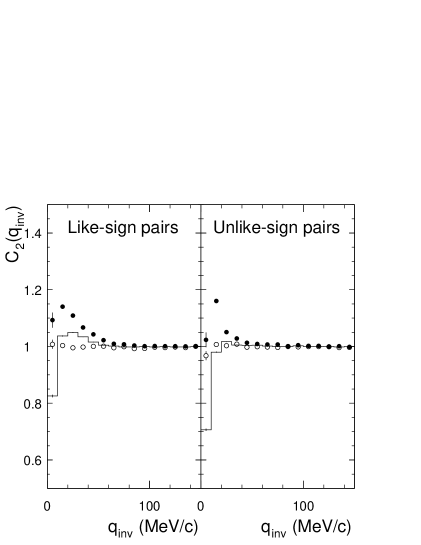
The raw correlation functions for pairs of like-sign and unlike-sign charged particles in 158 A GeV/ are shown as histograms in Fig. 5. The like-sign pairs show a positive correlation at MeV/c due to Bose-Einstein statistics in the pion-dominated sample. At very small , we observe an anti-correlation caused by the final state Coulomb repulsion and the finite two-track resolution. For the unlike-sign pairs, the positive correlation arises due to Coulomb attraction, and is again suppressed by the two-track resolution at small . As a reference, we also constructed the correlation functions for signal and background pairs with opening angles mrad (full dots in Fig. 5). These correlation functions are free of distortions from the finite two-track resolution but suffer from poor statistics at small .
Based on the experimental two-track resolution and the measured correlation functions , a procedure was applied to remove contributions from short-range correlations on the observed fluctuation signal. The procedure implies a small modification of the measured events. To account for the two-track resolution, artificial tracks are added, and a small number of tracks from real pairs are removed to suppress the positive correlation at small . After the procedure, the correlation functions are flat, as indicated by the open symbols in Fig. 5. From the modified events the fluctuation signal is calculated, which is then expected to be free of contributions from short-range correlations. The details of the procedure are described below.
In a first step tracks are randomly added to form, with existing tracks, small opening angle pairs according to the observed two-track reconstruction efficiency. The probability to add a track at a given is determined from the distribution presented in Fig. 4 and constrained by the strength of the reference correlation function of pairs with mrad in Fig. 5. The fraction of artificially added tracks is a few percent, and their transverse momenta are randomly chosen from tracks of different events of the same centrality class.
In a second step, positive correlations are eliminated by removal of tracks from small pairs. The probability to remove a track is based on the measured reference correlation function . We define, for each pair of particles from the same event, the probability to reject randomly one of the particles:
where is the reference correlation function of pairs with mrad and is a parameter tuned for like-sign and unlike-sign pairs separately. After both steps, the obtained correlation functions are flat, as indicated by the open circles in Fig. 5, for typical values of around -.
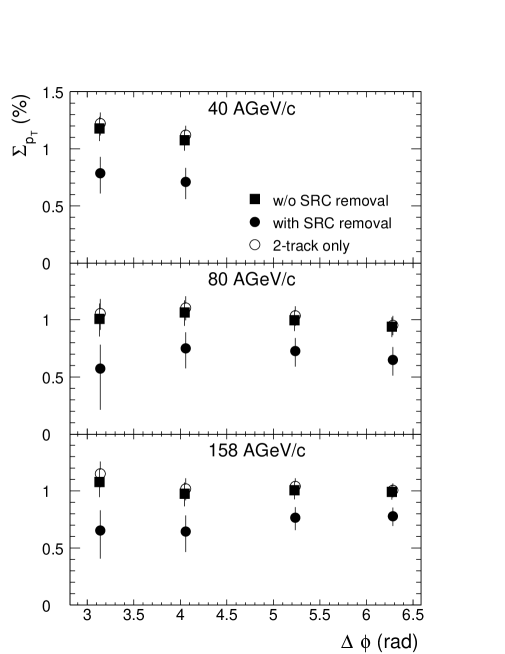
In Fig. 6 is presented the normalized dynamical fluctuation in central Pb-Au events at 40, 80, and 158 A GeV/ as function of the size of the azimuthal acceptance window . The filled squares show the result for the unmodified events. If additional tracks are added to compensate for the two-track resolution, the results increase very slightly, as indicated by the open symbols. The filled dots show the results after the full SRC removal, which contains the compensation for the two-track resolution and the suppression of correlated small pairs. The contributions from both effects do not cancel but lead to a reduction of by % compared to the values obtained from unmodified events. The systematic errors of the correction procedure have been estimated to be less than 0.05% (absolute) in most cases by variation of the probabilities to add or reject a track within reasonable limits. They are small compared to the overall systematic uncertainties discussed before (see Table 2).
Note that the azimuthal acceptance of the 40 A GeV/ data set is limited, but no significant change of the fluctuation strength is observed when going from limited to full acceptance at the higher beam energies. This observation is the basis of the estimate of the systematic error introduced by the limited acceptance at 40 A GeV/ as discussed in Section 3.3. This implies also that azimuthal anisotropies of the particle distribution, such as elliptic flow, have little effect on the observed fluctuation strength.
As a consistency check of the SRC removal procedure we applied the subevent method [19] to calculate the fluctuation . If the subevents are based on a random selection of tracks from a given event, the observed fluctuation is consistent with the result obtained by our standard method using Eq. (10) without SRC removal. The contribution from short range correlations can be estimated if the subevents are separated in pseudorapidity. We have chosen the pseudorapidity ranges and for subevents 1 and 2, respectively. In this case, the observed mean fluctuations are reduced compared to the case of random subevents, and consistent with those obtained using our previously described method for SRC removal.
To facilitate a comparison of the data to models, which generally do not contain short-range correlations, only the results after SRC removal are shown below. A compilation of all results before and after SRC removal can be found in Table 3 and in Appendix A.
In Fig. 7 the normalized dynamical fluctuation is shown as function of the centrality of the collision at three different beam energies. The centrality is expressed in terms of the average number of participating nucleons in a given centrality bin. We observe that, at all energies, the dynamical fluctuation is comparable in strength and decreases with centrality by approximately 40% from about 1.3% to 0.7% over the centrality range under investigation.
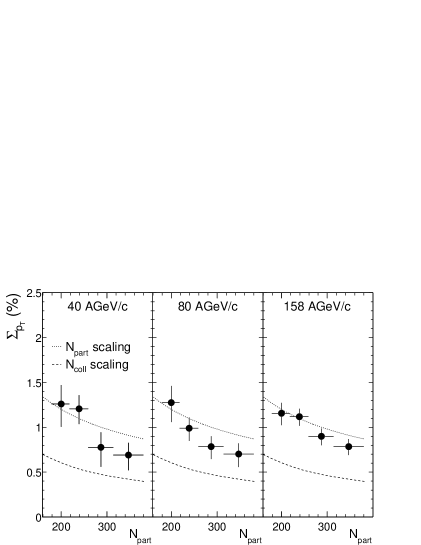
In this context, it is interesting to compare the present results to measurements in hadron-hadron collisions. In interactions particles are produced in a correlated way which leads to large non-statistical fluctuations. At the ISR, dynamical mean fluctuations have been measured in reactions at GeV [9]. Independent of beam energy, a value of 12% was observed for . In reactions, the observed dynamical fluctuation is reduced to about 9%. This was stated in [9] to be consistent with the larger average number of nucleon-nucleon interactions in of about 1.8. Under the assumption of an incoherent superposition of independent nucleon-nucleon collisions, is expected to scale with :
| (13) |
Use of this expression to extrapolate from the dynamical fluctuation of 12% observed in () to Pb-Au yields values of about 0.4% for the most central events. These extrapolated numbers are significantly below the data, as shown in Fig. 7, indicating that A-A collisions at SPS energies are not a straight superposition of nucleon-nucleon collisions also in this observable.
A different approach is a possible scaling with charged particle multiplicity:
| (14) |
Since the number of charged particles was found to scale close to linear with the number of participants at SPS [26, 27, 28], we replace by :
| (15) |
A comparison of Eq. (15) to our data is indicated by the dotted curve in Fig. 7. Although our data are at still somewhat smaller than explored in [9], we find that the magnitude of the fluctuation strength observed in Pb-Au is similar to the extrapolation from , if multiplicity scaling is assumed.
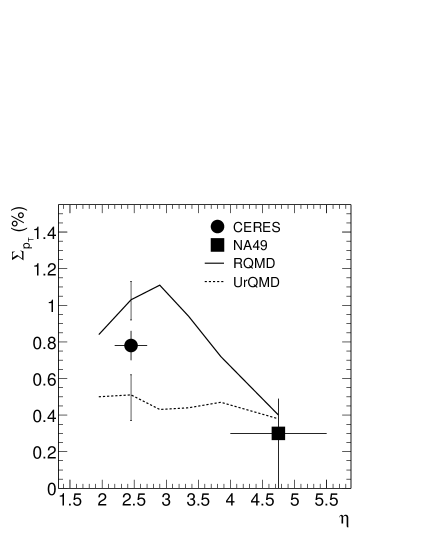
In Fig. 8 we compare our mid-rapidity result for in central Pb-Au collisions at 158 A GeV/ to the measurement from NA49 obtained at forward rapidity [7]. The NA49 result for [7] was used to evaluate using Eq. (11). While the mean fluctuations measured at forward rapidity are consistent with zero, we observe a finite value of about 0.8% at mid-rapidity. Also shown are calculations from the rqmd [29] and urqmd [20] event generators. While the fluctuations observed in urqmd are small at all rapidities, rqmd exhibits a pronounced rapidity dependence which qualitatively describes the trend observed in the data. However, the rqmd absolute value around mid-rapidity is about 20% larger than that observed in the data.
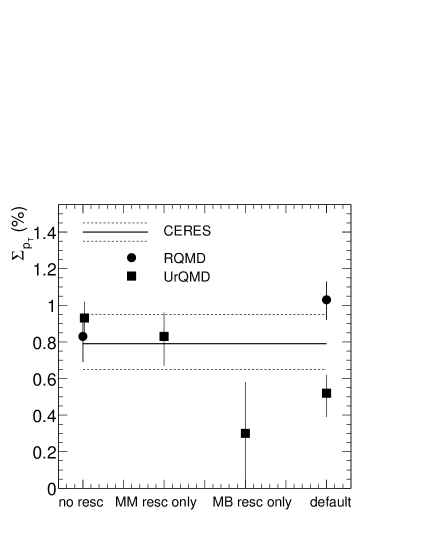
The magnitude of mean transverse momentum fluctuations from rqmd and urqmd was studied in more detail, as shown in Fig. 9. We compare our result for in central 158 A GeV/ Pb-Au collisions to calculations from both models at . Different mechanisms included in the models have been investigated separately. If hadronic rescattering is switched off, both models show reasonable agreement with the data. In rqmd, the inclusion of rescattering leads to an increase of fluctuations. This behaviour is not understood and needs further investigation. In urqmd, the inclusion of meson-meson rescattering has very little effect on the observed fluctuations, however, inclusion of meson-baryon rescattering reduces the fluctuations considerably. If both rescattering modes are included in urqmd (labelled ’default’ in the figure), urqmd falls below the data. We checked that also at 40 and 80 A GeV/ the agreement between data and urqmd without rescattering is reasonable, while inclusion of rescattering in urqmd leads to a significant reduction of . At 40 A GeV/, rescattering leads even to negative values for . This indicates that secondary meson-baryon scattering has a strong effect on the observed fluctuation strength, and might be over-estimated in urqmd. It should be emphasized that the evaluation of event-by-event fluctuations may provide important information about the dynamics of the system which can not be derived from inclusive observables.
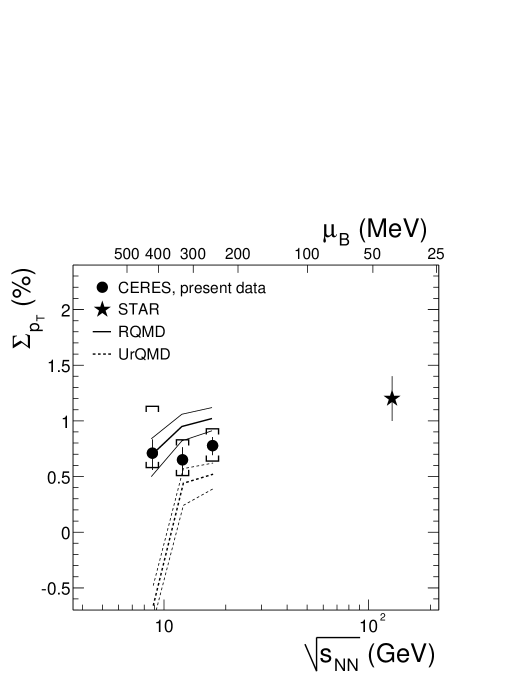
A compilation of the normalized dynamical fluctuation measured at mid-rapidity and at different beam energies is shown in Fig. 10. The upper scale indicates the baryon chemical potential at chemical freeze-out, related to via a phenomenological parametrization given in [30]. The data point shown at GeV is from the STAR experiment at RHIC [31] and measured over a somewhat wider range ( GeV/). A measurement by PHENIX [32] yields % and is consistent within its larger error.222The measure was calculated using the PHENIX measurement for and from [32] and the approximation . At the SPS, the normalized dynamical fluctuation is about 0.7%, while larger fluctuations of 1.2% are observed at RHIC. The STAR data are not corrected for the contribution of short-range correlations, however, the effect was estimated to be small (less than 10%) [31]. The evolution of with beam energy looks smooth and does not show any indication of unusually large fluctations at any beam energy.
Models predict enhanced mean fluctuations if the system has passed close to the critical point of the QCD phase diagram. At SPS energies and for the finite rapidity acceptance window of the CERES experiment, the fluctuations should reach values of about 2%, i.e. more than three times larger than observed in the present data333 The predicted fluctuations in the measure in [13] corresponds to about 2% in in the CERES acceptance [33]. . Most important, no indication for a non-monotonic behaviour as function of the beam energy has been observed. This suggests that the critical point may not be located in the regime below 450 MeV.
The results from rqmd and urqmd show rough agreement with the data, except for the urqmd calculation at 40 A GeV/ where is negative (see Fig. 10). We note that a positive value of is obtained from urqmd at 40 A GeV/, if rescattering is switched off.
| Beam momentum (A GeV/) | |||
|---|---|---|---|
| (%) | |||
| (no SRC removal) | |||
| (with SRC removal) | |||
| (MeV/) | |||
| (no SRC removal) | |||
| (with SRC removal) | |||
| 618958 | 186272 | 199304 | |
| (MeV/) | |||
| (MeV/) | |||
| (MeV/) |
Mean transverse momentum fluctuations can be related to event-by-event fluctuations of the temperature. The following expression was given in [34]:
| (16) |
where is the average temperature which fluctuates event by event with a standard deviation . To derive an upper limit for the temperature fluctuations, it is assumed that the full magnitude of the observed mean fluctuations after removal of short-range correlations is due to temperature fluctuations. For a temperature MeV, values for of 1.40.3 MeV, 1.30.3 MeV, and 1.50.2 MeV are obtained in the 6.5% most central events at 40, 80, and 158 A GeV/, respectively. For MeV, the results are smaller by about 15%. We conclude that event-by-event temperature fluctuations are at most 1% of the average temperature. Such small numbers point to a large degree of thermalization of the system. We note that small temperature fluctuations are expected also in the case of complete thermalization [11, 34] and may in that case be used to determine the heat capacity of the system [34].
5 Conclusions
We have presented event-by-event fluctuations of the mean transverse momentum in Pb-Au collisions at 40, 80, and 158 A GeV/. In central events at these beam energies, significant non-statistical positive mean fluctuations are observed. Based on the measured two-particle correlation functions and the experimental two-track resolution a procedure was derived which accounts for the contributions of short-range correlations present in the data. This procedure reduces the observed mean fluctuations by 20-35% but they remain significantly different from zero. At all beam energies, we find for the normalized dynamical fluctuation values of about 0.7% of the mean . These results at mid-rapidity are complementary to previous measurements at 158 A GeV/ in the forward hemisphere () where no significant non-statistical fluctuations were found [7].
The present mid-rapidity results at SPS are somewhat smaller than the values measured by STAR at GeV. The existing data from different beam energies do not exhibit an indication for unusually large fluctuations or a non-monotonic behaviour, which might have pointed to the crossing of the critical point of the QCD phase diagram somewhere in this range of beam energy or baryon chemical potential [13]. Further studies at lower beam energies are needed for a full exploration of the QCD phase diagram.
At all three beam energies under investigation we observe a systematic decrease of the mean fluctuation strength with increasing centrality of the collision. Based on measurements of non-statistical mean fluctuations in -collisions at the ISR we find that the centrality dependence of mean fluctuations in Pb-Au is consistent with an extrapolation from , assuming that mean fluctuations scale with . This may suggest that the fluctuation pattern is not reduced strongly by potential rescattering of hadrons after hadronization. A comparison to results from the rqmd and urqmd models indicates that secondary rescattering, if enabled, tends to decrease the fluctuation strength, while calculations without rescattering show reasonable agreement with the data. Such a scenario is supported by the observation of high densities and a short mean free path at thermal freeze-out, as derived from a recent analysis of pion interferometry data [35], which point to a short lifetime of the hadronic phase. This issue needs further investigations of smaller collision systems and minimum bias Pb-Au data, as well as more detailed model studies.
6 Acknowledgements
The CERES collaboration acknowledges the good performance of the CERN PS and SPS accelerators as well as the support from the EST division. We are grateful for excellent support for the central data recording from the CERN IT division. We wish to thank K. Rajagopal, M.A. Stephanov, and S. Voloshin for valuable discussions. This work was supported by the German BMBF, the U.S. DoE, the Israeli Science Foundation, and the MINERVA Foundation.
References
-
[1]
F. Karsch, E. Laermann, and A. Peikert, Nucl. Phys. B 605 (2001) 579;
C. Schmidt, et al., hep-lat/0209009. - [2] Z. Fodor and S.D. Katz, Phys. Lett. B 534 (2002) 87; J. High Energy Phys. 0203 (2002) 014.
- [3] C.R. Allton, et al., Phys.Rev. D 66 (2002) 074507.
- [4] J. Berges and K. Rajagopal, Nucl. Phys. B 538 (1999) 215.
- [5] M.A. Halasz, A.D. Jackson, R.E. Shrock, M.A. Stephanov, and J.J. Verbaarschot, Phys. Rev. D 58 (1998) 096007.
-
[6]
M. Alford, K. Rajagopal, and F. Wilczek, Phys. Lett. B 422 (1998) 247;
R. Rapp, T. Schäfer, E.V. Shuryak, and M. Velkovsky, Phys. Rev. Lett. 81 (1998) 53. - [7] NA49 Collaboration, H. Appelshäuser, et al., Phys. Lett. B 459 (1999) 679.
- [8] NA49 Collaboration, S.V. Afanasiev, et al., Phys. Rev. Lett. 86 (2001) 1965.
- [9] K. Braune, et al., Phys. Lett. B 123 (1983) 467.
- [10] M. Gaździcki and S. Mrówczyński, Z. Phys. C 54 (1992) 127.
- [11] M. Gaździcki, A. Leonidov, and G. Roland, Eur. Phys. J. C 6 (1999) 365.
- [12] M.A. Stephanov, K. Rajagopal, and E.V. Shuryak, Phys. Rev. Lett. 81 (1998) 4816.
- [13] M.A. Stephanov, K. Rajagopal, and E.V. Shuryak, Phys. Rev. D 60 (1999) 114028.
- [14] A. Dumitru and R. Pisarski, Phys. Lett. B 504 (2001) 282.
- [15] S. Mrówczyński, Phys. Lett. B 314 (1993) 118.
- [16] F. Karsch, private communication, to be published.
-
[17]
CERES Collaboration, G. Agakichiev, et al., Eur. Phys. J. C 4 (1998) 231;
CERES Collaboration, G. Agakichiev, et al., Eur. Phys. J. C 4 (1998) 249. - [18] K. J. Eskola, K. Kajantie, and J. Lindfors, Nucl. Phys. B 323 (1989) 37, for implementation see http://www.gsi.de/~misko/overlap.
- [19] S. Voloshin, V. Koch, and H. Ritter, Phys. Rev. C 60 (1999) 024901.
-
[20]
S.A. Bass, et al., Prog. Part. Nucl. Phys. 41 (1998) 225;
M. Bleicher, et al., J. Phys. G: Nucl. Part. Phys. 25 (1999) 1859. - [21] GEANT, Detector Description and Simulation Tool, CERN Program Library Long Writeup W5013.
- [22] H. Tilsner, Ph.D. Thesis, University of Heidelberg (2002).
- [23] M. Tannenbaum, Phys. Lett. B 498 (2001) 29.
- [24] CERES Collaboration, H. Appelshäuser, et al., Nucl. Phys. A 698 (2002) 253c.
- [25] CERES Collaboration, D. Adamová, et al., Nucl. Phys. A 714 (2003) 124.
- [26] WA98 Collaboration, M.M. Aggarwal, et al., Eur. Phys. J. C 18 (2001) 651.
- [27] CERES Collaboration, D. Miśkowiec, et al., in: Proceedings of the International Workshop XXX on Gross Properties of Nuclei and Nuclear Excitations, Hirschegg, Austria, January 13-19, 2002.
- [28] WA97 Collaboration, W. Andersen, et al., Phys. Lett. B 449 (1999) 401.
- [29] H. Sorge, Phys. Rev. C 52 (1995) 3291.
- [30] P. Braun-Munzinger, J. Cleymans, H. Oeschler, and K. Redlich, Nucl. Phys. A 697 (2002) 902.
- [31] STAR Collaboration, S. Voloshin, et al., Talk given at International Nuclear Physics Conference (INPC 2001): Nuclear Physics and the 21st Century, Berkeley, California, 30 Jul - 3 Aug 2001. Published in: ”Berkeley 2001, Nuclear physics in the 21st century” 556. nucl-ex/0109006.
- [32] PHENIX Collaboration, K. Adcox, et al., Phys. Rev. C 66 (2002) 024901.
-
[33]
M.A. Stephanov, Phys. Rev. D 65 (2002) 096008;
M.A. Stephanov, private communication. - [34] R. Korus, S. Mrówczyński, M. Rybczyński, and Z. Włodarczyk, Phys. Rev. C 64 (2001) 054908.
- [35] CERES Collaboration, D. Adamová, et al., Phys. Rev. Lett. 90 (2003) 022301.
Appendix A Summary of mean fluctuations
In this appendix the results of mean fluctuations in Pb-Au collisions at 40, 80, and 158 A GeV/ and different centrality classes are summarized. The results for and are listed before and after removal of short range correlations (SRC). They contain statistical and systematic errors. All other parameters are before SRC removal and statistical errors only are shown.
| Centrality | % | % | % | % |
|---|---|---|---|---|
| (%) | ||||
| (no SRC removal) | ||||
| (with SRC removal) | ||||
| (MeV/) | ||||
| (no SRC removal) | ||||
| (with SRC removal) | ||||
| 495951 | 396868 | 327473 | 214202 | |
| (MeV/) | ||||
| (MeV/) | ||||
| (MeV/) |
| Centrality | % | % | % | % |
|---|---|---|---|---|
| (%) | ||||
| (no SRC removal) | ||||
| (with SRC removal) | ||||
| (MeV/) | ||||
| (no SRC removal) | ||||
| (with SRC removal) | ||||
| 135075 | 161036 | 137261 | 45647 | |
| (MeV/) | ||||
| (MeV/) | ||||
| (MeV/) |
| Centrality | % | % | % | % |
|---|---|---|---|---|
| (%) | ||||
| (no SRC removal) | ||||
| (with SRC removal) | ||||
| (MeV/) | ||||
| (no SRC removal) | ||||
| (with SRC removal) | ||||
| 151191 | 153713 | 137414 | 102787 | |
| (MeV/) | ||||
| (MeV/) | ||||
| (MeV/) |