Event by event Net Charge Fluctuations
Abstract
We present analyses of event-by-event dynamical net charge fluctuations measured in130 and 200 GeV Au Au collisions with the STAR detector. The dynamical net charge fluctuations are evaluated using the observable. Dynamical fluctuations measured in Au Au collisions at 130 and 200 GeV are finite, and exceed charge conservation limits. They deviate from a perfect 1/N scaling and provide an indication that the collision dynamics varies with collision centrality.
1 Introduction
Measurements of fluctuations of conserved quantities such as the electrical charge, baryonic, and strangeness numbers emerge as a new tool to probe the final state of relativistic heavy ion collisions. They may be used to estimate the degree of equilibration and criticality of measured systems. As a specific case, we present measurements of dynamical net charge fluctuations performed with the STAR detector for 130 and 200 GeV Au Au collisions.
Measurements of dynamical net charge fluctuations were performed using the defined as :
| (1) |
where expresses an event average of the quantity ; and are respectively the multiplicity of positive and negative charge particles measured in a given kinematic range. The properties of were discussed in details in [1]. It is directly related to integrals of two-particle densities. Identically zero for uncorrelated (Poissonian) particle production, it can in principle be either positive or negative. Negative values are however expected from +- pair correlations resulting from charge conservation, resonance production, etc. Values of are furthermore expected to exhibit an approximate , with being the number of particle production sources in AA collisions. This scaling shall translate in a perfect 1/N scaling (N being the total charge particle multiplicity) if the collision dynamics is independent of the collision centrality. is a robust observable and its use is thus preferred to observables and used in various theoretical works [1, 2, 3, 4, 5].
2 Measurement
The data presented are from minimum-bias samples of Au + Au collisions at and GeV acquired by the STAR experiment during the first two years of operation of the Relativistic Heavy Ion Collider. Detailed descriptions of the experiment and the Time-Projection-Chamber (TPC) can be found elsewhere [8]. Events were triggered by a coincidence between the two Zero Degree Calorimeters (ZDCS) located +/- 18 m from the interaction center and a minimum signal in the Central Trigger Barrel (CTB), which consists of scintillator slats surrounding the TPC. The analysis was restricted to events produced within m (130 GeV data analysis) and m (200 GeV) of the center of the STAR TPC along the beam axis. In this range, the vertex finding efficiency is 100% for collisions which result in charged particle multiplicities larger than 50 tracks in the TPC acceptance. It decreases to 60% for events with fewer than 5 tracks from the primary vertex. Samples of respectively 180000 and 700000 minimum-bias events from the 130 and 200 GeV runs were used in this analysis after cuts. The centrality of the collisions is estimated from the total charged particle track multiplicity detected within the TPC in the pseudorapidity range . The fluctuations studies presented in this report are obtained for a pseudorapidity range . Good track quality is required by restricting the analysis to charge particle tracks producing more than 15 hits within the TPC. One additionally requires that more than 50% of the hits be included in the final fit of the track.
We present, in Figure 1(a), our measurements of the dynamical net charge fluctuations, , in Au Au collisions at 130 and 200 GeV as a function of the total charged particle multiplicity measured in the STAR TPC within the pseudorapidity range . The values of are finite and negative implying charged particle productions are correlated in these Au+Au collisions. We find the 130 and 200 GeV results exhibit the same dependence on total charge particle multiplicity and nearly equal magnitude at any given centrality. This suggests the charge particle correlation has a rather small beam energy dependence. Note that a similar conclusions was achieved based on detailed studies of two-particle correlations performed for and collisions conducted at FNAL and ISR[9, 10, 11].
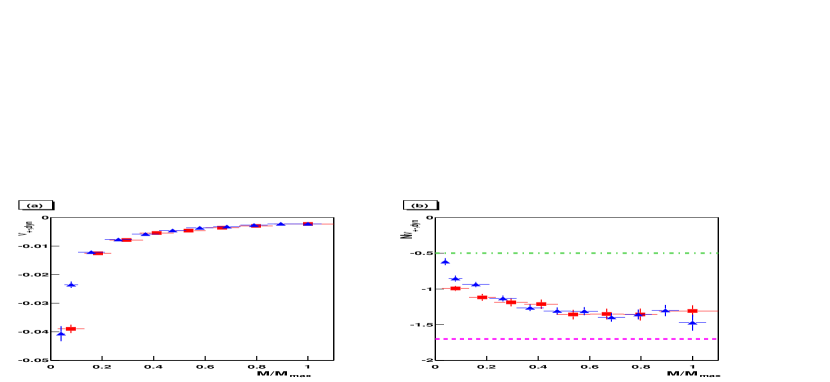
(b)Scaled dynamical net charge fluctuations measured for vs relative charged particle multiplicity in . The dot-dash line indicates the charge conservatin value whereas the dash line corresponds to a thermalized resonance gas.
We first consider the fraction of the dynamical net charge fluctuations arising from charge conservation. From ref.[1], we determine the charge conservation (c.c.) contribution to amount to with N the total produced charge particle multiplicity.
We use the measurement of total charged particle multiplicity in the rapidity range reported by the PHOBOS collaboration as an estimate of the total charge production at GeV. We further estimate the total production at 200 GeV to be larger by a factor of order based on the ratio of multiplicities in the rapidity range also reported by PHOBOS[13]. We thus expect the charge conservation contributions to be of order and at 130 and 200 GeV respectively. The values measured for 5% central collisions amount to and respectively. The charge conservation contributions thus represent only 40% and 37% respectively of the observed correlations. We next compare the strength of the measured correlation to the maximum value one can expect for maximally correlated particle production. This situation arises when event by event. The maximum value of amounts to where is the total charged particle multiplicity in the measured kinematic range. STAR measured dn/dy = 523 for 5% central collisions at 130 GeV implying the maximum value of at this energy is of the order of -0.0076. The measured values amount to roughly 30% of this maximal value. Particle production correlations are thus indeed large in comparison to both the charge conservation contribution and the maximum value expected given the observed multiplicities.
We next discuss the centrality dependence of the dynamical fluctuations. The magnitude of is expected to vary as the inverse of the number of sub collisions leading to the production of particles. If the number of particles produced by such sub-collisions is independent of the collision centrality, should exhibit a strict 1/N scaling. We test for such a behavior by plotting, in Figure 1(b), as a function of the total relative charged particle multiplicity M detected in the pseudorapidity interval . Both and are measured in the interval . Measured multiplicities are corrected for finite detection efficiency. The efficiency is largest for small TPC occupancies and decreases monotonically by 10% at the largest multiplicities. The 130 GeV (square) and the 200 GeV (triangle) data exhibit similar collision centrality dependence. The 200 GeV result, based on a larger event sample, confirms the result reported for 130 GeV data in [7] that the 1/N scaling is violated.
The magnitude of the measured increases monotonically by a factor of 1.5-2 from peripheral collisions to central collisions. By contrast, simulations with HIJING, shown in Figure 2, exhibit a signal independent of the collision centrality. This behavior is expected because HIJING essentially models collisions as a superposition of independent nucleon-nucleon interactions. UrQMD simulations shown in Figure 3, on the other hand, include re-scattering effects and exhibit a clear centrality dependence[14]. One finds however the re-scattering effects included in UrQMD cause a reduction of the magnitude for central collisions rather than an increase as seen in the experimental data.
![[Uncaptioned image]](/html/nucl-ex/0304021/assets/x2.png) Fig. 2.: Calculation of vs based on
HIJING simulations of Au + Au collisions at GeV. Data plotted are
for (circle), and (square).
Fig. 2.: Calculation of vs based on
HIJING simulations of Au + Au collisions at GeV. Data plotted are
for (circle), and (square).
![[Uncaptioned image]](/html/nucl-ex/0304021/assets/x3.png) Fig. 3.: Calculation of vs based on
UrQMD simulations of Au + Au collisions at GeV. Data plotted are
for (square), (circle), and (triangle).
Fig. 3.: Calculation of vs based on
UrQMD simulations of Au + Au collisions at GeV. Data plotted are
for (square), (circle), and (triangle).
We investigate the origin of measured centrality dependence by comparing our data to predictions based on thermal models [2, 3, 4, 5]. To this end, we express our measurement of in the range in terms of the variable introduced in [4], using
| (2) |
valid for [1]. We find using data shown in Fig. 1(b) that decreases from (statistical error only) for the most peripheral collisions measured to in central collisions. A comparison to thermal model predictions requires the data to be corrected for charge conservation effects. One must subtract the charge conservation contribution which amounts to . The corrected values of range from in most peripheral collisions to in most central collisions. The large value measured in peripheral collisions indicates the net charge fluctuations are essentially Poissonian whereas a sizable correlation is measured in central collisions. According to discussions of Refs.[2, 3, 4, 5], values measured in central collisions approach that () expected for a resonance. They are however significantly larger than expected in the above referenced work [3, 4, 5] for a quark-gluon gas undergoing fast hadronization and freeze-out (). It is not possible to draw a firm conclusion concerning the existence or non-existence of a deconfined phase during the collisions from these results since, as the above authors have pointed out, incomplete thermalization could lead to larger fluctuations than expected for a QGP. The observable centrality dependence might nonetheless be interpreted as suggesting an increased degree of thermalization is reached in most central collisions relative to more peripheral collisions.
3 Conclusions
We have measured event-by-event net charge dynamical fluctuations for inclusive non-identified charged particles in Au+Au collisions at GeV and GeV. Dynamical fluctuations are finite and exceed by nearly a factor of two expectations based on charge conservation. The violation of the 1/N scaling first observed with the 130 GeV dataset is seen and confirmed with better statistical accuracy by data of the 200 GeV dataset. Comparison of our measurement with thermal model predictions [3, 4, 5] indicate fluctuations, in central collisions, are at a level that might be expected if the Au+Au system behaved like a (thermalized) resonance gas. The observed collision centrality dependence thus suggests that an increased degree of thermalization takes place in central collisions relative to that achieved in the most peripheral collisions measured in this worked. Note finally that although the size of the measured fluctuations is significantly larger than expected by Koch et al. for a quark-gluon gas, limitations of the model used prevent a definitive conclusion on the existence or non-existence of a quark-gluon plasma phase based on current results.
Acknowledgment
The author thanks S. Gavin and M. Abdel Aziz for supplying HIJING and UrQMD simulation data.
References
- [1] C. Pruneau, S. Gavin, and S. Voloshin, Phys. Rev. C66 (2002) 044904.
- [2] M. Asakawa, U. Heinz, B. Mueller,Phys. Rev. Lett.85 (2000) 2072.
- [3] S. Jeon, V. Koch,Phys. Rev. Lett.83 (1999) 5435.
- [4] S. Jeon, V. Koch,Phys. Rev. Lett.85 (2000) 2076.
- [5] V. Koch, M. Bleicher, S. Jeon, Nucl.Phys. A698(2002) 261.
- [6] C. Pruneau et al. (STAR Collaboration) , Poster presented at Quark Matter Conference 2002, Nantes, France
- [7] C. Pruneau et al. (STAR Collaboration) , to be submitted to Phys. Rev. C
- [8] K. H. Ackermann et al. (STAR Collaboration), Nucl. Phys. A 661 (1999) 681c.
- [9] L. Foa, Physics Reports 22 (1975) 1.
- [10] J. Whitmore, Physics Reports 27 (1976) 187.
- [11] H. Boggild and T. Ferbel, Ann. Rev. Nucl. Sci. 24 (1974) 451.
- [12] B. Back, et al.,(PHOBOS Collaboration) Phys. Rev. Lett. 87 (2001) 102303.
- [13] B. Back, et al.,(PHOBOS Collaboration) Phys. Rev. Lett. 88 (2002) 22302.
- [14] M. Abdel Aziz, et al., work in progress.