E917 Collaboration
Production of Mesons in Collisions at 11.7
Abstract
We report on a measurement of -meson production in collisions at a beam momentum of 11.7 by Experiment 917 at the AGS. The measurement covers the midrapidity region . Transverse-mass spectra and rapidity distributions are presented as functions of centrality characterized by the number of participant projectile nucleons. The yield of ’s per participant projectile nucleon increases strongly in central collisions in a manner similar to that observed for kaons.
pacs:
25.75.-q, 25.75.Dw, 13.85.NiI Introduction
The production of mesons in relativistic heavy-ion collisions has been an important subject of study at the AGS, the SPS, and RHIC. The production of the meson, the lightest bound state of strange quarks (), is suppressed in ordinary hadronic interactions because of the Okubo-Zweig-Iizuka (OZI) rule OZI . It has been proposed that in a quark-gluon plasma (QGP) scenario, strange quarks could be rapidly and abundantly produced via gluon interactions STRANGE . Thus, mesons could be created in a non-conventional way via strange quark coalescence, bypassing the OZI rule. A strong enhancement in -meson production would serve as one of the strangeness-enhancement signatures for QGP formation SHOR .
The production of mesons has been measured in collisions at 14.6 by E859 at the AGS within a rapidity interval of E859PRL . The ratio of the total yield to the yield has been found to be 10% for the uppermost 7% of the charged-particle multiplicity distribution. NA49 at the SPS has measured -meson production in , , and collisions at a beam energy () of 158 within a rapidity range of . An enhancement in the ratio of to pion total yields by a factor of has been observed in central collisions relative to in interactions NA49PHI . Also at the SPS, NA50 has measured the ratio as a function of centrality in collisions by fitting the invariant-mass spectrum of muon pairs with and NA50PHI . Both this ratio and the absolute yield of ’s per participant nucleon have been found to increase significantly with the number of participant nucleons. The STAR experiment has reported on a measurement of the yield at midrapidity in collisions at center-of-mass energy . An increase in the ratio with has been observed STARPHI .
Enhancements in the yields of particles with open strangeness have also been observed. At the AGS, ratios have been seen to increase to % in central and collisions, from 4–8% in collisions E802KPI ; E866KAON ; E917KPI , and the ratio has been found to increase strongly with centrality in collisions E864LBAR ; E917LBAR . At the SPS, the WA97 collaboration has observed enhanced production of ’s, ’s, ’s, and ’s in heavy-ion collisions relative to in or collisions WA97S . Measurements from the PHENIX experiment at center-of-mass energy have shown the kaon yield to be more strongly dependent on centrality than the pion yield at midrapidity PHENIXKPI .
The reason for the strangeness enhancement in heavy-ion collisions is not completely understood. The rescattering of hadrons and the conversion of the excitation energy of secondary resonances into strange particles might give rise to strangeness enhancement in a purely hadronic picture RQMD ; ARC ; ART1 . Strangeness enhancement can also be interpreted as a reduction in canonical strangeness suppression from to reactions in the context of thermal models Thermal . Strangeness enhancement as a function of the number of “grey” protons (a centrality index) has also been seen in collisions, in which a QGP phase is unlikely to contribute E910PRL .
Under the conventional hadronic interactions, there are mainly three scenarios proposed for the production of mesons in nuclear collisions:
-
•
Parton fusion of strange sea quarks PARTONFUSION or knock-out of pairs KNOCKOUT from the primary collisions of projectile and target nucleons.
- •
-
•
Secondary kaon-hyperon interactions and kaon-antikaon scattering in the event of the restoration of chiral symmetry in the hot and dense nuclear fireball ART3 .
With inclusion of secondary meson-baryon and meson-meson interactions, RQMD (Relativistic Quantum Molecular Dynamics) RQMDPHI is able to qualitatively describe the increase of kaon yields with centrality measured by E866 E859KAA , though quantitative differences do exist FQWANG .
The different scenarios described above imply different relations between the scaling of production and that of other hadrons, such as kaons and pions, with collision centrality and energy. Hence, a systematic measurement of production in different collisional systems may help to quantify the increase in the overall strangeness production, and, in combination with other measurements of strange and non-strange hadron production, to differentiate between possible mechanisms contributing to the strangeness enhancement Dunlop .
In this paper we report on a measurement of the yield around midrapidity in collisions at the Alternating Gradient Synchrotron (AGS) at Brookhaven National Laboratory (BNL), and compare it to the yields of pions and kaons.
II Experimental Details
Experiment 917 took data on reactions at projectile momenta of 6.8, 8.9 and 11.7 (corresponding to center-of-mass energies = 3.83, 4.31, and 4.87 , respectively) in the fall of 1996. The identified particles include particles containing strange quarks, such as , , , , and , and non-strange particles such as , , and E917KPI ; E917LBAR ; E917KPKM ; E917PRO ; E917PROC . The experimental apparatus consisted of a movable magnetic spectrometer for tracking and particle identification, and beamline detector arrays for global event characterization. When the data reported in this work were collected, the beam momentum was 11.7, an Au target with areal density 1961 mg/cm2 (corresponding to approximately 4% of an interaction length for an Au projectile) was used, and the spectrometer angle was set to either or from the beam axis. The momentum resolution of the spectrometer, , was about 1% for particles with momentum greater than and increased at lower momentum, up to 2% at , due to the effect of multiple scattering. The kaon momenta in reconstructed events lay mostly in the range of . Event centrality was characterized by the energy of the beam spectators after the interaction as measured in the zero-degree calorimeter (ZCAL), positioned downstream of the target on the beam axis. More details on the detector systems are given in Refs. E917PROC ; E802 ; E917PHD .
The data presented here were collected using a two-level online trigger: a minimum-bias spectrometer-activity trigger (LVL1) followed by a particle-identification trigger (LVL2) which required two charged kaons of either sign or one in the spectrometer acceptance. The hardware LVL2 trigger looped over the combinations of drift chamber and TOF hits, and formed combinations consistent with tracks corresponding to particles of given momentum, charge, and particle type using a look-up table LVL2 . The LVL2 trigger increased the live time of the data-acquisition system by essentially the ratio of the rate of vetoable LVL1 triggers to the rate of vetoable LVL1 triggers that were not vetoed. This ratio was known as the LVL2 rejection factor, and could be estimated online. In collisions with a magnetic field of 4 KG and the spectrometer at and , typical rejection factors for a trigger were and , respectively. By examining data that was taken with the LVL1 trigger and recording the decision of the LVL2 trigger, the inefficiency of the latter was monitored and found to be less than 1% for events fully inside the acceptance. Most of the LVL2-triggered data was background since the trigger was optimized to reject only events that were clearly not of the correct type in order to keep its efficiency near 100%.
A time-of-flight (TOF) system with a typical resolution of 130 ps served to identify pions and kaons up to a momentum of 1.75 with 3 standard deviations of TOF resolution. Above this momentum, the contours in the (, TOF) plane began to overlap. Within this region, particles were identified as kaons only if their TOF was inside the kaon region and outside of the pion region, since 10–30% of the tracks in the overlap region were from pions. A specific correction for the kaon-identification inefficiency from the exclusion of the pion bands in this region of high momenta was implemented in the analysis (see Sec. III.2). Additionally, kaons with momenta less than 0.5 were rejected, in order to avoid the need for large acceptance corrections.
| bin | % | ||||
|---|---|---|---|---|---|
| 1 | 0-280 | 0-5 | |||
| 2 | 280-560 | 5-12 | |||
| 3 | 560-960 | 12-23 | |||
| 4 | 960-1440 | 23-39 | |||
| 5 | 1440 | 39-77 |
The index of event centrality was obtained from the distribution of the energy deposited in the zero-degree calorimeter, , obtained using a minimum-bias interaction trigger based on the measurement with a Čerenkov counter of the projectile charge after passage through the target. Empty-target runs were periodically taken in order to subtract the background from the ZCAL energy distribution. Assuming a monotonic relation between the energy deposition in the calorimeter and the event centrality such that the most central events correspond to the smallest energy deposition, we divided the data into five centrality bins. The centrality bins are expressed as a fraction of the total cross section for collisions, 6.8 as evaluated from the parameterizations of Ref. Geer . The cross section for collisions as measured with the minimum-bias interaction trigger is approximately 5.2 , or 77% of the total cross section.
We have attempted to estimate , the mean number of projectile participants, and , the mean number of binary collisions, according to the Glauber model Glauber , using impact parameter cuts corresponding to the centrality range for each bin as listed in Table 1, and an assumed inelastic cross section of 30 . In Experiments 802, 856 and 866 E866KAON , the number of projectile participants has been conventionally estimated from the relation , where is the atomic mass of the projectile, and is the total kinetic energy of the nuclei in the beam before interaction, which was 2123 in the present case. For the purpose of comparison, we have also calculated and its uncertainty with a nominal ZCAL energy resolution () of 3.6% E802ZCAL . All relevant parameters for each centrality bin are listed in Table 1. To facilitate comparison with other experiments we will use as calculated using the Glauber model for the rest of this paper.
III Experimental Results
A total of 250 million LVL2-triggered events were analyzed. When the two spectrometer angle settings were combined, the overall acceptance for pairs covered the region of rapidity and transverse mass , as shown in Fig. 1.

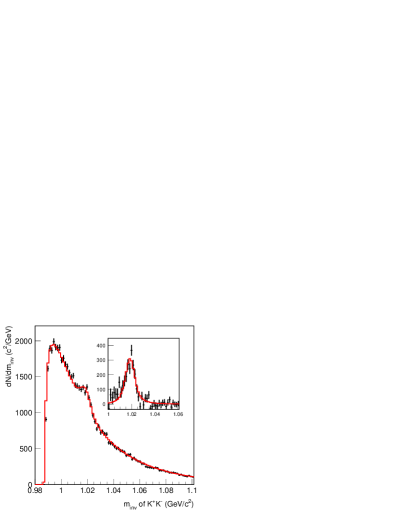
The mesons were reconstructed by forming the invariant-mass () distribution of identified pairs and subtracting the combinatorial background, which was obtained by the event-mixing method MIXING . Two kinds of distributions were formed: “same-event” distributions, in which the ’s and ’s were selected from the same event, and “mixed-event” distributions, in which the individual particles were chosen from different events in the same centrality class to represent the uncorrelated background.
III.1 Invariant-mass distribution for pairs
First, we examined the minimum-bias invariant-mass distribution of kaon pairs by fitting the data to a relativistic Breit-Wigner distribution (RBW) convoluted with a Gaussian representing the experimental mass resolution E859PRL ; JDJACKSON . The shape of the background (BG) was obtained from the mixed-event distribution while the normalization was left as a free parameter in the fit. The parameterization is as follows:
| (1) | |||||
where
| (2) | |||||
| (3) | |||||
| (4) | |||||
| (5) |
and where the limits of integration were and . There were five free parameters in all: the relative normalizations and , the peak mass and width parameters and , and the experimental mass resolution .
For the minimum-bias data, the same-event invariant-mass distribution of pairs and the background-subtracted signal distribution corresponding to the first term in Eq. (1) are shown together with the fits in Fig. 2. The values , , and were obtained with . The fit results for the peak position () and width () of the signal are in agreement with the world-average values. The large uncertainty on arises mostly because of a high degree of correlation in the fit between the values for the parameters and (correlation coefficient = ). The value obtained for the experimental mass resolution () is also consistent with our estimated value of 2.0 , from Monte Carlo studies and from the width of the peak from decay in the invariant-mass distribution E917PHD (the known contribution from the multiple scattering of the kaons in the target in the case of the present measurement was accounted for by additional smearing). It is noted that the result of the fit lies systematically below the data in the invariant-mass region 10–20 below the peak. We do not have a clear understanding of this effect.
III.2 Signal counting and extraction of differential yields
Monte Carlo studies confirm that the experimental invariant-mass resolution () remains constant ( ) across the kinematic region of acceptance E917PHD . Given the stable mass resolution and the limited statistics for the division of data into bins in centrality and phase space, the transverse-mass spectra were obtained by counting events in a defined signal window and estimating the number of background events within this window, rather than by integration of the result of the fit with Eq. (1). The details were as follows. The data were divided into subsets for each of the two spectrometer settings and five centrality classes. Same-event and mixed-event pairs for each subset were binned in rapidity and transverse mass ( and ), and invariant-mass distributions were obtained for each bin. No corrections were applied to the invariant-mass distributions at this stage—signal extraction was performed on the spectra of raw counts. In each bin, the total number of signal and background counts () was taken to be the sum of the counts within a signal window defined as . In units of the natural width, this interval corresponds to approximately about the expected peak position. We then estimated the number of background counts () inside the signal window as the number of counts in the normalized distribution of mixed-event pairs in this same interval. For this purpose, the mixed-event distributions were normalized to have the same area outside of the signal window as the same-event distributions. The final number of signal counts () was obtained by subtracting the background estimated in this way from the total number of events in the signal window. Using this procedure, we were able to obtain estimates of for a total of 88 distributions corresponding to different bins in phase space and centrality for each of the two angle settings.
We use the statistic obtained from the Poisson log-likelihood treatment described in Ref. BakerCousins as an index of the degree of consistency between the same- and mixed-event invariant-mass distributions in the mass region used for normalization. We typically found (for most fits, the number of degrees of freedom—one minus the number of populated bins outside of the signal window in the mixed-event distributions—was 149). In the worst case, we found .
The statistical error on was calculated as . Here, is the contribution from Poisson fluctuations in the number of total counts in the signal window, and was taken to be , with the number of counts in the spectra outside the signal window (where same- and mixed-event spectra are normalized to the same integral). As an index of the statistics of the measurement, the values obtained for range from a few counts for bins in phase space near the limits of the spectrometer acceptance, to approximately 100 counts for bins well within the acceptance. Typical values of the signal-to-total ratio, , were 0.05–0.30; 74 of the 88 measurements had values of within this interval. The median statistical error for the 88 measurements of was 72%; 57 of the 88 measurements had statistical errors of less than 100%.
Systematic errors on may result if the signal window does not completely include the signal peak. In this case, not only are the tails of the signal peak excluded from the signal count—the equal-area normalization technique will also cause the baseline to be overestimated. Systematic errors on may also arise if the mixed-event distributions do not accurately represent the background in the same-event distributions. Of particular concern is the excess of counts in the mass interval 1.000–1.010 noted in Sec. III.1 and visible in Fig. 2. In the same-event spectra for the individual centrality and phase-space bins, this excess is present to varying degrees. Since we are uncertain of the origin of this excess, its effects must be included in our estimates of the systematic error for the signal count in each bin.
We assign the systematic error on for each bin by varying the width of the signal window from to . For window sizes smaller than , the signal count drops precipitously. For window sizes larger than , there is very little constraint on the normalization from the low-mass portion of the distribution. In Fig. 3 we show the dependence of on the width of the signal window for minimum-bias distributions in six bins of and . For each bin, values of are plotted for nine different choices for the signal window, each symmetric about the expected peak position with half-width in units of given by the abscissa value. The central point in each plot, corresponding to a window width of about , provides the value of used to obtain the results presented in this work. Some of the point-to-point fluctuation is statistical in nature and is presumably accounted for in the statistical errors associated with each value of . In most cases, however, there is a suggestion of an underlying systematic trend. To quantify this trend, we perform a linear, least-squares fit with uniform weights to the nine points for each bin. The results are shown as the straight lines in the figure. For each bin, we quote as the systematic error on the RMS variation of this line over the interval spanned by the first and last points, which is equal to the maximum vertical extent divided by . When applied to each centrality and phase-space bin used for the analysis, this procedure leads to systematic errors for that vary significantly from bin to bin. For the 88 individual measurements of , the median systematic error is 16%; 62 of the 88 measurements have systematic errors of less than 30%. In all cases, the statistical errors on are larger than the systematic errors.

The differential yields for each bin in phase space and centrality were then calculated from as
| (6) |
where is the fraction of minimum-bias interaction triggers satisfying the centrality selection, is the background-subtracted number of minimum-bias interaction triggers collected with the data for normalization purposes, is the geometrical acceptance correction, is the overall correction factor for other experimental effects, is the mean value of for all pairs in the bin, and %.
Apart from the systematic error on , the principal source of systematic uncertainty in the yields is from the uncertainty on . Due to radiation damage to the plastic-scintillator materials of the ZCAL, its signal decreased with time. A run-dependent calibration was therefore used, in which the energy of the fragmented-beam peak was recentered at the nominal beam kinetic energy (with corrections for energy loss in the target). These calibrations were performed periodically throughout the running period. The centrality bins were then defined via fixed cuts on the calibrated ZCAL energy. However, exhibited residual variation as a function of running time. The resulting contributions to the systematic errors on the yield measurements are estimated to range from about in the most central bin to for the most peripheral bin.
The geometrical acceptance, , and many of the contributions to the weight factor , were calculated using a GEANT-based Monte Carlo simulation implementing a realistic detector configuration E917PHD . The value of used in Eq. (6) is the average value for events in the phase-space bin of interest. The weight factor was calculated as follows for each centrality and phase-space bin. Corrections for kaon decays in flight, the single-particle tracking inefficiency, hadronic interactions, multiple scattering in the spectrometer, momentum cuts, and the kaon-identification inefficiency were evaluated using the Monte Carlo, separately for each track in each pair. An additional correction for the single-track tracking efficiency in the presence of background hits on the drift chambers was evaluated by inserting found tracks into random events. This occupancy correction was then parameterized by the hit multiplicity in the chambers and applied for each track; the resulting correction was typically 20–40%. The individual correction weights for each track and from each of the above sources were then multiplied, together with an additional correction for a two-track opening-angle cut (evaluated for each pair), to obtain the overall pair weight, . The value of in Eq. (6) is the average value of for all pairs in the same-event distribution of interest. The systematic errors associated with and are estimated to be no larger than 5%, arise mainly from the statistics of the samples used to obtain the weight factors, and do not significantly affect the results.
The final systematic errors on the individual yield measurements are calculated as the quadrature sum of the fractional systematic errors on (for each measurement), on (for each centrality bin), and on (constant). In general, the dominant contribution is from the systematic uncertainty on . For the 88 individual differential yield measurements, the median overall systematic error is 20%; 60 of the 88 measurements have systematic errors of less than 30%, and 75 of the 88 have systematic errors of less than 50%. In all cases, the statistical errors are larger than the overall systematic errors; for 73 of the 88 measurements, the statistical errors are more than twice as large as the overall systematic errors.
Experimental results from both the and settings of the spectrometer were in all cases consistent within statistical errors, and were therefore combined for the presentation of the transverse-mass spectra, resulting in the 53 individual differential yield measurements plotted in Fig. 4.
III.3 Transverse-mass spectra and rapidity distributions
The transverse-mass spectra for the five centrality bins are shown in two bins of rapidity, and , with an bin size of 0.2 , in Fig. 4. For the bins where the acceptance from and data sets overlap, the individual measurements from each of the data sets agree to within statistical errors, and the weighted average of the two measurements is presented. The full error shown includes both statistical and systematic contributions; the contribution from statistics alone is indicated by the cross bars. The total errors are calculated as the quadrature sum of the statistical and systematic errors.

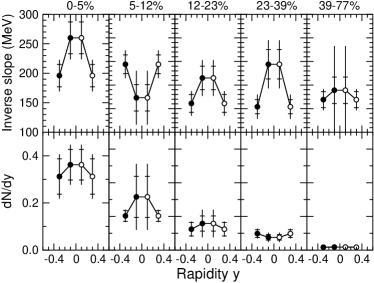
An exponential parameterization with two parameters, rapidity density (), and inverse slope (), was used to fit the transverse-mass spectra:
| (7) | |||||
This function gave a good fit to the data with in all cases. The values obtained for the rapidity density () and inverse-slope parameters () are plotted as functions of rapidity and centrality in Fig. 5 and are listed in Tables 2 and 3. The statistical and systematic contributions to the error were evaluated by performing the fits with and without the systematic contribution included in the errors. The systematic error due to uncertainties in the overall normalization is excluded from the systematic error estimate for .
As a function of centrality, the rapidity density shows a strong systematic increase, while the inverse slope increases more mildly. Within the rapidity range covered by the measurement, there seems to be no strong rapidity dependence for .
The fiducial yield is the sum of the values for the two rapidity bins covering the interval and is plotted as a function of (calculated from a Glauber model as explained in Sec. II) in Fig. 6. When normalized to , this quantity exhibits a steady increase with increasing centrality. This implies that the fiducial yield of ’s increases faster than linearly with . It is noted that the increase with centrality is slightly more significant (the effect is on the order of 4% in the slope of a linear fit) if the fiducial yields are plotted against . Thus, we observe an enhancement in -meson production in central events. This is similar to what has been previously observed for kaon production E866KAON . In collisions at the SPS, NA50 has also observed an increase in the yield of ’s per participant nucleon () as a function of NA50PHI , though the NA50 data show more evidence of saturation of this quantity in the most central collisions than do our results.
| Centrality | ||
|---|---|---|
| 0–5% | ||
| 5–12% | ||
| 12–23% | ||
| 23–39% | ||
| 39–77% |
| Centrality | ||
|---|---|---|
| 0–5% | ||
| 5–12% | ||
| 12–23% | ||
| 23–39% | ||
| 39–77% |

IV Discussion
In this section, we compare the measured inverse slopes () and rapidity densities () for the to those of the other hadrons and explore their dependence on centrality and beam energy.
IV.1 Transverse-mass spectrum of the ; comparison to other species
In the most central bin (), the inverse-slope parameter is determined to be 26037 around midrapidity. As motivated by hydrodynamic models hydroPRC , the inverse-slope parameters for different particle species are expected to scale with species mass for particles that participate in the collective transverse flow. It is interesting to see whether the inverse slope for mesons fits into the systematic trend observed for the other hadrons. However, two known effects complicate the interpretation.
The first is that the cross sections for interactions in the collision medium are expected to be small. The OZI rule inhibits elastic scattering of the on nucleons and non-strange mesons and resonances. Elastic-scattering cross-sections are dominated by Pomeron exchange and are expected to be on the order of 1 (see SHOR and references therein). In particular, from studies of photoproduction, total cross sections for the interaction of ’s with nucleons are estimated to be 8–12 over the range of kinetic energies from a few hundred up to several , and dominated by OZI-allowed absorptive processes—elastic scattering of ’s on nucleons accounts for about 1 of this cross section PHICROSS . It might therefore be expected that ’s decouple rather early from the nuclear fireball, which is composed of nucleon resonances, pions, and non-strange meson resonances. If this were the dominant effect, the inverse slope () would reflect the original “temperature” when the ’s are produced, without the enhancement from collective transverse flow developed in the late hadronic stages Xu_PRL . In this case, for the ’s would be lower than that observed for other hadrons of similar mass (for example, ’s).
On the other hand, when the is detected via its decay into kaons, the rescattering of the daughter kaons from ’s that decay inside the nuclear fireball would generate a relative depletion in the yield at low . This explanation has been proposed SHURYAKQM99 to explain the difference in the values of for mesons obtained by experiments NA49 and NA50, which observed the via its decay into and final states, respectively. Given the short lifetime of the ( fm/), one might expect that this effect can give rise to a significant depletion in the spectrum only at low . To illustrate, we have performed a simple simulation in which ’s are generated at the center of a “fireball” according to an exponential distribution with , and any ’s that decay within 7 fm of the origin are suppressed. For the resulting depression of the spectrum is nearly uniform; a deficit in the spectrum of more than 10% is noted only for , i.e., only at the edge of the E917 acceptance. (A calculation performed with RQMD for collisions at the SPS gives similar results JJD .) Conceivably, however, in-medium effects could broaden the enough to cause a more significant fraction of ’s to decay inside the fireball, leading to an increase in the apparent value of in fits to the spectra (see Ref. KF for an example with reference to the NA49 and NA50 data).
For the comparison of the transverse-mass spectra for various particle species, we choose to use the mean transverse mass, . This is because a variety of forms are used to fit and parameterize the transverse-mass spectra in the existing measurements of E866PIPRO , E866KAON , E866PROD ; E917PROC , E866PROD , and E917LBAR production at midrapidity in central collisions at the AGS, including Boltzmann, Boltzmann plus exponential, and -scaled exponential forms, in addition to the simple single-exponential form used to fit the spectra for ’s in this work. In all but two of the reports referenced above, is derived from the slope parameters for the chosen parameterization of the spectra, and quoted in place of the slope parameters themselves. The exceptions are the and data. In Ref. E866KAON , the spectra for kaons are fit with exponential distributions, and values of are reported. We convert to using the expression
| (8) |
We use the same expression to obtain from the value of obtained from the fit to the spectrum for the presented in this work. In Ref. E917LBAR , the spectra for ’s are fit with Boltzmann distributions,
| (9) | |||||
and values for are quoted. We convert to using the expression
| (10) |
The values of for mesons, together with the corresponding values for ’s, ’s, ’s, ’s, and ’s are plotted as a function of species mass in Fig. 7. We note that the centrality selection differs somewhat from species to species in the available data: top for , (E866), and ; top for (E917), and ; and top for . The rapidity coverage varies similarly: for the data it is ; for the and data it is , for the and data it is , and for the data it is . (For reference, for 11.7 collisions.) The dashed line in Fig. 7 shows a fit to the values for using the form of Eq. (8) with , so that and are the free parameters of the fit. Assuming that it is qualitatively valid to describe the midrapidity spectra for the various species by exponential inverse-slope parameters, this fit illustrates the trend expected for a linear relationship between inverse slope () and particle mass (), as motivated by hydrodynamic models.

The value of for the falls slightly below the systematic trend observed for the other particles, but less so than for ’s. There may be some suggestion of an effect from early freeze-out of the and late development of at least some of the transverse flow, as described in Ref. Xu_PRL . However, the significance of this observation is limited by the precision of the measurement.
IV.2 Centrality dependence of production; comparison to other species
As mentioned in Sec. I, processes such as are suppressed by large threshold energies and the OZI effect. Thus a naive expectation assuming ordinary hadronic interactions is that if an enhancement in production were observed in heavy-ion collisions at AGS energies, this enhancement would result from secondary collisions, e.g. via channels such as or ART3 . If this were in fact the case, increasing and combinatorics would bring about an increase of the ratio for central collisions.
On the other hand, the proposed “re-arrangement” PARTONFUSION or “shake-out” KNOCKOUT of an intrinsic component of the nucleon wave function in the non-perturbative regime provides a mechanism for production in interactions that bypasses the effects of OZI suppression. If the component of the nucleon wave function were negatively polarized, the fact that, at threshold, the reaction must proceed with the initially in the spin state would imply that this mechanism should be particularly important at near-threshold energies (see Ref. DISTO and references therein, especially ELLIS2 ). Indeed, the DISTO collaboration has observed that in collisions at , only 83 above threshold, the ratio is about unity, such that production represents an important contribution to the yield at these energies DISTO .
Along these lines, a possible mechanism has been proposed to explain overall strangeness production in collisions within the framework of the additive quark model ADM . According to this proposal, strange particles are born as strange-quark pairs from binary collisions of the projectile and target nucleons, with a probability proportional to the number of interacting constituent projectile quarks KADIJA . In collisions at 17.5 , E910 has shown that the production of ’s and ’s increases with the estimated number of binary collisions, , suffered by the incident proton E910PRL . For , the increase in the yields is faster than expected from scaling of data by the number of total participants (i.e., ), although bounded from above by linear scaling with (i.e., ).
If the same mechanism were responsible for the observed increase in production with centrality in collisions, we would expect to observe similar scaling behavior in our data. Specifically, we would expect approximately constant numbers of hadrons bearing strange quarks to be produced per binary collision. In the following, we therefore compare the yield of ’s to the yields of pions and kaons as a function of centrality. The yields of pions and kaons were obtained by the E866 collaboration from collisions at the same beam energy used for the present measurement E866KAON ; E866PIPRO .
As seen from the left panel of Fig. 8, the ratio of fiducial yields shows a rise toward central collisions, which signals an enhancement in the production of mesons relative to that of non-strange mesons in central collisions. This enhancement is also clearly suggested by Fig. 6, since pion production is known to mainly come from resonance decay and secondary rescattering and scales linearly with . Due to the fact that the plotted points represent ratios of fiducial yields, some care should be taken when interpreting the exact form of the dependence. We note that this increase in the ratio is qualitatively similar to the increase in the ratio with centrality observed by E866 in collisions at the AGS E866PIPRO .

We next compare the degree of enhancement in the yields of ’s and ’s, which both contain quarks. We use the yield of to characterize the overall kaon production because the E866 data indicate that the ratio is about 0.15 and independent of centrality. In the right plot of Fig. 8, the ratio of fiducial yields is plotted as a function of centrality, and shows no substantial variation. This implies that both and (or ) possess a similar degree of enhanced production toward central collisions at AGS energies. As estimated from linear fits to the ratios as a function of , an increase of up to 50% for the ratio in the most central bin cannot be definitively ruled out within a range of the fit errors. However, any centrality dependence of the ratios appears to be weak.
To look for scaling behavior similar to that observed in collisions by E910, we examine the dependence of the yields in our data on the mean number of binary collisions, . (Estimation of is discussed in Sec. II; the values of for each centrality bin are given in Table 1.) The fiducial yield normalized to is plotted versus in Fig. 9. The dependence of the fiducial yield on is consistent with scaling proportional to .

While the rapidity coverage of our measurement does not allow us to make a precise statement about the absolute value of the yield, it is possible to make an informed guess about the width of the rapidity distribution. Both E859 E859PRL and NA49 NA49PHI ; NA49KPI have observed that the Gaussian width of the rapidity distribution is very similar to those of the and rapidity distributions. In central collisions at the AGS, the Gaussian widths of the rapidity distributions for and are and , respectively E866KAON ; E859KAA . The narrow width has been attributed to the higher threshold and more restricted phase space for production. Since the thresholds for and production in collisions are very similar, we assume that the and have Gaussian rapidity distributions with approximately equal widths in central collisions. We then estimate that our fiducial yield corresponds to about 20% of the total yield. Using the parameterization described in Appendix A for the yield in collisions as a function of center of mass energy, , the yield of ’s per binary collision in collisions is about 50% of the yield in collisions at this energy. This observation seems contrary to the usual expectation of enhanced strangeness production in collisions. We discuss this point further in Sec. IV.3.
Using E866 data on the total yields of and normalized to , a similar scaling proportional to is observed. It appears as if the mechanisms for the production of ’s, ’s, and ’s all have a similar dependence on the centrality of the collisions, and this dependence is consistent with a scaling with the number of binary collisions, . This observation suggests that hard binary collisions might play an important role in strangeness production in heavy-ion collisions.
Our observation that and kaon production scale similarly and faster than linearly with therefore provides an essential test of the details contained within rescattering models. The rescattering model that suggests the importance of contributions from and collisions in the increase of production in central collisions ART3 can be ruled out; if such contributions were dominant, combinatorial considerations would lead to the expectation that production should increase faster than kaon production with centrality. This is incompatible with our observation that and kaon production show similar scaling with centrality.
IV.3 Dependence of , , and ratios on in and reactions


In order to further explore the mechanism responsible for the approximate scaling of the yield with observed in our data, we compare our results with other measurements of production in heavy-ion collisions at different reaction energies.
The excitation functions of the , , and ratios in central heavy-ion collisions are shown in Figs. 10, 11, and 12. The four points correspond to collisions at the AGS (this measurement, ) E866KAON ; E866PIPRO , collisions at the AGS () E859PRL ; E802KPI ; E859KAA , collisions at the SPS () NA49PHI ; NA49KPI , and collisions at RHIC () STARPHI ; PHENIXKPI . These plots must be interpreted with some care. Most obviously, the collisional system is different in each case; in particular, the various particle yields are not guaranteed to scale in the same way when passing from the system to the heavier systems. In addition, the points for collisions at the AGS and RHIC represent fiducial-yield ratios (the AGS point is for the fiducial yield over , and the RHIC point is for the central unit of rapidity), while the other two points are ratios of yields over all phase space. Nor have we applied any corrections in the comparisons with collisions to take into account the isospin averaging of yields from , , and collisions E866KAON ; E859KAA ; ISOSPIN . Nevertheless, two observations can be made.
Our first observation is that the ratios for collisions are notably enhanced with respect to their values for collisions for all points except at the highest energy in Fig. 10. In collisions, increases with , in large part because of the larger production threshold for mesons. In heavy-ion collisions, the ratios are enhanced by factors of 2–3, at least up to SPS energies, but seem to show the same energy dependence observed in collisions, at least up to SPS energies. Such an enhancement in the central collisions could be interpreted as due to the different scaling behaviors of and with centrality. As discussed in Sec. IV.2, the yield of ’s scales with while that of ’s scales with . The ratio of to is around 1 in peripheral collisions, which are similar to collisions, and becomes larger than 1 in central collisions. At RHIC, the ratio for central collisions is about the same as that from the parameterization of the data. It might be speculated that the primary production channels for ’s and/or ’s at RHIC energies are different from those at AGS and SPS energies.
The second observation is that the ratios for collisions are only marginally enhanced with respect to their values for collisions, and show relatively little variation as a function of energy as seen in Fig. 11 and Fig. 12. Our parameterization of the cross section for production suggests that the ratio increases as approaches the threshold value from above for the reaction . The ratios in heavy-ion data seem to follow the energy dependence observed in collisions rather reasonably.

It is interesting to see if the data points from other systems and energies obey the scaling with as well. The ratio for central collisions at the AGS and SPS is plotted in Fig. 13. For the comparison, we are forced to assume a value for the rapidity width for our measurement. A width of equal to the measured width is used, as explained in the previous section, and we plot our point with an additional 20% systematic uncertainty corresponding to a range of values for from 0.6 (overlap of and rapidity distributions) to 0.9 ( rapidity distribution). The RHIC point is not included in this comparison, because there is no reasonable way to extrapolate the fiducial yield to all of phase space. The ratio is consistent with –0.7 for all three points from the AGS and SPS. Our comparison is by no means precise. However, it does seem that the yield of ’s per binary collision, modulo the effects of threshold and center-of-mass energy dependence, is approximately constant across the three collisional systems studied. Furthermore, instead of there being an enhancement in the yield per binary collision in heavy-ion collisions, this double ratio is less than 1. This might reflect the effect of absorption in the nuclear fireball, as the inelastic cross section of the on nucleons (–10 ) is a significant component of the total interaction cross section (–12 ) PHICROSS ; PHICROSSABSORP .
V Summary
In conclusion, we have studied production in collisions at 11.7 around midrapidity as a function of collision centrality. The yield per projectile participant shows a steady rise toward central collisions. This enhanced production in central collisions is stronger than that of non-strange mesons as seen from the increasing ratio with centrality. The ratios and are approximately constant with . The yield of ’s, like the yields of and , is seen to scale with , the number of binary collisions, and this observation is incompatible with predictions from some rescattering models of production, in which production increases faster than kaon production with centrality due to combinatorial considerations. Finally the yield of ’s per binary collision in collisions is about 50–70% of the yield in collisions at AGS and SPS energies. That the yield of ’s per binary collision in collisions is smaller than that in collisions might signal the effect of absorption by nucleons in heavy-ion collisions.
Acknowledgements.
This work has been supported by the U.S. Department of Energy under contracts with ANL (No. W-31-109-ENG-38), BNL (No. DE-AC02-98CH10886), MIT (No. DE-AC02-76ER03069), UC Riverside (No. DE-FG03-86ER40271), UIC (No. DE-FG02-94ER40865), and the University of Maryland (No. DE-FG02-93ER40802); by the National Science Foundation under contract with the University of Rochester (No. PHY-9722606); and by the Ministry of Education and KOSEF (No. 951-0202-032-2) in Korea.Appendix A Parameterization of production as a function of in collisions
The yield in collisions provides a useful benchmark for the interpretation of yields in heavy-ion collisions. There are various existing measurements of the inclusive total cross section for production in collisions for NA49PHI ; DISTO ; PHIPP that can be extrapolated to the values of for which heavy-ion data exist. (Note that the point at from Ref. DISTO , while technically an exclusive measurement in the channel, is also an inclusive measurement, since no other channels with a or in the final state are kinematically allowed at this energy.) We have fit these measurements with a form used to parameterize results on vector-meson production cross sections in collisions obtained from one-pion exchange calculations SIBIRTSEV and the Lund String Model CASSING :
| (11) |

The results of our fit are shown in Fig. 14. We obtain , , and . For comparison with heavy-ion data, we obtain yields by dividing the cross sections for each value of by the inelastic cross section. For collisions at the AGS, , and our parameterization of the data gives a yield of at this energy.
For and production in reactions, we use the multiplicity parameterizations in Ref. KPIPP . The smallest for the ranges of parameterization for , and are 3.0, 2.98, and 5.03 , respectively.
References
- (1) S. Okubo, Phys. Lett. B 5, 165 (1963); G. Zweig, CERN report NO. 8419/TH, 412 (1964); I. Iizuka, Prog. Theor. Phys. Suppl. 37/38, 21 (1966).
- (2) P. Koch, B. Müller, and J. Rafelski, Z. Phys. A 324, 453 (1986).
- (3) A. Shor, Phys. Rev. Lett. 54, 1122 (1985).
- (4) Y. Akiba et al., Phys. Rev. Lett. 76, 2021 (1996).
- (5) S.V. Afanasiev et al., Phys. Lett. B 491, 59 (2000).
- (6) B. Alessandro et al., Phys. Lett. B 555, 147 (2003).
- (7) C. Adler et al., Phys. Rev. C 65, 041901(R) (2002).
- (8) T. Abbott et al., Phys. Rev. Lett. 64, 847 (1990).
- (9) L. Ahle et al., Phys. Rev. C 58, 3523 (1998).
- (10) L. Ahle et al., Phys. Lett. B 476, 1 (2000).
- (11) T.A. Armstrong et al., Phys. Rev. C 59, 2699 (1999).
- (12) B.B. Back et al., Phys. Rev. Lett. 87, 242301 (2001).
- (13) E. Anderson et al., Phys. Lett. B 433, 209 (1998); E. Anderson et al., Phys. Lett. B 449, 401 (1999).
- (14) K. Adcox et al., Phys. Rev. Lett. 88, 242301 (2002).
- (15) R. Mattiello et al., Phys. Rev. Lett. 63, 1459 (1989).
- (16) Y. Pang, T.J. Schlagel, and S.H. Kahana, Phys. Rev. Lett. 68, 2743 (1992).
- (17) B.A. Li and C.M. Ko, Phys. Rev. C 52, 2037 (1995).
- (18) P. Braun-Munzinger et al., Phys. Lett. B 344, 43 (1995); J. Cleymans et al., Z. Phys. C 74, 319 (1997).
- (19) I. Chemakin et al., Phys. Rev. Lett. 85, 4868 (2000).
- (20) M.B. Green et al., Nuovo Cimento A 29, 123 (1975); A. Donnachie and P.V. Landshoff, Nucl. Phys. B 112, 233 (1976).
- (21) J. Ellis et al., Phys. Lett. B 353, 319 (1995).
- (22) W.S. Chung et al., Phys. Lett. B 401, 1 (1997).
- (23) M. Berenguer, H. Sorge, and W. Greiner, Phys. Lett. B 332, 15 (1994).
- (24) C.M. Ko and B.H. Sa, Phys. Lett. B 258, 6 (1991).
- (25) L. Ahle et al., Phys. Rev. C 60, 044904 (1999).
- (26) F.Q. Wang, J. Phys. G 27, 283 (2001).
- (27) J.C. Dunlop and C.A. Ogilvie, Phys. Rev. C 61, 031901 (2000).
- (28) L. Ahle et al., Phys. Lett. B 490, 53 (2000).
- (29) B.B. Back et al., Phys. Rev. Lett. 86, 1970 (2001).
- (30) B.B. Back et al., Phys. Rev. C 66, 054901 (2002).
- (31) T. Abbott et al., Nucl. Instrum. Meth. A 290, 41 (1990).
- (32) H. Xiang, Ph.D. Thesis, Univ. of California, Riverside, 1999; J.C. Dunlop, Ph.D. Thesis, MIT, 1999; G. Heintzelman, Ph.D. Thesis, MIT, 1999; M.D. Moulson, Ph.D. Thesis, Columbia Univ., 2001.
- (33) W.A. Zajc, AIP Conf. Proc. 243, 415 (1992).
- (34) L.Y. Geer et al., Phys. Rev. C 52, 334 (1995).
- (35) R.J. Glauber and G. Matthiae, Nucl. Phys. B 21, 135 (1970).
- (36) T. Abbott et al., Phys. Rev. C 44, 1611 (1991).
- (37) G.I. Kopylov, Phys. Lett. B 50, 472 (1974).
- (38) J.D. Jackson, Nuovo Cimento 34, 6692 (1964).
- (39) S. Baker and R.D. Cousins, Nucl. Instrum. Meth. 221, 437 (1984).
- (40) E. Schnedermann, J. Sollfrank, and U. Heinz, Phys. Rev. C 48, 2462 (1993).
- (41) G. McClellan et al., Phys. Rev. Lett. 26, 1593 (1971); H.-J. Behrend et al., Phys. Lett. B 56, 408 (1975); T.H. Bauer et al., Rev. Mod. Phys. 50, 261 (1978); H. Joos, Phys. Lett. B 24, 103 (1967).
- (42) H. van Hecke, H. Sorge, and N. Xu, Phys. Rev. Lett. 81, 5764 (1998).
- (43) E.V. Shuryak, Nucl. Phys. A 661, 119c (1999).
- (44) S.C. Johnson, B.V. Jacak, and A. Drees, Eur. Phys. J. C 18, 645 (2001).
- (45) P. Filip and E.E. Kolomeitsev, Phys. Rev. C 64, 054905 (2001).
- (46) L. Ahle et al., Phys. Rev. C 59, 2173 (1999).
- (47) L. Ahle et al., Phys. Rev. C 60, 064901 (1999).
- (48) F. Balestra et al., Phys. Rev. C 63, 024004 (2001).
- (49) J. Ellis et al., Nucl. Phys. A 673, 256 (2000).
- (50) V.V. Anisovich et al., Nucl. Phys. B 133, 477 (1978).
- (51) K. Kadija et al., Z. Phys. C 66, 393 (1995).
- (52) L. Ahle et al., Phys. Rev. C 57, R466 (1998).
- (53) S.V. Afanasiev et al., Phys. Rev. C 66, 054902 (2002).
- (54) M. Gazdzicki and O. Hansen, Nucl. Phys. A 528, 754 (1991).
- (55) R. Bailey et al., Z. Phys. C 22, 125 (1984).
- (56) F. Balestra et al., Phys. Lett. B 468, 7 (1999); V. Blobel et al., Phys. Lett. B 59, 88 (1975); M. Antipov et al., Phys. Lett. B 110, 326 (1982); C. Daum et al., Nucl. Phys. B 186, 205 (1981); D. Drijard et al., Z. Phys. C 9, 293 (1981).
- (57) A.A. Sibirtsev, Nucl. Phys. A 604, 455 (1996).
- (58) W. Cassing and E.L. Bratkovskaya, Phys. Rept. 308, 65 (1999)
- (59) A.M. Rossi et al., Nucl. Phys. B 84, 269 (1975).