Dynamical effects in multifragmentation at intermediate energies.††thanks: Experiment performed at GANIL
Abstract
The fragmentation of the quasi-projectile is studied with the INDRA multidetector for different colliding systems and incident energies in the Fermi energy range. Different experimental observations show that a large part of the fragmentation is not compatible with the statistical fragmentation of a fully equilibrated nucleus. The study of internal correlations is a powerful tool, especially to evidence entrance channel effects. These effects have to be included in the theoretical descriptions of nuclear multifragmentation.
pacs:
25.70.-z,25.70.Mn,25.70.PqIntroduction.
The physical characteristics (shapes, excitation energies, angular momentum, radial flow, …) of the hot nuclei formed in nucleus-nucleus collisions are obtained by comparisons between models and data. Statistical decay models are widely used and dedicated to describe the decay of hot fully equilibrated systems, defined as systems having reached energy, shape and isospin equilibrium Weis37 ; Bohr39 ; SIMON ; SMM ; MMMC ; Moretto95 ; Moretto97 ; Tso95 ; Charity88 . However other experimental works show strong effects of the entrance channel on the decay modes of the formed hot systems Stu92 ; Lec95 ; Plagnol2000 ; Bocage2000 ; Davin2002 ; Gingras2002 ; Lefort2000 ; Dore2000b ; Cas93 ; Ste95 ; Tok95 ; Mon94 ; Glassel83 ; Lar97 . These effects which are not taken into account in the statistical decay models can provide complementary information on the nuclei such as the characteristics of the nucleon-nucleon interaction Cussol2002 ; West98 ; Reis98 ; Gut90 and/or the viscosity of the nuclear matter.
Up to now, these entrance channel effects have been studied by tracking deviations from the standard fission process in the quasi-projectile break-up Bocage2000 ; Davin2002 ; Ste95 ; Cas93 ; Glassel83 . Such deviations have been seen on the angular distributions, which show the focusing of the break-up axis along the quasi-projectile velocity direction. Associated with this focusing, highly asymmetrical break-ups have also been observed, whereas symmetrical break-ups were expected. The corresponding relative velocities were higher than the value predicted by the Viola systematics Viola . These aligned break-ups represent up to 75% of the binary break-up for the Xe+Sn system Bocage2000 . In this paper, we will extend these studies performed for binary break-up to higher fragment multiplicities to test to what extent these effects are present for other exit channels. We will present systematic studies on experimental data only, over a wide range of system sizes, incident energies and projectile/target asymmetries. There will be no attempt to compare these data to theoretical calculations.
We have studied the decay of different quasi-projectiles formed in several projectile-target collisions from 25 to 90 . In the first section, we present the experimental set-up, the studied sytems and the selections which have been applied on the data. In the second section the charge distributions, the associated velocity and angular distributions obtained for the different systems are shown. The third section is devoted to the evolutions of some experimental observables as a function of the break-up asymmetry of the quasi-projectile. In the last section our conclusions are given.
I The experimental set-up
The experiments were performed at the GANIL facility with the INDRA detector. The different systems which will be presented in this article are Ni+Ni at 52 and 90 , Xe+Sn from 39 to 50 , Ta+Au at 33 and 39 , Ta+U at 33 and 39 and U+U at 24 . Target thicknesses were respectively 193 for the experiment with the Au target, 179 for the Ni + Ni experiment and 330 for the Xe + Sn experiment. The 100 uranium target was deposited between two 20 carbon foils . We will show afterwards the method used to separate the events corresponding to the uranium target from those corresponding to the carbon backing. Typical beam intensities were 3-4 pps. Events were registered when at least four charged particle detectors fired (eight for the collisions with the Ta projectile).
The INDRA detector INDRA1 ; INDRA2 can be schematically described as a set of 17 detection rings centered on the beam axis. In each ring the detection of charged products was provided with two or three detection layers. The most forward ring, , is made of phoswich detectors (plastic scintillators NE102 + NE115). Between and eight rings are constituted by three detector layers: ionization chambers, silicon and ICs(Tl). Beyond , the eight remaining rings are made of double layers: ionization chambers and ICs(Tl). The total number of detection cells is 336 and the overall geometrical efficiency of INDRA detector corresponds to 90% of 4. Isotopic separation is achieved up to Z=3-4 in the last layer (ICs(Tl)) over the whole angular range (). The charge resolution in the forward region () is one unit up to Z50. In the backward region () a charge resolution of one unit is obtained up to Z20 . The energy resolution is about 5% for ICs(Tl) and ionization chambers and better than 2% for Silicon detectors.
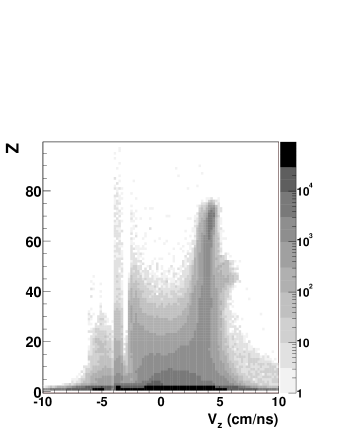
The binary character of the collisions is clearly seen on figure 1 which plots the correlation between the charge and the velocity component parallel to the beam of each detected fragment. The fragments are roughly distributed around two areas: one around the quasi-projectile velocity and charge ( and ) and one around the quasi-target velocity (). Due to the experimental thresholds, the fragments emitted by the quasi-target are not detected efficiently. Then, for this analysis, only the fragments produced by the quasi-projectile are taken into account. Due to the quasi symmetry of most of the studied systems, a fragment (Z3) is assumed to be emitted by the quasi-projectile if its velocity component parallel to the beam axis is higher than the velocity of the center of mass .
In order to have enough information to perform our studies, only events for which more than 80% of the incident linear momentum was detected are selected ( where and are the charge of the fragment and the charge of the projectile respectively and and their velocity components parallel to the beam axis in the laboratory frame).
The events are sorted according to the multiplicity of fragments (Z3) emitted by the quasi-projectile.
The use of a multi-detector gives a very good coverage of the quasi-projectile emissions. The angular, charge and velocity or energy distributions are precisely obtained. This allows the study of the internal correlations in one event like the correlation between the fragments relative velocities and the break-up direction. It will be shown later that this is a powerful tool to distinguish different reaction mechanisms.
As said previously, the uranium was deposited between two carbon layers. Thus, for the systems with this target, there will be a mixing of reactions on the backing (C) and on the target (U). The separation between these two reactions is done by using the angular distribution of the quasi-projectile. For a fixed incident energy, the grazing angle for the heavy target is larger that the grazing angle for the light one. The values of this angle are summarized in table 1.
| System | Incident Energy | |
| () | (degrees) | |
| U + U | 24 | 8 |
| U + C | 24 | 0.7 |
| Ta + U | 33 | 6 |
| Ta + Au | 33 | 5 |
| Ta + C | 33 | 0.5 |
| Ta + U | 39.6 | 5 |
| Ta + Au | 39.6 | 4 |
| Ta + C | 39.6 | 0.4 |
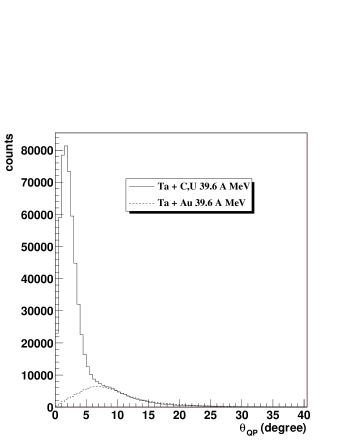
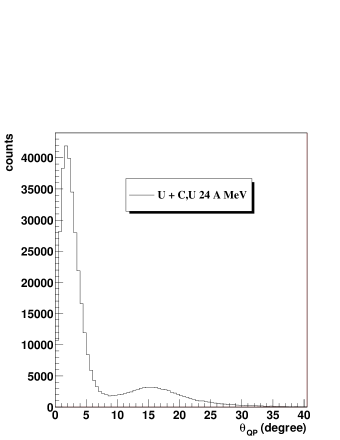
Two contributions are then expected for the quasi-projectile diffusion angle . The quasi-projectile (QP) is reconstructed with the fragments whose velocities are greater than . Such distributions are shown in figures 2 to 4. In the first two figures, the dashed line corresponds to the system with the Ta projectile and the Au target and the full line corresponds to the system with the Ta projectile and the U target and C backing. Reactions on the C backing clearly show up at small angles, while the distributions at large angles, from their similarities with those arising from Ta+Au, can be attributed to reaction on U only. A clear selection of Ta+U reactions is ensured by selecting events with . For the U+C,U system (figure 4), the two contributions (U target and C backing) are better separated due to the larger difference between the values of the grazing angles. The same cut () was applied to separate the contributions from the uranium target and the carbon backing. For this system, the contribution of the uranium target at small angles is weaker compared to the Ta+C,U systems.

II Size and velocity hierarchy
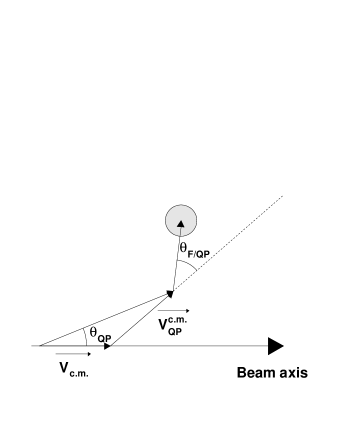
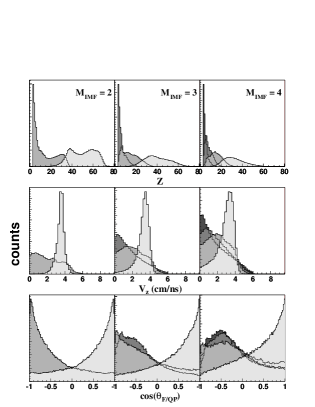
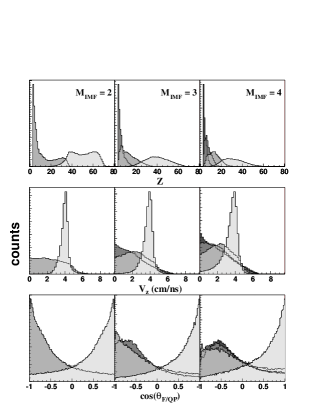
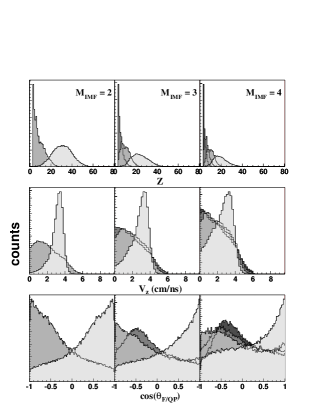
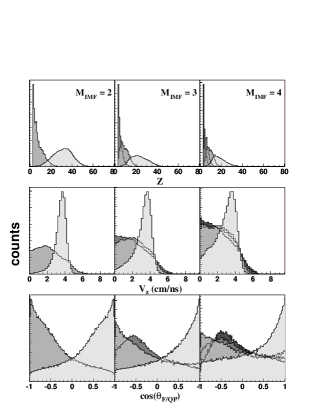
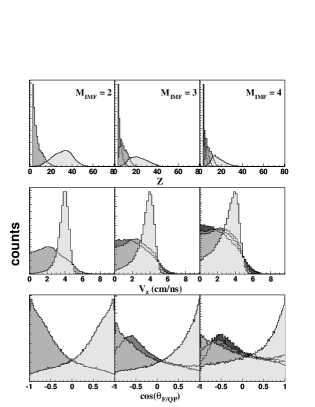
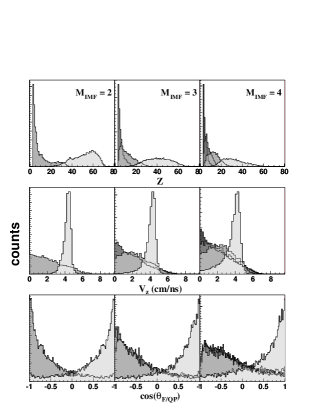
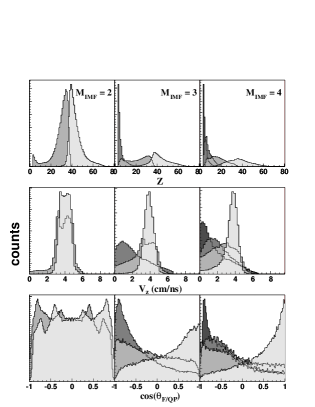
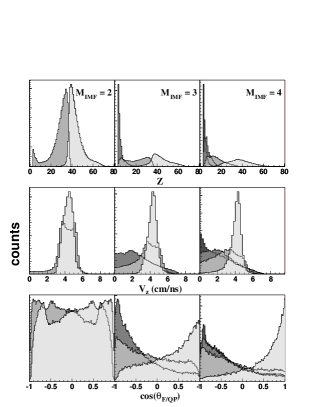
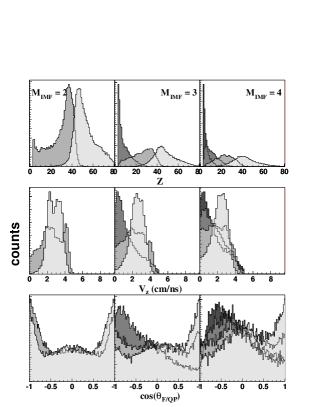
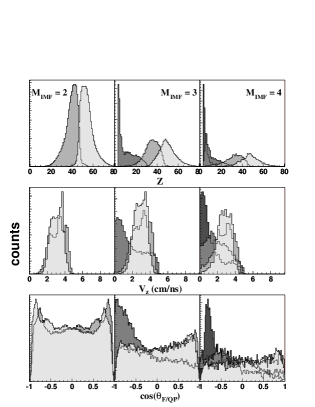
We will first look at simple and direct observables like the fragment charge distributions, the corresponding distributions of the velocity component parallel to the beam () and the angular distributions for the different systems. The angle is the angle between the velocity of the fragment in the quasi-projectile (QP) frame and the velocity of the quasi-projectile in the center of mass frame (see figure 5). The events are sorted according to the multiplicity, , of the forward fragments (). In each event, the fragments are sorted according to their charge.
Charge, and distributions are shown on figure 6. The uppermost row corresponds to the charge distribution, the middle row to the distribution and the lowermost row to distribution. The different columns correspond to the different fragment mutiplicities (from =2 to =4 from left to right). On each panel, the shading of the distribution darkens according to the rank of the fragment in the event.
One spectacular observation is that the velocity distributions are strongly correlated to the charge sorting: the heaviest fragment is in average the fastest one, the second heaviest fragment is the second fastest one and so on. For the distributions, the distribution of the heaviest fragment is peaked at forward angles ( ): the emission direction of this fragment is close to the quasi-projectile velocity direction. Such pictures were not expected in case of a fragmentation of a fully equilibrated quasi-projectile, for which the fragments are emitted in all directions without a particular hierarchy for the velocities. This hierarchy effect (the ranking in charge induces on average the ranking in and the distribution of the heaviest fragment is forward-peaked) suggests an entrance channel effect.
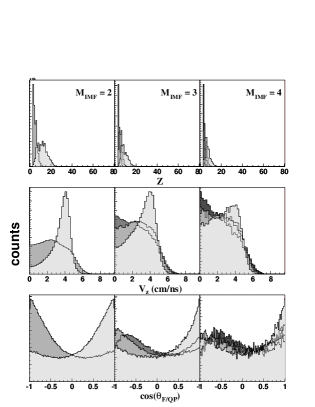
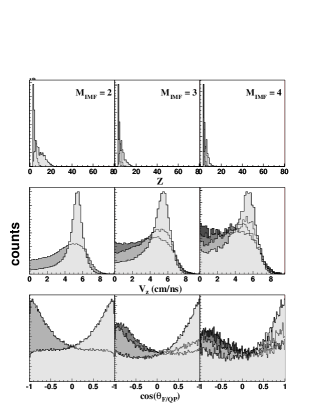
Similar results are observed for the corresponding distributions for most of other systems. The heaviest fragment is the fastest one and its direction of emission is close to the quasi-projectile velocity direction whatever the system size and whatever the incident energy. The hierarchy between the size of the fragment and its velocity is observed for the Ta + Au (figures 6 and 7 ), Xe+Sn (figures 8, 9 and 10 ) and Ni+Ni systems (figures 11 and 12). This effect is strong on the Ta+Au system and is slightly weaker for the Xe+Sn and the Ni+Ni systems. For the Xe+Sn system, the anisotropy of the heaviest fragment angular distribution increases slightly with the incident energy.
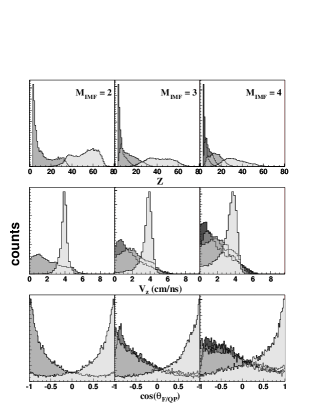
For the Ta+U system (events with , figures 13 and 14 ), the same hierarchy effect is observed as for the Ta+Au system. For the Ta + C,U system (figures 15 and 16 ), this hierarchy effect is still observed for high multiplicities (), but is not present for =2. This is due to the mixing between the carbon backing and the uranium target mentioned in the previous section. For =2, the two fragments have almost the same charges, the velocities are similar and the whole range of is covered. The contribution of the Ta+C collisions is stronger and stronger when decreases. This contribution is especially seen for =2 (compare leftmost columns of figures 13 and 15 for 33 and figures 14 and 16 for 39 ) where the distributions are completely different. The Ta+C collisions lead to the formation of an incomplete fusion nucleus, which decays through fission. In this case, no hierarchy in velocities or no privileged angles of the heaviest fragment are expected.
For the U+U system (figure 17, events with ) the hierarchy effect is observed for but is not observed for =2. Due to the high fissility of uranium, the =2 events correspond mainly to the fission process. However, events for which the charge of the heaviest fragment is close to 80 are still present. They correspond to asymmetric binary break-ups which are not expected for the fission of such a heavy nucleus. These asymmetric break-ups are not present for the U+C system (figure 18, leftmost column, ) and no hierarchy effect is seen: these observations are consistent with the fission of a fully equilibrated nucleus. For , the velocities of the two heaviest fragments are similar and their distributions are flat. For the other fragments, the hierarchy effect is present. This could be due to a two-step process in which the hierarchy effect is present at the early stage of the collision, followed by the fission of the heaviest fragment due to the high value of its charge.
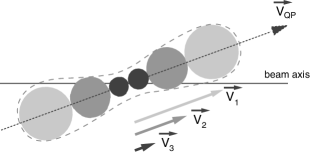
To summarize this section, a hierarchy effect (the ranking in charge induces the ranking in and the distribution of the heaviest fragment is forward-peaked) is seen for many system sizes and incident energies. These observations are not consistent with the decay of a fully equilibrated nucleus for which no hierarchy effect is expected. This “hierarchy effect” is consistent with a strong deformation of QP or QT during the collision which is followed by the break-up of these elongated nuclei in two or more fragments (neck formation and break-up, see figure 19). The fragments emitted by this neck reflect its internal structure: its size at the center of mass is on average thinner than close to the quasi-projectile or quasi-target, and the velocity modulus in the center of mass frame of the nucleons in the neck close to the center of mass are smaller than those of nucleons close to the quasi-target or to the quasi-projectile.
This leads to the “hierarchy effect” observed experimentally. The velocity gradient can be tracked by studying the relative velocities between the heaviest fragment and the others. In the proposed scenario, this relative velocity is expected to be larger than the one obtained from the decay of a fully equilibrated nucleus. For the heaviest systems, the standard fission process superimposes on the neck formation and break-up. The two contributions are clearly seen for Ta and U projectiles. In these cases, deviations from the standard fission can be easily tracked.
III Internal correlations
In the previous section, we have evidenced a “hierarchy effect”, indicating a strong entrance channel influence on the fragmentation of the quasi-projectile. We will study in this section correlations between some observables to verify whether the fragmentation scenario proposed above resists a more detailed analysis. If an elongated quasi-projectile is formed and breaks quickly, the relative velocities between the fragments should be higher along the QP velocity direction than in any other direction, because the incident energy is not fully damped in internal degrees of freedom in such a process. Within this assumption, the heaviest fragment focused along the QP velocity has a high velocity because it is a remnant of the projectile. In the case of the fragmentation of a fully equilibrated QP, the relative velocity should be independent of the break-up direction.
For =2, the relative velocity between the two fragments can be easily determined, while it is not the case for higher multiplicities. We have seen in the previous section that the heaviest fragment has the same properties whatever the value of : it is the fastest one and it is focused in the direction of the quasi-projectile in the center of mass frame. We can use this property to define the break-up direction as the direction of the heaviest fragment with respect to the quasi-projectile velocity, and the relative velocity as the difference of the velocity of the heaviest fragment and the velocity of the center of mass of all other fragments detected with a velocity greater than . They are determined as follows:
| (1) |
where is the charge of the fragment () and its velocity
| (2) |
where is the velocity of the quasi-projectile. All the velocities in formulae 1-3 are expressed in the center of mass frame. With this definition, is identical to of the heaviest fragment (see figure 5).
| (3) |
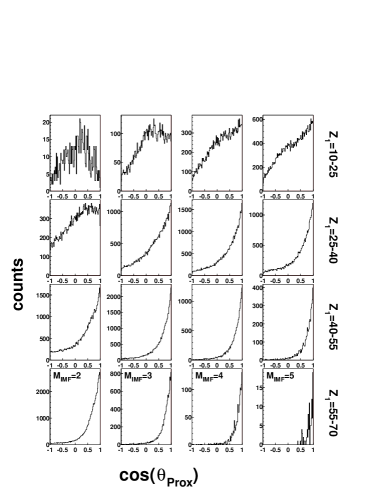
Let us study the behaviour of the distributions. The experimental distributions are shown on figures 20 and 21 for the Ta + Au system at 33 and 39.6 respectively. On each figure, the columns correspond to different values of and the rows to different ranges in charge of the heaviest detected fragment . This cut in was done due to the particular behavior of the heaviest fragment. It is also correlated to the asymmetry of the break-up as in fission: the highest values of correspond to the more asymmetric break-ups (one big fragment and small other ones) and the lowest values of correspond to the most symmetric break-ups (equal size fragments). It can be seen on these figures that the distributions are in most cases peaked at 1 (emission along the direction of the QP velocity). The most forward peaked distributions are obtained for the most asymmetric break-ups (high values of ) and this for all values of . This is not expected in the case of a fragmentation of a fully equilibrated nucleus. An angular momentum effect would lead to a forward-backward symmetry in angular distributions.
For the most symmetric break-ups (low values of ) and the greater IMF multiplicities, the distribution becomes less forward peaked. In this case, the fragments having almost the same charge, the ranking in charge is meaningless. Consequently the memory of the direction of the QP in the fragmentation process is blurred. Another possible scenario could be the occurrence of the fragmentation of a fully equilibrated QP. It will be seen later that the cut at can also influence these distributions.

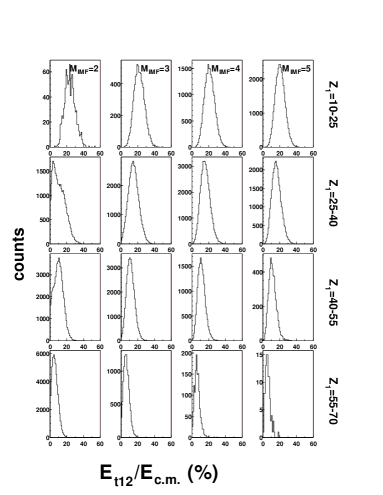
Is there a connexion between the strength of the anisotropy of the distributions and the violence of the collisions? The latter has been estimated by using the sum of the transverse energies of light charge particles (). This global variable has been widely used as an impact parameter selector in previous studies Plagnol2000 ; Bocage2000 . The low values of transverse energies correspond to peripheral collisions and the high values to the most violent collisions. The reduced transverse energy distributions ( where is the energy available in the center of mass) are presented in figure 22 for Ta+Au collisions at 39.6 . The shapes of these distributions depend weakly on the value of and strongly on that of . This is in agreement with being the remnant of the QP. The average value decreases when going from symmetrical (first row) to asymmetrical break-ups (last row) as already shown for the lighter Ar+Ni system Dore2000a . The last row corresponds to the most asymmetrical and aligned break-ups (see figure 21). The transverse energies of the associated particles are low and correspond to peripheral collisions. The first row corresponds to the most symmetrical break-ups and to more wider distributions. The transverse energies of the associated particles are high and correspond to more central collisions.
It is interesting to observe low values for the highest IMF multiplicities (last row, rightmost panel of figure 22). In this case, the excitation energy of the QP is low and low evaporated IMF multiplicities are expected. This observation, combined with the “hierarchy effect” and the strongly peaked distributions, strongly suggests that these fragmentations are only due to entrance channel effects. For the binary break-ups (first column), the very asymmetrical break-ups (last row) are not expected for the standard fission of a quasi-Ta. Nevertheless, this is the dominant decay channel for =2. The second and third panels of the first column (=2) correspond to more symmetrical break-ups () and the standard fission process is expected. In this case the transverse energy distributions are wider. It seems that two contributions could be considered as already suggested by the the distributions. These observations are also made on the other systems.
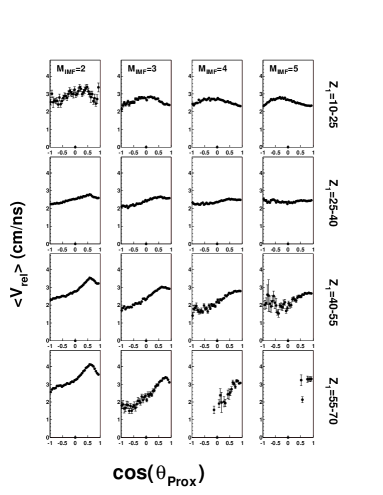
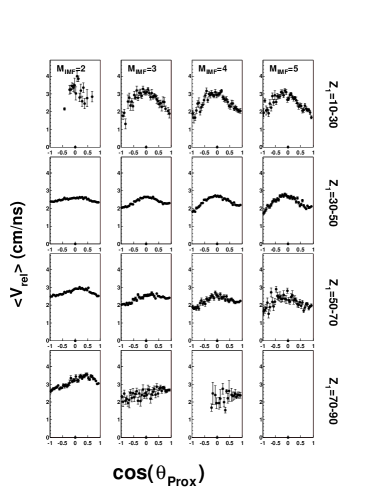
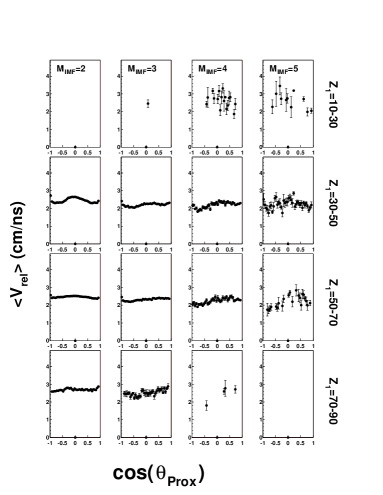
Let us now come to the correlation between the relative velocities of the fragment and . They are presented on figure 23 for Ta+Au collisions at 39.6 , on figure 24 for the U+U collisions at 24 and on figure 25 for the U+C collisions at 24 . As in figures 20 and 21, the columns correspond to different IMF multiplicities and the rows to different values of . For the most asymmetric breakup of the Ta + Au collisions (two lowest rows for figure 23), a strong variation of with is seen. The value of increases from 2.3 at =-1 up to at around and then decreases. The variation is weaker for the more symmetric break-ups (two first rows). This variation is also observed for the U+U collisions but its amplitude is smaller. For the U+C system (figure 25), no evolution is seen whatever the IMF multiplicity and the charge of the heaviest fragment. For the U+C system, no “hierarchy effect” was seen (see figure 18). Within our interpretation of the “hierarchy effect”, no modulation is expected for this system. On all other systems, the same correlation is observed: a modulation of with is seen when the “hierarchy effect” is observed. So the modulation of with is correlated to the observation of a “hierarchy effect”.
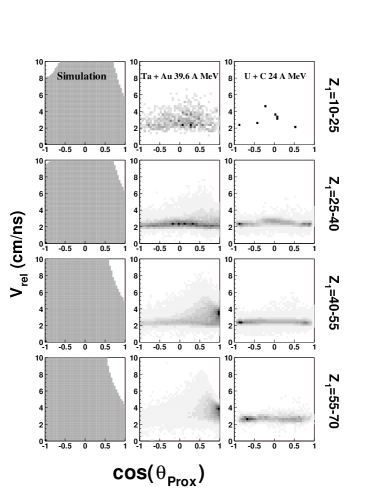
The decrease of at the smallest angles (=1) is not compatible with the expected behaviour of resulting from our interpretation on the “hierarchy effect”. But due to the selection of the fragments in this analysis (), the highest values of can not be reached. We have tested the effect of this velocity cut on our analysis with the help of a simple simulation. For sake of simplicity, we have only verified the effect of the velocity cut for =2. The basic ingredients of this simulation are the following: a QP with a charge , a velocity and an angle is considered. This QP splits in two fragments of charge and , the axis of the break-up being isotropically distributed and the relative velocity between the fragments ranging from 0 cm/ns to 10 cm/ns. For each case, the event is taken into account in this analysis if both fragments have a greater than . The velocities and of the two fragments are calculated the following way:
| (4) |
| (5) |
The first column of figure 26 corresponds to the result of the simulation; the second column shows the experimental bidimensional plots of versus for the Ta + Au collisions at 39.6 ; the third column shows the same plots for the U + C collisions at 24 (). The plots corresponding to events with an IMF multiplicity equal to 2 are displayed. The rows correspond to different selections on the charge of the heaviest fragment , the uppermost row corresponding to the lowest values and the lowermost row to the highest values. For each plot of the simulation (leftmost column), the values of , and the ratio have been chosen according to the average experimental values for the Ta+Au collisions at 39.6 for a given IMF multiplicity and for a fixed range. The shaded areas (leftmost column) correspond to the events selected in our analysis. One can see that the velocity cut () systematically removes the events with the highest values when the fragmentation axis is aligned on the QP velocity direction. For =1, this effect is always present. This could explain the decrease of for high values observed in figures 23 and 24. This is confirmed by the bidimensional plot (second column) which was used to obtain figure 23. The effect of the velocity cut is clearly seen for the highest values. The agreement between data and simulation is good, showing that the velocity cut limits the range of accessible values. For higher values, similar conclusions are obtained. Another interesting observation is that the distribution for is narrow, its average value corresponds to the Viola systematics Viola and is not affected by the velocity cut at . When increases, the width of the distribution and its average value increase while the velocity cut has no influence, i.e. for values below 0.8. Above =0.8, high values of cannot be reached and then its average value decreases. For the U+C system rightmost column, it can be seen that the distributions are always narrow and centered around the Viola systematics value whatever the value. For these collisions, our experimental cut does not affect the evolutions of with .
The observations made in this section confirm the scenario proposed in the previous section. For the U+C system, all observations are compatible with the decay of a fully equilibrated nucleus: no modulation of with is seen while at the same time the “hierarchy effect” is absent or very weak. For the systems with a heavy target, the variation of with is observed. This indicates that a strongly deformed QP or a neck of matter is formed at the early stage of the collision, and breaks quickly into several fragments. In such a process, the incident kinetic energy is not fully damped, and the fragments keep the memory of the formation of the neck and/or deformed QP. Within this interpretation, the heaviest fragment is a remnant of the projectile. This scenario seems to occur for a wide range of system size and incident energies. For the heaviest systems, like U+U for which the fissility of the QP is high, it competes with the fission process.
IV Conclusions
The study of the parallel velocity distributions of the fragments forward emitted as a function of their charge exhibits a “hierarchy effect”: the ranking in charge induces in average a ranking in the average parallel velocity, the heaviest fragment is the fastest and is focused in the forward direction relative to the QP recoil velocity. This “hierarchy effect” is stronger when the size of the target is large, when the fissility of the QP is limited () and when the incident energy is high. This effect is observed for all systems, whatever the multiplicity of fragments. These observations are compatible with the formation of a neck of matter in-between the quasi-projectile and the quasi-target. The neck may be or not attached to the QP (or QT) remnant. In any case, its break-up is fast enough to keep the memory of the entrance channel.
This mechanism is predominant for asymmetric break-ups which mainly correspond to peripheral collisions. For the most peripheral collisions, the asymmetry observed for the binary break-ups is not compatible with the result of a standard fission, and for the highest multiplicities, the high focusing of the heaviest fragment at forward angles is inconsistent with the fragmentation of a fully equilibrated nucleus.
The observed variation of the fragments relative velocity with the emission angle of the heaviest fragment strenghtens the previous statement. This internal correlation study is a powerful tool to clearly establish the degree of equilibration of the studied ensemble. Up to now, the comparisons of models to data were mainly made on global observations only (size distributions, multiplicity distributions, kinetic energy distributions, and so on…). The study of such internal correlations is a more accurate tool to test the pertinence of the models.
In order to have a full understanding of the fragmentation process, the models have to reproduce the effects of the entrance channel. A first step could be to mock up these effects in effective parameters in the statistical decay approaches. It will be certainly worth to use dynamical approaches BUU ; LV ; BLV ; FMD ; QMD ; AMD ; BNV ; CNBD2002 ; Gingras2002 to test the presence of such a hierarchy effect. But in all cases, the models have to reproduce the global observations and the internal correlations as well.
References
- (1) V.Weisskopf et al., Phys. Rev. 52 (1937) 295.
- (2) N.Bohr et al., Phys. Rev. 56 (1939) 426.
- (3) D.Durand, Nucl. Phys. A541 (1992) 266.
- (4) J.Bondorf et al., Phys. Rep. 257 (1995) 133.
- (5) D.H.E.Gross, Rep. Prog. Phys. 53 (1990) 605.
- (6) L.G.Moretto et al., Phys. Rev. Lett. 74 (1995) 1530.
- (7) L.G.Moretto et al., Phys. Rep. 287 (1997) 249.
- (8) K.Tso et al., Phys. Lett. B361 (1995) 25.
- (9) R.J.Charity et al., Nucl. Phys. A483 (198) 371.
- (10) L. Stuttgé et al., Nucl. Phys. A539 (1992) 511.
- (11) J.F. Lecolley et al., Phys. Lett. B354 (1995) 202.
- (12) E. Plagnol et al. (INDRA Collaboration), Phys. Rev. C61 (2000) 014606.
- (13) F. Bocage et al. (INDRA Collaboration), Nucl. Phys. A676 (2000) 391.
- (14) B.Davin et al., Phys. Rev. C65 (2002) 064614.
- (15) L.Gingras et al., Phys. Rev. C65 (2002) 054613.
- (16) T.Lefort et al. (INDRA Collaboration), Nucl. Phys. A662 (2000) 397.
- (17) D.Doré et al. (INDRA Collaboration), Phys. Rev. C63 (2001) 034612.
- (18) G. Casini et al., Phys. Rev. Lett. 71 (1993) 2567.
- (19) A.A. Stefanini et al., Zeit. Phys. A351 (1995) 167.
- (20) J. Tõke et al., Nucl. Phys. A583 (1995) 519.
- (21) C.P. Montoya et al., Phys. Rev. Lett. 73 (1994) 3070.
- (22) P.Glassel et al., Zeit. Phys. A310 (1983) 189.
- (23) Y. Larochelle et al., Phys. Rev. C55 (1997) 1869.
- (24) D.Cussol et al. (INDRA Collaboration), Phys. Rev. C65 (2002) 044604.
- (25) G.D.Westfall, Nucl. Phys. A630 (1998) 27c–40c.
- (26) W. Reisdorf, Nucl. Phys. A630 (1998) 15c–26c.
- (27) H.H.Gutbrod et al., Phys. Rev. 42 (1990) 640.
- (28) V.E.Viola et al., Phys. Rev. C31 (1985) 1550.
- (29) J. Pouthas et al., Nucl. Inst. and Meth. A357 (1995) 418.
- (30) J. Pouthas et al., Nucl. Inst. and Meth. A369 (1996) 222.
- (31) D.Doré et al. (INDRA Collaboration), Phys. Lett. B491 (2000) 15.
- (32) G.Bertsch, Phys. Rev. C29 (1984) 673.
- (33) C.Grégoire et al., Nucl. Phys. A465 (1987) 317.
- (34) S.Ayik and C.Grégoire, Nucl. Phys. A513 (1990) 187.
- (35) H.Feldmeier, Nucl. Phys. A428 (1990) 147.
- (36) J.Aichelin, Physics Report 202 (1991) 233.
- (37) A.Ono et al., Phys. Rev. C48 (1993) 2946.
- (38) A.Bonasera et al., Physics Report 243 (1994) 1.
- (39) D.Cussol, Phys. Rev. C65 (2002) 054614.