, , , , , , 111Present address: University of Jyväskylä, 40351 Jyväskylä, Finland, †, , 222Present address: Argonne National Laboratory, Argonne, IL 60439, USA , , , , , , 333Present address: CEA/Saclay DM2S/SERMA/LENR, 91191 Gif/Yvette CEDEX, France, , .
FISSION-RESIDUES PRODUCED IN THE SPALLATION REACTION 238U + p at 1 A GeV.
Abstract
Fission fragments from 1 A GeV 238U projectiles irradiating a hydrogen target were investigated by using the fragment separator FRS for magnetic selection of reaction products including ray-tracing and E-ToF techniques. The momentum spectra of 733 identified fragments were analysed to provide isotopic production cross sections, fission-fragment velocities and recoil momenta of the fissioning parent nuclei. Besides their general relevance, these quantities are also demanded for applications. Calculations and simulations with codes commonly used and recently developed or improved are compared to the data.
keywords:
NUCLEAR REACTION p(238U , x), E = 1 GeV/nucleon; Measured primary fission cross sections of 733 isotopes from Ni up to Eu; Measured fission fragment velocities; Inverse-kinematics method; In-flight separation by high resolution magnetic spectrometer; Identification in Z and A by ToF and energy-loss measurements; Relevance for accelerator-driven subcritical reactors and for production of radioactive beams.PACS:
24.75.+i: 25.40.Sc: 25.85.Ge: 28.50.Dr: 29.25.Rm1 Introduction
Fission of heavy nuclei excited at high collision energies has been investigated for the last decades. Produced by fragmentation or proton collision, the excited nuclei release their energy by emitting neutrons and charged particles, and eventually by fission. At low excitation energy, close to the fission barrier the probability of fission for nuclei around U stays constant or decreases at increasing excitation energy (first chance fission). Increasing further the excitation energy, two opposite tendancies are observed. High excitation energy and emission of charged particles reduce the probability of fission. On the other hand, neutron emission produces more and more fissile nuclei, enhancing fission. For the highest excitation energies, lighter elements which are less fissile, are created and finally fission vanishes. The competition between the various decay channels provides keys to understand the structure of hot nuclei, level densities, dissipation and disappearance of shell effects with excitation energy.
One of the first experimental approaches to the question of competition of the different decay-channels was opened with radiochemical and off-line mass separator techniques. G. Friedlander et al. [1] studied isotopic production of the alkaline elements rubidium and cesium in p + U and p + W reactions at various energies. This pioneering work already characterises the evolution of the symmetric breaking of the excited fragmentation residues as a function of the incident energy. A decade later, similar measurements on alkalines were undertaken using on-line mass separators [2, 3] which we will use as a basis for comparison in the following. Meanwhile many results evaluated in reference [4] were obtained to complete these first studies.
The energy dependence of the reactions already studied in reference [1] must be known and controlled for all applications. Until now this aspect has been explored by radiochemistry and -spectroscopy. The systems p + Pb [5] and p + Bi [6] were extensively investigated by using off-line -spectrometry in a wide range of energies.
Why do we start new studies on this question ? The new experimental equipment operating at GSI offers an efficient way to separate isotopes in inverse kinematics at relativistic energies. A 1 A GeV U-beam is delivered at the heavy-ion synchrotron (SIS), and in-flight separation techniques become applicable to all the energetic U residues. The inverse kinematics at relativistic energies provides fully ionised forward-focussed fragments which are separated by using the FRagment Separator (FRS) and identified by energy loss (E) and time-of-flight (ToF) measurements. Each of the isotopic cross-sections can be determined, and the kinematics of every residue can also be reconstructed. Based only on physical properties of the ions, the method does not depend on chemistry. As beta-decay half-lives are much longer than the 0.3 s separation time, primary residues are observed.
One of the important findings of the combination of the relativistic U beam at SIS with the FRS separation techniques was the identification and yield measurement of 117 new neutron-rich nuclei down to the sub-nanobarn level, among which the doubly-magic nucleus 78Ni [7, 8]. The efficiency, selectivity and high sensitivity of the method was clearly demonstrated. It triggered new efforts to produce beams of exotic nuclei by in-flight techniques.
Apart from the scientific interest of proton induced spallation reactions, applications were soon looked upon. For the purpose of Accelerator Driven Systems (ADS), for energy production and transmutation of nuclear waste [9], a great number of data sets were missing. Spallation targets for neutron-sources require extensive data in the same domain. Patents were approved in Germany and France [10]. Thus a campaign of systematic measurements was undertaken to obtain isotopic production cross-sections for a number of systems with an accuracy of about 10% and an improved understanding of reaction mechanisms in order to interpolate to other systems and energies below 1 A GeV.
For this purpose, at 800 A MeV Au + p [11, 12, 13], Pb + p at 1 A GeV [14, 15] and at 0.5 A GeV, Pb + d at 1 A GeV [16] and spallation from 1 A GeV U + p [17] and 1 A GeV U + d [18] were already studied and published. The missing part is still under analysis. Spallation of Fe on p and d was measured between 0.3 and 1.5 A GeV. Very recently, the systems Xe + p and Xe + d were measured between 0.2 and 1 A GeV to conclude this experimental program.
In this article we report on the (U + p)-fission products measured at 1 A GeV. The system plays the role of a prototype for high-energy nucleon-induced fission of an actinide. At high energies, data on fission of 238U induced by protons can be used as a benchmark for other actinide nuclei present in incineration situations.
The results on fission-residues in spallation of 1 A GeV 338U on protons together with our results on evaporation-residues [17] bring a comprehensive overview on this system. Earlier results on U-projectile fission were obtained on Pb [19, 20, 21, 22] and on Be [23] targets. Altogether they should lead to a coherent reconstruction of the intermediate systems after the primary cascade and nucleon evaporation preceeding fission. The reproduction of the data with standard codes, the intra-nuclear cascade-evaporation model LAHET [24] is far from being satisfactory. Improvements of codes have been published [25, 26, 27, 28], and are applied here.
Finally, the new data on isotopic yield measurements for 238U and 208Pb together with present and coming data on their energy dependence should provide a reference in order to control nuclide production in the forthcoming applications of proton-induced spallation.
2 Experiment
2.1 Experimental set-up
Uranium-ions delivered by the Penning source are accelerated in the UNILAC and post-accelerated in the SIS of GSI-Darmstadt. The beam energy of the 238U76+ ions on target is 1 A GeV and their velocity = 0.876. The average time structure is a pulse of 7 s every 13 s. The beam intensity delivered is 106 to 108 ions/pulse. It is controlled and monitored prior to the target by means of a secondary electron chamber, called SEETRAM [29].
A plastic target could not be chosen, since the production yields from C prevail upon the H yields in the mass region intermediate between fragmentation and fission. The uncertainties in the sharing between C and H in a plastic-target would not be consistent with our accuracy requirements.
The liquid hydrogen target used in the present experiment consist of a (1.25 0.03) cm thick circular cell closed by two thin parallel titanium windows. The cell is located at the bottom of an helium cryostat. Surrounding the cell, thin aluminised mylar reflectors and external titanium windows ensure thermal and vacuum insulation [30]. The hydrogen thickness of (87.2 2.2) mg/cm2 [11] is chosen to obtain a 10% reaction probability. The Ti target walls have a total thickness of (36.3) mg/cm2. Their contribution to the counting rates remains below 10%. It has been measured systematically using a “dummy” target of the same composition as the empty target cell.
2.2 Separation and identification in A and Z
At energies close to 1 A GeV, fission fragments are observed up to Z = 72 and
they are
nearly totally
stripped. In the worst case at Z = 72, less than 15% of the ions still carry electrons
[31].
They are momentum analysed with the fragment
separator FRS, a double-stage achromatic spectrometer with an
intermediate dispersive image plane S2 and a final image plane S4 [32].
A schematic view of the FRS and detectors is shown in Fig. 1.

In S4 the separated fragments are identified in Z by their energy losses measured in a four-stage ionization chamber, MUSIC [33]. The mass number A of the analysed fragments is determined from a measurement of velocity and magnetic rigidity between S2 and S4. The measurement is performed by two position sensitive plastic scintillators [34]. The times and positions in S2 and S4 have to be known accurately in order to correlate the time of flight with the precise length of the flight-path. Fission fragments fill the full phase space defined by the acceptance of the FRS. The presence of the 5 mm thick scintillator in S2 slightly alters the achromaticity of the FRS. Nevertheless 36 elements from Z = 28 to 64 are simultaneously transmitted to S4. Signals from the S4 scintillator trigger the data-acquisition system. Mass and charge numbers are calibrated by comparison to the parameters of the primary uranium beam and by using the known structure of fission yields in the asymmetric fission domain.
2.3 Constitution of the momentum spectra
The momentum acceptance of the FRS is 3 %. Applying the basic relation
| (1) |
with Z and A numbers determined, a 3 % fraction of the spectrum is obtained for each measurement. The total spectrum of transmitted fission fragments covers a range of 7 % to 20% of the reduced momentum of the projectile, . The measurements consist of a 2 % step-by-step scanning of the FRS magnetic fields tuned on cadmium, (Z = 48). After normalisation to the incoming dose given by the SEETRAM, and dead-time corrections, complete distributions are reconstructed by assembling about 10 files of overlapping B settings to produce a spectrum for each of the isotopes;
| (2) |
where ni () is the ith bin of the
spectrum, Ti is the dead time fraction
and Ni the number of incident ions for
this measurement.
All in all 4106 events were
accumulated.
Fragments are spread over 20 cm in the image plane at S2 covered by the
first
position-sensitive scintillator. For an identified isotope the
distribution in S2
depends only upon , and the accuracy on S2 position governs
the accuracy of the magnetic rigidity.
In the present case, a precision in position of 2.5 mm (FWHM) leads to a
resolving power of
/ = 2600, given the dispersion
in momentum of the first stage of the FRS by percent,
D = 6.5 cm/.
In this experiment the response of the scintillator was slightly
non-linear, and a routine was systematically used in the analysis
software to
correct for this, [11].
The FRS magnetic fields tuned on Z = 48 guide this element to the
center of S4
and display on both sides the neighbouring elements, gradually apart
from the center of
S4. The 36 elements are transmitted together to the final focus S4, and
momentum distributions of the produced isotopes are
simultaneously measured in one series of B settings of the FRS.
The spectra can be converted to the projectile frame and
are presented in cm/ns as velocity spectra in the system of the
projectile.
This coordinate system is appropriate for comparison with previous results
concerning fission from target nuclei.
Moreover, at high excitation energy, fission fragments are emitted
isotropically in the fissioning system [19, 35]. This allows for
analytical formulations
to be used in the analysis of the distributions.
2.4 Description of the velocity spectra

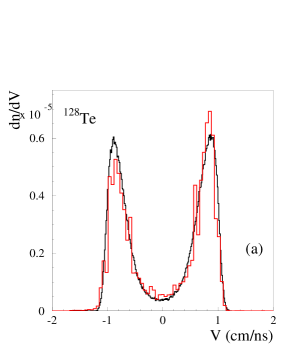
The reconstructed velocity spectra are the corner stones of our analysis. An example of the velocity spectrum is shown in Fig. 2b. Two narrow asymmetric peaks are observed roughly equidistant from velocity zero, i. e. the projectile velocity. Velocities are defined in reference to the beam direction i. e. forwardly and backwardly emitted fragments have positive and negative velocities, respectively. The velocities of the fission fragments arise from their Coulomb repulsion at scission. Velocity vectors of a specific isotope populate a thin spherical shell in the fissioning system, which may be slightly shifted compared to the projectile system by the primary reaction recoil. The sphere is pictured in Fig. 2a by a circle, the cut of the sphere by a plane which contains the beam. Only forward and backward cups of the sphere, defined by the angular acceptance of the FRS , are transmitted, and the longitudinal projections of their velocity distributions are shaping the two peaks (Fig. 2b).
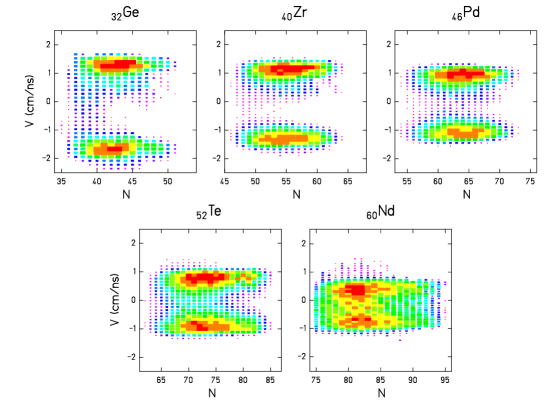
For selected elements the velocity spectra of all isotopes are
presented on scatter-plots
in Fig. 3. Rates are given in terms of
velocities and of neutron number N.
They all show strongly populated areas along two parallel lines
associated
to backward and forward emitted fission fragments. The lines, almost
symmetric in respect to
the axis (V = 0, i.e. projectile frame), show a fission fragment velocity
decreasing with
increasing atomic number Z
of the fragment, a trend due to momentum conservation in fission.
The parallel lines contrast with U + Pb scatter-plots
[22] where 1)
neutron-rich nuclei are strongly enhanced for zirconium and tellurium
due to electromagnetic fission and 2) fragmentation residues
sit in between the forward and backward regions for
neutron-deficient isotopes. In spite of the absence of evaporation residues,
at decreasing masses of the lighter elements,
events with small velocities are found. Besides the small contribution
of fragmentation residues produced in target windows,
this is a first indication for
the contribution of secondary reactions which will be discussed in the
following section.
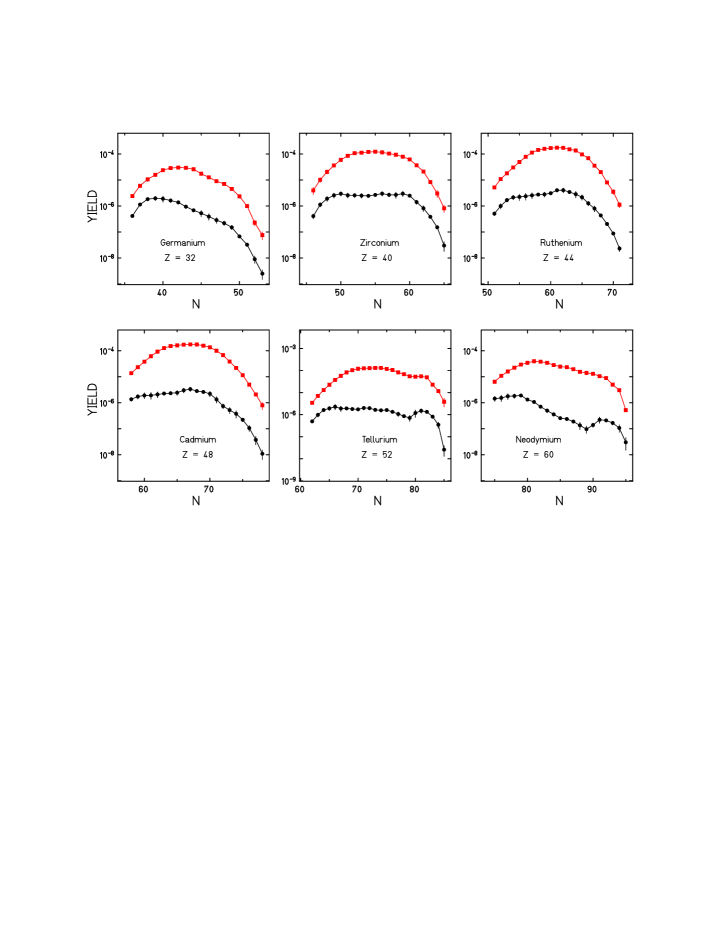
Data taken on the “dummy” target show the same pattern as in Fig. 3 with a contribution of fragmentation. Yields are defined by the integrated velocity spectra. Isotopic distributions of yields in the ”dummy” and in the target are compared in Fig. 4. As intended, the yields in the “dummy” are only a few % of the yields in the target, except in the neutron-deficient region where they reach larger values, but less than 20% . Asymmetric fission, leading to neutron rich isotopes, is also clearly enhanced for titanium relatively to hydrogen. The hydrogen contribution is obtained by subtracting the yields on the ”dummy” from the target yields. Uncertainties are estimated from the fluctuations of the intensity ratio of the two peaks, as will be discussed later. The error bars on yields measured for the “dummy” are negligible when reported to yields on hydrogen.
Evaluating velocities, the distributions on target and “dummy” are found to be very similar for a given isotope, and the yield of the “dummy” is on a few percent level. Therefore, the contribution of the titanium windows could be ignored in the evaluation of fission-fragment velocities in U + p.
2.5 Fission velocity and transmission
The geometrical aperture of the spectrometer seen from the target defines a solid angle simply related to the angular acceptance assuming axial symmetry. is the limiting value for the emission angle of transmitted fission fragments in the laboratory system. corresponds to angles and in the fissioning system with F and B set for forward and backward, respectively, see Fig. 2a. The angular transmission TΩ is defined as the ratio of the yield measured for a given fission fragment to the total production yield for this fragment.
The determination of TΩ is a key to obtain the cross-sections. It depends upon fission fragment velocities and it must be evaluated for each fragment. TΩ is a function of the three variables , representing the beam and the fission process with Vf = .c, the fission velocity, i.e. the radius of the sphere shown in Fig. 2a. As shown in Appendix 1, for a bundle of particles with an angular divergence starting from a point-like source and entering the FRS on its principal trajectory, the transmission TΩ can be calculated rigourously, without any approximation, when setting the variances to zero. In the fissioning system, TΩ is obtained by integrating the surface elements of the spherical velocity shell within the two solid angles, and we obtain [22]:
| (3) |
In Fig. 2b the velocity distribution of transmitted 128Te is
given as an example. Three quantities are evaluated from these
distributions:
1) The spectrum dn() / d()
integrated over the whole range of , evaluated for each
of the isotopes gives the measured yields.
2) A shift of the mean velocity of forward and backward emitted
fission fragments, compared to
the projectile velocity (V = 0) gives the velocity of the fissioning
parent nucleus, the recoil velocity.
3) The centroid of each of the two peaks defines a mean
fission-fragment velocity, the apparent
velocity = Vapp/c different for forward and
backward emitted fragments. We define the mean value of the two
apparent velocities,
| (4) |
The two peaks are shaped by the variances of the three variables , and , as will be shown later by a Monte-Carlo simulation. With all variances set to zero -Fig. 5a- the peaks become rectangles, as the phase-space density of a spherical homogeneously filled shell per interval d with the longitudinal velocity, is constant. The projection of the spherical shell on the beam axis is a rectangle. In this case the apparent velocity of forward and backward emitted fission fragments (see Fig. 2) is given by:
and the mean value follows:
| (5) |
With eq. (3) defining the transmission, we obtain the fission velocity depending on and TΩ:
| (6) |
from which the limiting cases are deduced = for TΩ = 0, and = 2 for TΩ = 1.
In Appendix 1 we show that with = ( + )/2 the fission fragment velocity and the transmission TΩ are given in very good approximation by:
| (7) |
| (8) |
with
| (9) |
is defined by and the velocity of the fissioning parent nucleus approximated by
| (10) |
Eq.(7) and (8) demonstrate the central importance of the ratio /2.
Summarising the procedure:
-
•
From the distribution, the mean apparent velocity = ( + )/2 is evaluated for each isotope.
-
•
TΩ and are simple functions of the mean opening angle = ( + )/2.
-
•
is related to the acceptance angle of the spectrometer and to the projectile velocity
2.6 Simulation of the angular cut of the FRS
In order to include the variances on the FRS angular acceptance and the
kinematics of
fissioning nuclei, we have simulated the physical cut in
phase space due to the angular acceptance of the FRS. The purpose is to
relate Vf and the transmission to the measured Vapp.
The Monte-Carlo calculation is based on the following assumptions:
1) In the system of the fissioning parent nucleus, approximated by the
system of the projectile nucleus, fission fragments are
isotropically emitted with a given velocity Vf.
2) The spherical shell of velocity vectors is converted to the
laboratory system moving relativistically with a velocity .
Fragments emitted within the FRS acceptance angle are
transmitted.
At this stage we obtain a transmission value and the momentum spectrum
in the laboratory system.
3) This spectrum is reconverted into the projectile system.
4) Variances of velocities and of the acceptance angle are
further parameters which are included.
The simulation enlightens the effects of the experimental constraints
on the measurement.
On Fig. 5a the forward and backward rectangles correspond to the
share of transmitted fission-fragments with = 0.
A filled rectangle would be obtained
for smaller than and TΩ
would then reach 100 %.
The second curve in the same frame results from the introduction of a
variance of the acceptance
angle = 2.5 mr derived from the known geometry of
the FRS [36, 37].
It shows that the filling of the spectra at intermediate velocities
comes mainly from the large variance of the FRS acceptance angle.
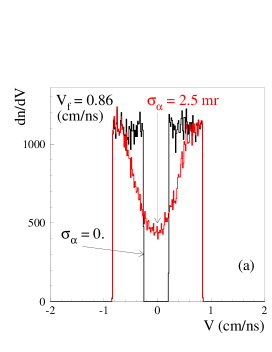
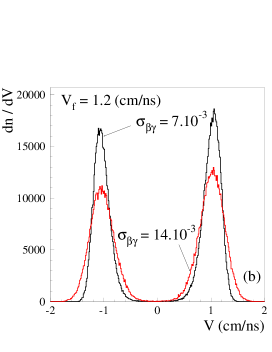
Fig. 2b versus Fig. 2a shows that the external slopes depend only on the fluctuations of the reduced momenta of the fission fragments and/or of the fissioning nuclei. Several sources contribute to these fluctuations - fission fragment velocities, target location straggling and recoil momenta of the fissioning nuclei -, and lead to a broadening of the peaks as illustrated on Fig. 5b. The relative contributions of these sources are quantified in the discussion, see sect. 4.8.
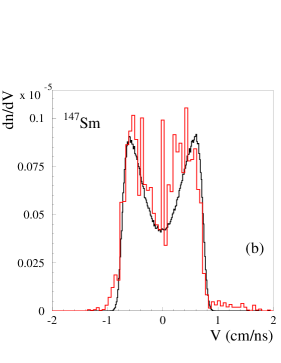
With = 7.10-3 the external slopes are almost vertical and the value of Vf = 1.2 cm/ns introduced in the simulation can be extracted from the distance between the external sides at half maximum. On the contrary, if becomes larger than the width of the rectangles of Fig. 5a, this half-maximum rule is no longer valid, as seen for = 14.. A value of = 7.10-3 is selected as an “empirical broadening” to optimize the simulation. The result is illustrated in both examples of Fig. 6a and 6b.


The relation between Vapp and Vf either from eq. 6 or from the simulation are very close as shown in Fig 7(a) and the trends at TΩ = 0 or 1 are correct in both cases. Simulated and calculated values of TΩ are the same for fission velocities larger than 0.8 cm/ns ( Fig. 7b). For smaller velocities the calculations, which do not include the large variance of the acceptance angle, cannot describe the transmission. Approaching TΩ = 1 the simulation accounting for the variances provides better results. It is seen on the velocity spectra of isotopes of neodymium to gadolinium where a few isotopes (the heaviest isotopes showing the largest fission velocities) still show a residual valley between forward and backward peaks. In the following transmissions and fission fragment velocities are obtained using the values of Vapp determined for each isotope and the fitted curves of Fig. 7.
3 Experimental results
3.1 Fission fragment velocities

The velocity spectrum of each isotope has been analysed to extract a value of the apparent velocity. The apparent velocities have been converted into fission fragment velocities. For a given element, the fission fragment velocity decreases smoothly from a maximum value for the heaviest isotopes down to values smaller by 10% for the lighter isotopes, Fig. 8. Further down to the most neutron-deficient isotopes, the velocities fall abruptly. In case of U+p, this fall cannot be related to the occurence of evaporation residues since this process does not populate the neutron-deficient region of fission fragments. The small contribution from fragmentation yields in the Ti-windows (Fig. 4) cannot explain the observed fall in velocity of 20%. This fall is due to secondary reactions in which heavier primary fission fragments loose nucleons in a secondary fragmentation reaction in the target. Atomic numbers and masses are reduced, whereas the velocity spectra are only blurred. These contributions - due to larger Z with smaller fission-fragment velocities - are superimposed with the spectrum of the primary isotope. This contamination reduces the apparent velocity of the isotope. It becomes significant in the neutron-deficient region where productions by direct fission is low and secondary-reaction products are abundant. However, the small velocities of the lightest isotopes of neodymium cannot be explained by this argument, as secondary reactions of fission fragments contribute little. Here secondary reactions of spallation products could pollute the yields of neutron-deficient fission fragments.
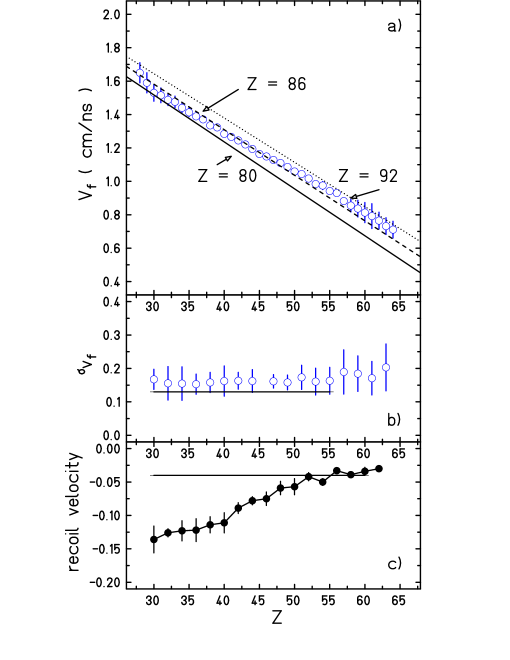
The velocity of an element is taken as the mean value of the velocities for the four isotopes most abundantly populated, in order to select the dominant symmetric fission regime. This velocity is plotted as a function of Z in Fig. 9a. The uncertainties are less than 4%. Three lines are indicated showing the velocity dependence expected for three values of the nuclear charge of the fissioning parent nucleus Z0 = 92, 86 and 80 [38, 39]. The scission configuration of the fissioning nuclei is approximated by the outline of two deformed nuclei ( = = 0.65) at a given distance. Using momentum conservation, the fragment velocities are calculated for the total kinetic energies released from the scission configuration.
None of the three lines coincides exactly with the data. Fissioning nuclei with Z0 between 84 and 90 can contribute to the production of fission fragments. The general trend towards smaller fission fragment velocities going from neutron-rich isotopes to neutron-deficient isotopes is observed for all elements (Fig. 8) corroborating that heavy (Z = 90) and light (Z = 84) parent nuclei do contribute. The first ones contribute to the more neutron-rich and the last to less neutron-rich isotopes.
The slope of the external edges of the velocity distributions introduced empirically in the simulation (Fig. 5b) as a variance are now evaluated systematically as a function of Z and plotted in fig. 9b). Unfolding these measured values and the underlying rectangle of the transmitted momenta, fig. 5a, the effective broadening is obtained, and given by the line in fig. 9b. Both variances are related by = c. Within the limit of our accuracy this width does not depend on the atomic number. Its mean value is = 0.13 cm/ns, which corresponds to 8.10-3 in good agreement with the value of 7.10-3 empirically deduced in sect. 2.6, from the simulations of the measured spectra (Fig. 5b).
The recoil of the fissioning nucleus is determined from the mean value of the forward and backward fission velocities. The values plotted in Fig. 9c are averaged over the four most abundant isotopes of an element. This recoil is small and it decreases from -0.03 at Z = 62 to -0.13 cm/ns for Z = 30. We obtain a mean value of -0.08 cm/ns.
3.2 From yields to cross sections
Isotopic cross sections of (U + p)-fission are obtained by dividing the production yields on hydrogen by the proper transmission, as presented in sections (2.5) and (2.6). Our final values are compared to those used in the analysis of the parallel experiment U + d at 1 A GeV evaluated by J. Pereira applying a different method [36]. A good agreement is found between both sets of transmission-values evaluated in terms of the fission-fragment velocities.
The correction for secondary reactions occuring in the target has to be applied. All fission fragments, neutron-rich more than proton-rich undergo secondary spallation and the yield is depleted. For neutron-deficient isotopes, the fission yields are increased by secondary evaporation residues. The correction for secondary reactions enhances the share of neutron rich isotopes and reduces neutron-deficient ones. This is the reason for the “hook” shape of this correction already presented in a previous article [15] and calculated more precisely in a forthcoming paper [41]. When they exceed 50 %, cross sections for corresponding isotopes are no longer considered. Our experimental method to determine cross sections of primary residues reaches its limit.
Moreover, small secondary effects need to be corrected for: For fragments not centered in S4, i. e. apart from the optical axis, the FRS acceptance angle and consequently the transmission are slightly reduced. The FRS angular acceptance falls from 14.8 mr on the optical axis down to 13.3 mr at 8 cm apart from the axis in S4 [36]. A smooth parabolic function was used to account for this relative loss in transmission. The correction given in table 1, reaches 14% for elements like nickel and samarium.
Fragments reacting in the scintillator SC2 at S2 escape the magnetic filter of the second half of the FRS. The related loss increases linearly from 11 % for nickel up to 17 % for gadolinium. It is calculated using the total reaction cross section formulation of Karol [42]. The results are given in table 1 for the range of elements investigated.
| S4- | sec. react. | Z | S4- | sec. react. | Z | S4- | sec. react. | atomic | |
| Z | shift | in SC2 | shift | in SC2 | shift | in SC2 | charge | ||
| exchange | |||||||||
| 28 | 1.14 | 1.108 | 40 | 1.01 | 1.13 | 52 | 1.02 | 1.149 | 1.01 |
| 29 | 1.12 | 1.11 | 41 | 1.005 | 1.131 | 53 | 1.03 | 1.151 | 1.01 |
| 30 | 1.105 | 1.112 | 42 | 1. | 1.133 | 54 | 1.035 | 1.152 | 1.01 |
| 31 | 1.09 | 1.114 | 43 | 1. | 1.135 | 55 | 1.045 | 1.154 | 1.015 |
| 32 | 1.08 | 1.116 | 44 | 1. | 1.136 | 56 | 1.055 | 1.156 | 1.02 |
| 33 | 1.065 | 1.118 | 45 | 1. | 1.138 | 57 | 1.065 | 1.157 | 1.028 |
| 34 | 1.055 | 1.118 | 46 | 1. | 1.140 | 58 | 1.08 | 1.158 | 1.034 |
| 35 | 1.045 | 1.122 | 47 | 1. | 1.141 | 59 | 1.09 | 1.162 | 1.04 |
| 36 | 1.035 | 1.123 | 48 | 1. | 1.143 | 60 | 1.105 | 1.164 | 1.05 |
| 37 | 1.03 | 1.125 | 49 | 1.005 | 1.144 | 61 | 1.12 | 1.164 | 1.06 |
| 38 | 1.02 | 1.126 | 50 | 1.01 | 1.146 | 62 | 1.14 | 1.166 | 1.07 |
| 39 | 1.015 | 1.128 | 51 | 1.015 | 1.148 | 63 | 1.16 | 1.167 | 1.08 |
A loss by ionic charge exchange occurs, either in the target or in the plastic scintillator S2. Eventhough the probability is small for fission fragments at relativistic energies, this factor, negligible up to tellurium, reaches 9 % for gadolinium. Values, calculated using the code GLOBAL [31] are to be considered for heavy elements as shown in table 1.
3.3 Discussion of uncertainties
a) Systematic uncertainties
-
•
The uncertainty on the SEETRAM calibration is evaluated to 7 % [29]
-
•
The uncertainty on the transmission is evaluated to 5 %. It is mainly due to the 4 % uncertainty on the fission-fragment velocity.
-
•
The uncertainty on the target thickness was established in a dedicated experiment to 2.5 % [11] for a beam hitting the target in its center. However, an uncertainty of 6 mm in the vertical position of the cryostat supporting the H2 cell leads to an increased uncertainty of 4 % on the target thickness [17].
-
•
The loss factors given in table 1 are determined with an overall uncertainty of 3 %.
All contributions quadratically added up lead to a total systematic uncertainty of 10 %. This systematic uncertainty is not included in the error bars of the cross sections presented in tables of Appendix 2 and in figures 10-12.
b) Statistical uncertainties
-
•
The single-event uncertainty on the angular transmission is large and mainly determined by the large variance of . is evaluated to 17 % [36].In comparison the uncertainty on is negligible. Taking 50 observed events corresponding to the smallest cross section (20b) as the worst case, the statistical uncertainty for the transmission reaches 4 %. Statistical uncertainties are smaller than the systematic uncertainty.
-
•
Uncertainties for the yields have been determined from the ratio of the rates integrated for forward and backward emitted fragments. The difference between the measured ratio and the kinematically expected ratio, is taken as twice the relative uncertainty of the yields. The absolute uncertainties are given in Fig. 4, Fig. 10-12 and in Appendix 2. For the most abundant isotopes the relative uncertainty is approximately 2 %, that is much less than the systematic uncertainty. For the less abundant isotopes, the statistical uncertainties are dominant and overcome the total systematic uncertainty.
Isotopic cross sections are given in Appendix 2 and their distributions for each of the elements appear in Fig. 10-12. They show a rather regular bell shape with some enhancement in the region of neutron-rich isotopes for elements known as asymmetric fission products. At the maximum of the elemental distributions, cross sections vary from 0.5 mb to 20 mb. Values down to 20 b are measured, mostly in the neutron-rich region not polluted by secondary reactions. On the neutron-deficient side, high rates of secondary reactions limit cross-section measurements to values larger than a few mb.


3.4 Comparison with previous isotopic distributions
Measurements of primary isotopic cross sections had been performed for alkalines only. Using fast on-line separator techniques combined with the chemical selectivity of surface ionisation ion-sources [2, 3] relative cross sections were obtained covering a wide range of isotopes. The normalisation of the yields to cross sections was based on the results of G. Friedlander [1]. Production yields on U-fission were measured at a proton energy of 24 GeV for isotopes of the complementary elements rubidium and cesium [43]. The distributions are compared to our results in Fig. 13. At 24 GeV, besides fission, evaporation residues populate all elements down to the region covered by fission. Moreover, the excitation energy range covers a wider domain, and evaporation of charged particles and neutrons leads to more neutron-deficient isotopes. The elemental cross sections for both rubidium and cesium are about 75 % of the values presently measured at 1 GeV, in the same ratio as total fission cross sections [4]. In the region of the 8 most neutron-rich fragments, isotopic cross sections are the same as the ones presently measured. The probability to excite the U nucleus with a small excitation energy to produce neutron-rich fragments is independent of the proton energy, as indeed mentioned already in [1].

Later the production of the isotopes of cesium and rubidium was investigated for the system 238U + p at 1 GeV by using also on-line mass separator techniques [3]. For rubidium our data are very consistent, but cross sections are found larger by a factor 1.8 for the six cesium-isotopes with N85, as seen in Fig. 13. In the present experiment, isotopic yields are measured simultaneously for the 36 elements populated in fission, insuring a coherent mass calibration for cesium as for all other elements including rubidium. Moreover the extraction of the asymmetric fission component of all elements achieved in sec. 4-3 confirms the present mass calibration. Finally the agreement of our isotopic distributions with those of the light elements analysed in the work of [44], also validates our results for the cesium isotopic distribution. In the on-line mass-separator measurement [3] the separation efficiency might have overestimated for these isotopes.
4 Features of fission
4.1 Elemental cross sections
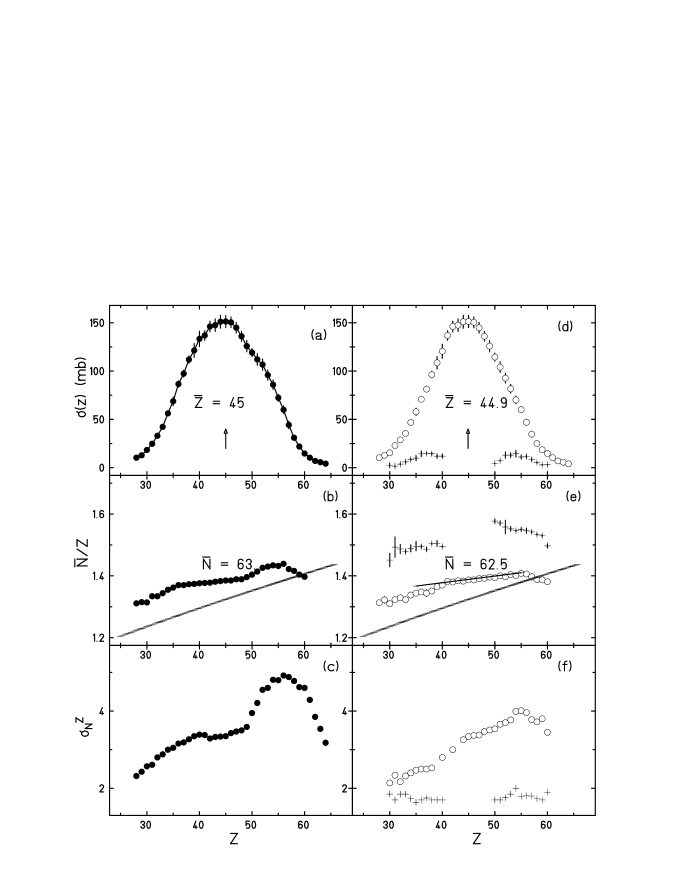
The elemental cross sections, integrated over isotopes for each element are plotted in Fig. 14a. The distribution shows a Gaussian shape with a shoulder around Z = 52 revealing the contribution of asymmetric fission. The mean value of Z is = 45. It suggests that 90Th is the mean element undergoing fission. The variance of the Z-distribution is 7 charge units.
In Fig. 14b the ratio of the mean number of neutrons /Z for each element is given. The largest mean number of neutrons per element and coherently the largest variances are found around Z = 55. A mean number of neutrons = 63 is deduced.
The local variance , plotted on Fig. 14c, increases from 2.5 to almost 5. The presence of the asymmetric fission component is revealed by the maxima at the two peaks of asymmetric fission.
4.2 Total cross sections
The fission cross section summed over all isotopes is found to be (1.45 0.15) b. However, a few elements are not involved in the analysis, in the region above Z = 64 and below 28. Above Z = 64 the cross section contributing is evaluated to 7 mb [18]. Below Z = 28, the analysis of M. V. Ricciardi [44] gives a contribution of 72 mb. Thus the total fission cross section amounts to (1.53 0.15) b. This value compares well with previous results of direct measurements of fission cross sections (1.46 0.07) b and (1.48 0.06) b [35, 45], respectively. A value of (1.52 0.12) b was obtained in a recent measurement at GSI [46]. It is worth noticing that the present technique offers a high degree of selectivity and sensitivity to measure isotopic yields but a lower precision for total cross section measurements than simpler dedicated experiments. If the cross section for evaporation residues of 0.46 b, obtained by summing isotopic values found by J. Taieb in his analysis of the 238U 1 A GeV + p reaction [17] is added, a reaction cross section of (1.99 0.17) b is obtained. It agrees with the value of 1.96 b obtained by using the Glauber approach as described by P. J. Karol [42] with updated nuclear-density distributions [47], and with the INCL-calculation 1.94 b [28].
4.3 Symmetric and asymmetric fission
The isotopic distributions of elements above Z = 50 can be decomposed into fragments arising from two components: high-excitation symmetric fission and low-excitation asymmetric fission. A decomposition into two Gaussian distributions has been performed, as illustrated in Fig. 15. For the neutron-rich component the mean mass number Ap and the dispersion are found to agree with the values known in asymmetric fission, see for example C. Donzaud et al. [20]. For the light fission fragment group, the share of asymmetric fission does not exhibit so clearly and the known values of Ap and [20] are used as further inputs.
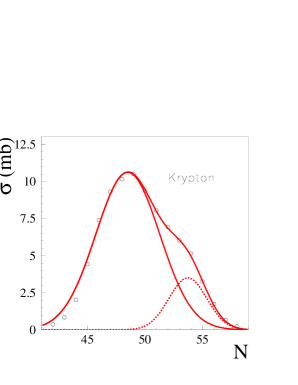
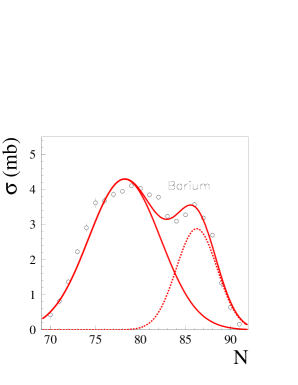
In spite of the small yields of the asymmetric component, cross sections for the groups of light and heavy fragments are obtained. Z-integrated cross sections are found the same for the two groups, as to be expected, and equal to (105 10) mb. For symmetric fission a cross section of (1.42 0.15) b follows. The distribution of elemental cross sections becomes a symmetric curve slightly shifted (empty points in Fig. 14d compared to the total distribution on Fig. 14a. The parameters / Z and variances related to the two modes are clearly different. Their values are compatible with two mean primary fissioning nuclei : for the asymmetric mode 234U and for the symmetric mode 221Th, with 6 post-scission neutrons added.
The / Z values of the fragments are not constant , but a slow and regular increment of / Z with the Z of the fragment is observed for the high energetic symmetric fission process, see Fig 14e. An electric polarisation = - = - Z2A0/Z0 0 for the fission fragment pairs , is indicated. Beyond the regime of nuclear structure dominating asymmetric fission (E∗ 40 MeV) a constant charge polarisability of P = -0.04 is expected [48]. P can be related to the slope of the / Z-dependence in the range of symmetric fission (Z0/2 = 45):
The thin line in Fig. 14e shows a slope calculated with P = -0.04.
On Fig. 14f the variance in the region of symmetric fission increases with the Z-value of the elements. On the contrary for asymmetric fission, as known for a long time [49], a narrow distribution of isotopes is populated with a large neutron excess /Z . Beyond Z = 55 the values of / Z and of decrease again and the valley of stability is crossed at Z = 58. For elements still heavier, fission fragments populate the neutron-deficient side of the valley.
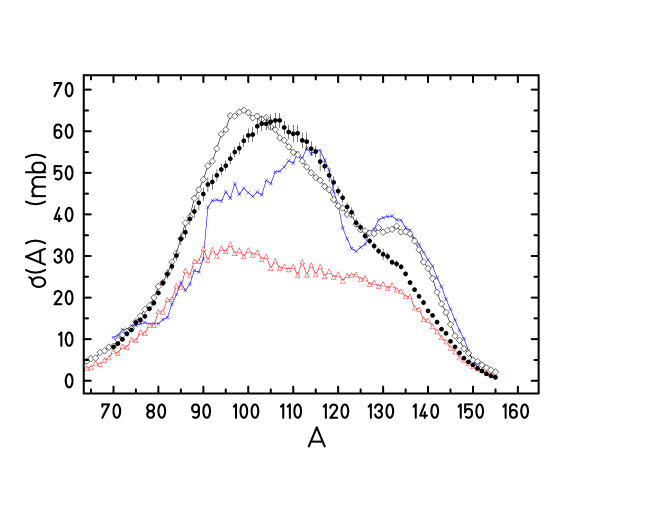
4.4 Mass distribution

The mass distribution is obtained by summing isotopic cross sections for a value of A fixed, Fig. 16. Since isobaric yields do not depend upon -decay half-lives, mass distribution are accessible also by radiochemical methods and spectroscopic methods [5, 6, 50]. The distribution shows a wide Gaussian-like shape slightly asymmetric: the slope is steeper on the side of light masses.
The mean mass is = 108.0 0.3 and the variance of the distribution = (17.5 0.5) a.m.u. Enhancements on both sides result from the asymmetric fission component. Since elements below Z = 28 are neglected, which contribute by about 5% to the total cross section [44], the value of given is slightly larger than the average over all fission fragments produced. We assume that*** fission proceeds from a mean parent nucleus of mass A = 220 with = 6 the averaged number of emitted neutrons from the symmetric and asymmetric modes. On table 2 the cross sections, mean values of A and Z, variances and local variances are presented and compared to the results of symmetric fission in (U + Pb) [21].
| reaction | |||||||
|---|---|---|---|---|---|---|---|
| (barn) | (MeV) | (a.ch.u.) | (a.m.u.) | (a.ch.u.) | (a.m.u.) | (a.ch.u.) | |
| U + p | 1.420.2 | 763 | 45.00.1 | 63.00.15 | 7.0 0.2 | 17.50.5 | 1.20.1 |
| U + Pb | 1.40.2 | 792 | 42.90.6 | 58.10.3 | 6.90.7 | 17.2 1.7 | 1.30.3 |
4.5 Kinetic energies

The average kinetic energy of fission fragments as a function of their atomic number is given by Ekin (Z) = .m0 where (Z) is the average mass number obtained from the measured isotopic distribution, and Vf is the corresponding fragment velocity as shown in Fig. 9a. The mean kinetic energies are given in table 3 and shown in Fig. 17. They decrease smoothly for higher atomic numbers and show a broad maximum around Z = 32. The mean value of the kinetic energy, calculated by using the Z-distribution of Fig. 14a gives (76 3) MeV, corresponding to a mean total kinetic energy release of (152 6) MeV.
| Z | [MeV] | Z | [MeV] | Z | [MeV] |
|---|---|---|---|---|---|
| 28 | 92.2 6.8 | 41 | 81.8 1.5 | 54 | 64.1 3.0 |
| 29 | 89.0 6.6 | 42 | 80.8 1.5 | 55 | 61.1 2.3 |
| 30 | 84.9 5.5 | 43 | 79.7 1.6 | 56 | 60.5 2.3 |
| 31 | 86.4 5.0 | 44 | 77.9 1.5 | 57 | 55.2 2.2 |
| 32 | 86.3 3.9 | 45 | 75.9 1.5 | 58 | 52.7 3.5 |
| 33 | 87.3 3.9 | 46 | 75.6 1.6 | 59 | 51.3 3.3 |
| 34 | 86.2 3.3 | 47 | 74.5 1.6 | 60 | 49.1 3.1 |
| 35 | 85.7 3.0 | 48 | 73.6 1.6 | 61 | 46.9 4.8 |
| 36 | 85.3 2.2 | 49 | 72.1 1.6 | 62 | 45.1 3.0 |
| 37 | 85.3 2.2 | 50 | 69.9 1.6 | 63 | 41.5 5. |
| 38 | 83.3 1.5 | 51 | 69.4 1.6 | 64 | 39.7 5. |
| 39 | 84.4 1.5 | 52 | 67.0 1.6 | ||
| 40 | 81.8 1.5 | 53 | 64.2 1.6 |
4.6 Comparison with simulation codes
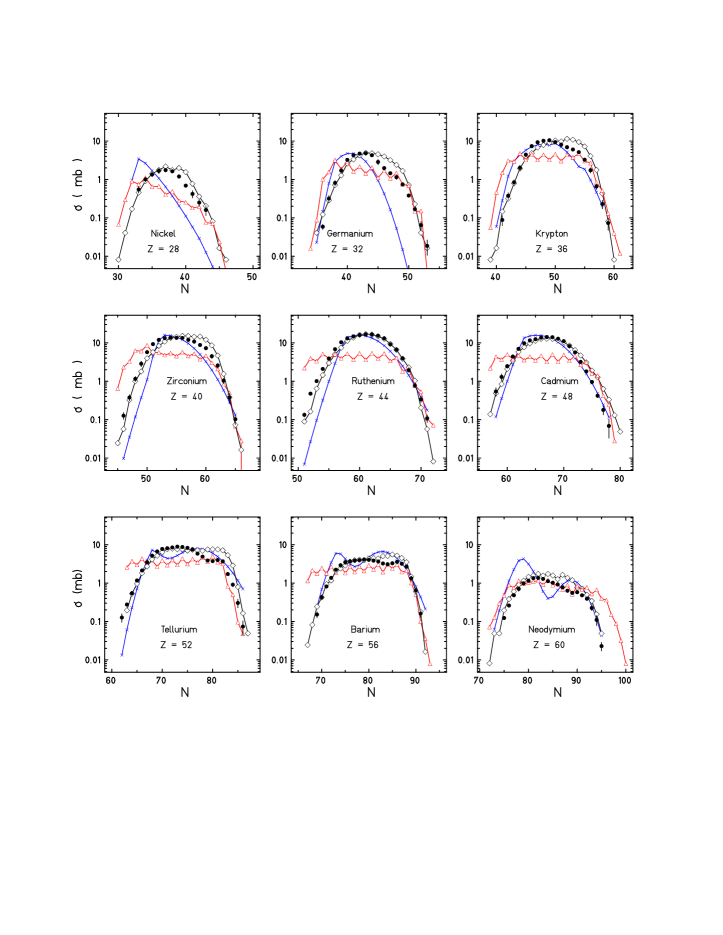
The set of isotopic distributions of fission fragments provides a real challenge for simulation codes. A fast and simple formulation developed by Silberberg and Tsao [51] is shown in Fig. 18 and 19. The model reproduces the orders of magnitude of the isotopic distributions, but the asymmetric fission component is overestimated in magnitude and symmetric components are too narrow. Isotopes of elements at and below Z = 35 are poorly reproduced. A jump at Z = 35 in the code produces the unrealistic gap in the mass distribution at A = 90.
The second code widely used is the LAHET-code (Los Alamos [24] or Oak Ridge version) [52]. The agreement with this code is not satisfying. In Fig. 18 and 19 the Oak Ridge version has been used for comparison. For neutron-deficient isotopes, cross sections are overestimated, and symmetric fission is underestimated. An odd-even staggering is produced not seen in the experimental data.
Parallel to our experimental program different approaches to new simulation codes are published or are under way. The first reaction step in spallation, the intranuclear cascade induced by the primary proton collision, is simulated by the new version of the code INCL [28]. At this stage, a distribution of prefragment nuclei are predicted with an associated excitation energy and intrinsic spin. This is then the physical input to a system of codes simulating the second step of spallation, the de-excitation phase. New results on the physics of particle evaporation were introduced in the statistical de-excitation code ABLA [25, 26] and on fission in the fission code PROFI [27].
The fission code PROFI is a semi-empirical Monte-Carlo code which calculates the nuclide distribution of fission fragments. It is theoretically based on the application of the statistical model of nuclear reactions to the concept of fission channels. In this model, the population of the fission channels is assumed to be basically determined by the number of available transition states above the potential energy surface near the fission barrier. Several properties, however, are finally determined at the scission time. A full description of the model is given in [27].
The barrier as a function of mass asymmetry is defined by three components. The first is the symmetric component defined by the liquid -drop potential by means of a parabolic function with a curvature obtained from experimental data [53]. This parabola is assumed to be modulated by two neutron shells, located at mass asymmetries corresponding to neutron numbers N = 82 (spherical neutron shell) and N = 90 (deformed neutron shell). We assume that the mass-asymmetry degree of freedom at the fission barrier is on the average uniquely related to the neutron number of the fragments. The shells are represented by Gaussian functions. These shells are associated with the fission channels Standard I and Standard II, respectively [54], while the liquid-drop potential is associated with the symmetric fission channel. The population of the fission channels is proportional to the level density around the corresponding dips in the potential at saddle at the available excitation energy. Shells are washed out with excitation energy [55]. The heights and the widths of the Gaussian curves representing the shell effects and additional fluctuations in mass asymmetry acquired from saddle to scission, are derived from experimental data [27]. The mean values of the neutron-to-proton ratio for the channels Standard I and Standard II are deduced from measured nuclide distributions after electromagnetic induced fission of 238U [20]. The charge polarisation for the symmetric fission channel and the fluctuations in the neutron-to-proton ratio for all channels are also considered by describing the potential in this degree of freedom again by a parabolic function [48]. Assuming that the equilibration in this variable is fast compared to the saddle-to-scission time, this potential was calculated in the scission configuration. Since the shell effects of the nascent fragments at scission, which are strongly deformed on the average, are not known experimentally, only macroscopic properties are included in the calculation of the charge polarisation of the symmetric fission channel.
Consequently, the two fission pre-fragments are obtained. Their excitation energies are calculated from the excitation and deformation energy of the fissioning system at the scission point. The fission probability and the consecutive de-excitation of the fission fragments via particle evaporation are conducted by the routines of the ABLA code [25, 26]. Coupling to the cascade code INCL [28] gives a reasonable reproduction of our data, as demonstrated in Fig. 18 and 19 (diamonds). Except for an excess of asymmetric fission the simulation meets the experiment. Either INCL provides a too small excitation energy for the most peripheral collisions, or the excitation energy in the statistical de-excitation chain is underestimated or, finally the parameter set in PROFI has to be reajusted in order to reduce the share of asymmetric fission.
4.7 Production of very neutron rich isotopes
The experimental method of 1 A GeV U-projectile fission opens a very efficient way to produce secondary beams of neutron-rich isotopes. In order to provide experimental cross sections for such a project, the production of very neutron-rich fragments by 1 A GeV U+p collisions is evaluated renormalising the values obtained from a previous dedicated measurement for U+Be [8]. The production of fission fragments differs in both systems because of a relatively larger contribution of asymmetric fission with U + Be. Normalising the elemental cross sections for U + Be to the corresponding element for U + p, the production of very neutron-rich can be deduced reliably down to a level of 1 nb. Not only the falls of the isotopic production with increasing neutron excess are the same for U + Pb and U + Be [20, 8], but also the production is found to be the same in the gap of overlapping masses presently covered in U + p.
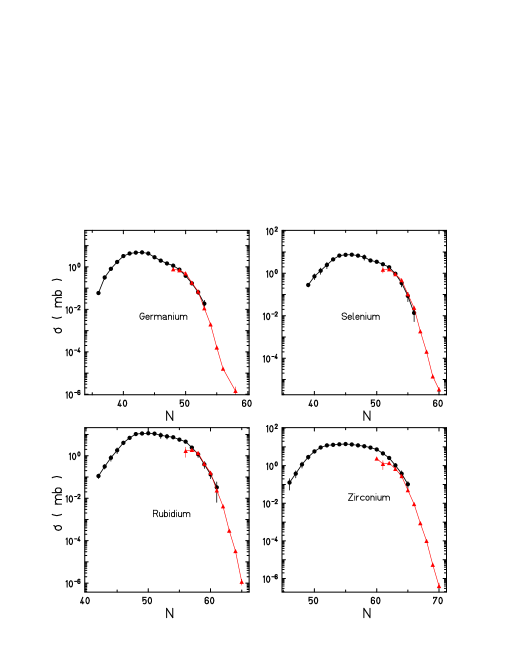
Fig. 20 illustrates four examples of isotopic distributions. Such exotic beams in spite of their low intensities will be of importance to test predictions for the vanishing of shell-effects at N = 82 and 50, and the possible appearance of neutron halos in the region of tin and nickel isotopes with large neutron excess.
4.8 Parent fissioning nuclei
The reconstitution of the charge Z0 and mass A0 of the parent fissioning nuclei is of importance to constrain critical parameters of the intranuclear cascade phase: the transfer of excitation energy and of momentum to the pre-fragments, the value of the density of intermediate states and of the viscosity of highly excited heavy nuclei. The present experimental findings should converge with all other results of 238U at 1 A GeV + p [17, 44, 46] on an unified description of a first stage of nucleon-nucleus collision described by a cascade followed by an evaporation stage among which fission occurs.
What is learnt about the fissioning parent nuclei in the present work is listed below:
-
•
Isotopic distributions lead to a mean fission parent nucleus 220Th.
-
•
For a given element the increase of the mean velocities with the mass of the isotopes (Fig. 8) indicates that parent elements in the range of Z0 90 do contribute to the fission.
-
•
Velocities of fragments Fig. 9a show that the region of 50 Z 64 arises from parent elements of 90, while the region of 30 Z 37 indicates lower fissioning elements at 84.
-
•
The variance of the fission fragment velocities is extracted from the external slopes of the observed velocity distributions and presented in Fig. 9b. The value of 0.13 cm/ns, the same for all fission-fragment elements, is correlated to the variance of the recoil momenta generated in the nuclear cascade for the ensemble of the fissioning parent nuclei. At A = 18, the analysis of spallation presented by J. Taieb [17] gives = 350 MeV/c as the variance of the recoil momenta of the central parent nucleus, 220Th. This variance is transferred to the fission fragments and leads to a contribution of 0.09 cm/ns in the fissioning system. The ensemble of parent elements and isotopes contributes also by the fluctuations of their TKE-values. A pair of fission-fragments issued from a fixed parent nucleus shows a variance of its velocities. Taking from thermal-neutron induced fission of 235U the measured value of = 6.0 MeV as a lower estimate, a contribution of 0.02 cm/ns to the variance of fission fragment velocities is calculated. A much larger contribution is generated by the difference in TKE-values of the many nuclei present. The variance in the Z0-distribution of the fissioning parent nuclei of /Z0 of 4.6% is taken from the measurement of B. Jurado [46]. Including the dispersion due to a spread over several isotopes in each element, and converting TKE-values into fragment-velocities, the contribution of the fissioning ensemble is evaluated to 0.09 cm/ns. The location straggling in the thin H2-target induces a negligible contribution of 0.01 cm/ns to this variance. Adding quadratically all contributions, a total variance of 0.13 cm/ns is obtained which coincides with the value extracted from the observed velocity distributions.
-
•
The mean recoil velocities of the parent fissioning nuclei arise from the first phase of the reaction and contribute to the momentum losses measured [17]. The transferred momentum of -150 MeV/c measured for the evaporation residues at A = 18 should be close to the momentum of the mean fissioning parent 220Th. This recoil momentum is equivalent to a recoil velocity of -0.04 cm/ns, indicated by a line in Fig. 9c. The recoil velocities presented in Fig. 9c, in the range of -(0.04-0.13) cm/ns are on the average larger by a factor of 2 and show a trend towards larger values for lighter elements.
4.9 Comparison of system U + p and Pb + p

| reaction | |||
|---|---|---|---|
| (barn) | (barn) | (barn) | |
| U + p | 1.99 0.17 | 1.53 0.13 | 0.460.08 |
| Pb + p | 1.84 0.23 | 0.16 0.07 | 1.680.22 |
Fig. 21 and Table 4 demonstrate the basic difference between the collision systems Pb + p and U + p. Both reactions have nearly the same reaction cross section, 1.84 b for Pb + p and 1.99 b for U + p. Fragmentation is the main reaction channel for Pb+p, with = (1.68 0.2) b, whereas fission dominates the U+p reaction with a cross section = (1.53 0.15) b.
Averaging over all cross sections from evaporation and fission residues, altogether a mean neutron number of 127 1 is found for reaction products of 238U + p at 1 A GeV, i.e. 19 1 neutrons are liberated in the reaction. This number does not include neutrons bound in the lightest elements ( Z 7 ), and should be an upper limit for the number of neutrons produced in thin targets. It compares with the neutron multiplicity of 20 measured with 1.2 GeV proton on depleted uranium [56] when extrapolated to thin targets.
5 Conclusions
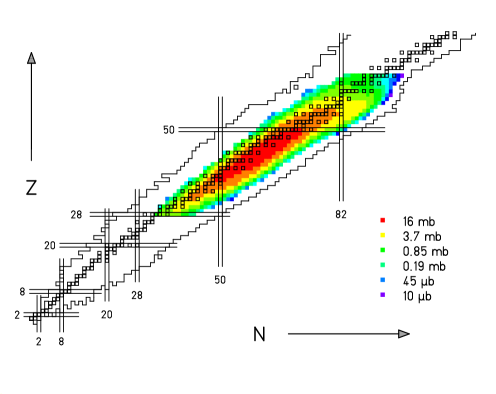
We have measured isotopic production cross-sections for about 733 fission fragments produced in 1 A GeV 238U + p collisions with a mean accuracy of 10 %, down to values of 20 b for neutron-rich and 0.1 mb for neutron-deficient isotopes. The population of isotopes resulting from fission is pictured in Fig. 22 on the chart of nuclei. The isobaric slope of the production cross section towards the neutron rich side of the chart of isotopes is found to be the same for hydrogen as for heavier targets investigated earlier.
The fission cross section, including the production of very light elements, amounts to (1.53 0.15) b which compares well with previous results [35, 45] as with the recent result of B. Jurado [46]. The total cross section of fission plus evaporation residues amounts to (1.99 0.17) b, close to the calculated geometrical cross section of 1.96 b [42, 47] and to the INCL calculation 1.94 b [28].
Our results show a good quantitative agreement with previous isotopic distributions of cross sections measured for rubidium and cesium with on-line mass-separator techniques except for a discrepancy in cross sections for the 6 most neutron-rich isotopes of cesium [3]. The coherence of the present experimental method validates our mass-calibration relatively to all other isotopes. Parameters characterising fission and its variances are extracted. The elemental distribution and the kinetic energies of the reaction products are of importance concerning chemical corrosion and the composition of nuclear waste produced by spallation of actinides.
The analysis of the momentum and velocity spectra of fission-fragments as function of A and Z gives an indication on the nature and the domain of excitation energies of the fragments arising from the first step of the (U + p)-interaction and undergoing fission. Comparison with previous measurements shows that the symmetric fission cross section (1.420.20) b is almost the same for U + p as for U + Pb, (1.4 0.2) b. In this last case the first phase of violent abrasion leads to a wider range of more excited and lighter fragments. The fission probabilities of these fragments are smaller than for actinides close to the U-projectiles which are mainly produced in (U + p)-collisions. Finally the cross section to observe symmetric fission remains the same for both systems.
There is certainly not a perfect overlap between the distribution of fragments identified as evaporation-residues and the fissioning parent nuclei. The parent nuclei close to U have high fissilities. For elements of decreasing Z numbers, fissile isotopes become more and more neutron-deficient. Compared to the evaporation-residues the fissioning-parent nuclei are shifted towards the neutron-deficient side. They are born from prefragments of higher excitation energies and their recoil momenta may be higher than for those ending as evaporation residues.
Measured isotopic and mass distributions are compared to results obtained with simulation codes commonly used. Large discrepancies are shown, and the need for improved reaction models is underlined. Models developed recently in the collaboration are discussed [25, 26, 27, 28] and the improvements achieved are demonstrated.
6 Acknowledgements
We wish to thank F. Ameil, K. Günzer and M. Pravikoff for their participation to the data taking and K. H. Behr, A. Brünle and K. Burkard for their technical support during the experiment. We are thankful to the group of P. Chesny who built the liquid-hydrogen target. We thank O. Yordanov and A. Kelic for their help and interest in the late stage of our work. This work was partially supported by the European Union under the contract ERBCHBCT940717.
7 Appendix 1
7.1 Demonstration of equations (7) and (8)
The transformation from the c.m.-system to the lab-system is given by:
| (11) |
with signs for forward and backward angles and , respectively. To transform back to the c.m.-system for the limiting case = , we solve equ. (11) for this case:
| (12) |
with K = / . It is convenient to solve equ. (12) as a quadratic equation in , which has 2 solutions corresponding to and given for = in the lab-system.
| (13) |
with an auxiliary variable
| (14) |
Equ. 13 shows that the angles and depend via eq. (14) on all 3 variables , and . The transmission of each of the cones may be evaluated with the total transmission obtained by summing T and T. This method we applied in our evaluations until now [13, 15, 16]. However, introducing the two solutions of equ. (13) into equ. (3) we obtain another very compact expression for TΩ:
| (15) |
Equ. (15) depends via the auxiliary variable on the fission velocity. To illuminate the variable we introduce = ( + )/2 and = ( - )/2, or = + and = - . Equ. (13) transforms to the new variables using the trigonometrical sum relations for and .
| (16) |
Angle depends only on two variables, and , which represent the relativistic beam and the FRS spectrometer. The fission velocity enters into the angle . Between and another trigonometrical relation holds
This relation introduced in equ. (3) gives for the transmission :
| (17) |
Comparing equ. (15) and (18) a relation between and follows:
The three expressions equ. (3),(15) and (18) are exact, identical representations in different angular coordinates. All expressions derived for the transmission until now depend on . The conversion of into the measured quantity makes use of equ. (6) and (14) :
| (18) |
Also equ. (6) and (19) are exact without any approximations.
For our experiment with = 2.07 and = = 14.8 mrad, is larger than by only 0.1 mrad. It is a good approximation to replace , the mean value of and , by the auxiliary variable . A next approximation for the transmission follows:
| (19) |
which deviates from the exact value by less than 0.2 % in the worst case of Z = 28. Neglecting terms in and K-2 useful approximations derived from eqs (16) and (17) are:
= and =
= + and = -
From equ. (20) and (6) we derive equ. (7) and (8).
With follows:
| (20) |
Finally with equ. (21) and TΩ can be presented as a function of , see equ. (7) and (8) given in section 2.5.
and
q. e. d.
8 Appendix 2
| Z | A | [mb] |
| 28 | 61 | 0.55 (10) |
| 62 | 1.00 (14) | |
| 63 | 1.35 (17) | |
| 64 | 1.67 (20) | |
| 65 | 1.75 (15) | |
| 66 | 1.67 (11) | |
| 67 | 1.20 (13) | |
| 68 | 0.69 (5) | |
| 69 | 0.42 (8) | |
| 70 | 0.25 (4) | |
| 71 | 0.16 (3) | |
| 29 | 63 | 0.49(12) |
| 64 | 0.89(16) | |
| 65 | 1.24(19) | |
| 66 | 1.70(17) | |
| 67 | 2.01(15) | |
| 68 | 2.08(13) | |
| 69 | 1.64(13) | |
| 70 | 1.20(8) | |
| 71 | 0.67(12) | |
| 72 | 0.39(4) | |
| 73 | 0.23(2) | |
| 74 | 0.11(5) | |
| 30 | 64 | 0.13(3) |
| 65 | 0.46(7) | |
| 66 | 0.94(13) | |
| 67 | 1.52(21) | |
| 68 | 2.41(20) | |
| 69 | 2.86(17) | |
| 70 | 3.00(9) | |
| 71 | 2.54(20) | |
| 72 | 1.95(23) | |
| 73 | 1.27(10) | |
| 74 | 0.88(7) | |
| 75 | 0.54(3) | |
| 76 | 0.26(3) | |
| 77 | 0.12(2) | |
| 78 | 0.047(21) | |
| 31 | 67 | 0.36(10) |
| 68 | 0.90(18) | |
| 69 | 1.60(20) | |
| 70 | 2.87(14) | |
| 71 | 3.58(21) | |
| 72 | 3.68(22) | |
| 73 | 3.60(54 | |
| 74 | 2.99(18) | |
| 75 | 2.16(37) | |
| 76 | 1.22(17) | |
| 77 | 0.82(7) | |
| 78 | 0.55(9) | |
| 79 | 0.30(2) | |
| 80 | 0.14(3) | |
| 81 | 0.033(14) | |
| 32 | 69 | 0.32(6) |
| 70 | 0.81(13) | |
| 71 | 1.71(26) | |
| 72 | 3.24(23) | |
| 73 | 4.28(21) | |
| 74 | 4.70(28) | |
| 75 | 4.83(18) | |
| 76 | 4.28(30) | |
| 77 | 2.85(45) | |
| 78 | 1.97(22) | |
| 79 | 1.45(10) | |
| 80 | 1.15(16) | |
| 81 | 0.74(6) | |
| 82 | 0.38(2) | |
| 83 | 0.17(1) | |
| 84 | 0.065(15) | |
| 85 | 0.019(8) | |
| 33 | 71 | 0.29(8) |
| 72 | 0.70(14) | |
| 73 | 1.63(26) | |
| 74 | 2.84(28) | |
| 75 | 5.01(30) | |
| 76 | 5.93(36) | |
| 77 | 6.10(30) | |
| 78 | 5.33(32) | |
| 79 | 4.50(27) | |
| 80 | 3.34(30) | |
| 81 | 2.62(13) | |
| 82 | 1.88(17) | |
| 83 | 1.36(13) | |
| 84 | 0.74(11) | |
| 85 | 0.36(4) | |
| 86 | 0.16(2) | |
| 87 | 0.03(20) | |
| 34 | 73 | 0.28 (5) |
| 74 | 0.70 (14) | |
| 75 | 1.30 (21) | |
| 76 | 2.42 (39) | |
| 77 | 4.42 (26) | |
| 78 | 6.68 (27) | |
| 79 | 7.25 (43) | |
| 80 | 7.37 (29) | |
| 81 | 6.64 (46) | |
| 82 | 5.67(80) | |
| 83 | 3.93(24) | |
| 84 | 3.41(14) | |
| 85 | 2.61(18) | |
| 86 | 1.88(11) | |
| 87 | 0.93 (9) | |
| 88 | 0.34 (6) | |
| 89 | 0.085 (25) | |
| 35 | 75 | 0.19(7) |
| 76 | 0.52 (10) | |
| 77 | 1.08(20) | |
| 78 | 2.37(38) | |
| 79 | 4.22(34) | |
| 80 | 6.79(20) | |
| 81 | 8.23(33) | |
| 82 | 8.49(51) | |
| 83 | 8.02(77) | |
| 84 | 7.23(72) | |
| 85 | 6.13(86) | |
| 86 | 4.66(56) | |
| 87 | 3.80(15) | |
| 88 | 2.92(23) | |
| 89 | 1.95(19) | |
| 90 | 0.75(10) | |
| 91 | 0.25(6) | |
| 92 | 0.06(2) | |
| 36 | 77 | 0.09(3) |
| 78 | 0.37(7) | |
| 79 | 0.84(13) | |
| 80 | 2.0(3) | |
| 81 | 4.43(40) | |
| 82 | 7.40(44) | |
| 83 | 9.31(56) | |
| 84 | 10.2(7) | |
| 85 | 10.5(9) | |
| 86 | 9.36(94) | |
| 87 | 8.04(96) | |
| 88 | 6.92(69) | |
| 89 | 6.03(36) | |
| 90 | 5.14(31) | |
| 91 | 3.26(16) | |
| 92 | 1.74(26) | |
| 93 | 0.66(11) | |
| 94 | 0.23(6) | |
| 95 | 0.07(2) | |
| 37 | 79 | 0.11(3) |
| 80 | 0.31(6) | |
| 81 | 0.80(13) | |
| 82 | 1.80(29) | |
| 83 | 4.05(40) | |
| 84 | 6.93(41) | |
| 85 | 10.5(5) | |
| 86 | 11.2(6) | |
| 87 | 11.4(6) | |
| 88 | 11.0(10) | |
| 89 | 9.2(14) | |
| 90 | 8.2(11) | |
| 91 | 7.4(6) | |
| 92 | 6.12(61) | |
| 93 | 4.6(2) | |
| 94 | 2.4(2) | |
| 95 | 1.17(18) | |
| 96 | 0.39(7) | |
| 97 | 0.13(3) | |
| 98 | 0.031(16) | |
| 38 | 83 | 0.63(18) |
| 84 | 1.58(27) | |
| 85 | 3.50(52) | |
| 86 | 7.02(49) | |
| 87 | 11.1(6) | |
| 88 | 11.8(6) | |
| 89 | 12.0(6) | |
| 90 | 11.9(7) | |
| 91 | 12.2(12) | |
| 92 | 10.2(12) | |
| 93 | 9.05(61) | |
| 94 | 8.24(50) | |
| 95 | 6.1(5) | |
| 96 | 4.36(26) | |
| 97 | 2.14(32) | |
| 98 | 0.88(18) | |
| 99 | 0.24(4) | |
| 100 | 0.069(14) | |
| 39 | 85 | 0.51(14) |
| 86 | 1.36(27) | |
| 87 | 3.21(45) | |
| 88 | 6.51(52) | |
| 89 | 10.3(5) | |
| 90 | 12.1(6) | |
| 91 | 12.4(7) | |
| 92 | 12.5(9) | |
| 93 | 12.4(9) | |
| 94 | 11.4(7) | |
| 95 | 10.5(5) | |
| 96 | 8.75(44) | |
| 97 | 7.36(37) | |
| 98 | 5.62(67) | |
| 99 | 3.81(27) | |
| 100 | 1.65(26) | |
| 101 | 0.68(17) | |
| 102 | 0.19(6) | |
| 103 | 0.04(2) | |
| 40 | 86 | 0.127(25 |
| 87 | 0.377(68 | |
| 88 | 1.15(17) | |
| 89 | 2.86(46) | |
| 90 | 5.73(45) | |
| 91 | 9.30(74) | |
| 92 | 12.0(5) | |
| 93 | 13.3(7) | |
| 94 | 13.7(7) | |
| 95 | 13.5(7) | |
| 96 | 13.4(8) | |
| 97 | 12.0(13) | |
| 98 | 10.8(11) | |
| 99 | 8.80(44) | |
| 100 | 7.30(73) | |
| 101 | 4.50(58) | |
| 102 | 2.57(36) | |
| 103 | 1.04(18) | |
| 104 | 0.38(11) | |
| 105 | 0.10(3) | |
| 41 | 89 | 0.30(7) |
| 90 | 1.05(21) | |
| 91 | 2.38(38) | |
| 92 | 4.55(55) | |
| 93 | 7.56(38) | |
| 94 | 10.5(4) | |
| 95 | 12.6(5) | |
| 96 | 13.7(5) | |
| 97 | 14.5(6) | |
| 98 | 14.4(9) | |
| 99 | 13.3(8) | |
| 100 | 11.9(8) | |
| 104 | 2.92(50) | |
| 105 | 1.56(44) | |
| 106 | 0.55(16) | |
| 107 | 0.19(10) | |
| 42 | 92 | 0.72(19) |
| 93 | 1.81(27) | |
| 94 | 3.58(43) | |
| 95 | 6.24(37) | |
| 96 | 9.68(48) | |
| 97 | 12.8(8) | |
| 98 | 14.0(7) | |
| 99 | 15.1(8) | |
| 100 | 16.2(10) | |
| 101 | 15.7(11) | |
| 102 | 14.9(12) | |
| 103 | 13.0(8) | |
| 104 | 9.91(49) | |
| 105 | 6.18(43) | |
| 106 | 3.96(20) | |
| 107 | 1.78(19) | |
| 108 | 0.91(27) | |
| 109 | 0.28(7) | |
| 110 | 0.08(4) | |
| 43 | 94 | 0.68(12) |
| 95 | 1.36(31) | |
| 96 | 2.69(30) | |
| 97 | 5.02(35) | |
| 98 | 8.11(40) | |
| 99 | 11.5(7) | |
| 100 | 13.3(7) | |
| 101 | 15.2(8) | |
| 102 | 15.9(10) | |
| 103 | 16.2(11) | |
| 104 | 15.8(9) | |
| 105 | 14.4(11) | |
| 106 | 11.6(9) | |
| 107 | 8.44(51) | |
| 108 | 4.88(34) | |
| 109 | 2.90(20) | |
| 110 | 1.31(26) | |
| 111 | 0.60(18) | |
| 112 | 0.17(8) | |
| 44 | 95 | 0.13(2) |
| 96 | 0.47(4) | |
| 97 | 1.01(7) | |
| 98 | 2.10(17) | |
| 99 | 3.91(23) | |
| 100 | 6.84(34) | |
| 101 | 8.77(60) | |
| 102 | 13.1(8) | |
| 103 | 14.7(7) | |
| 104 | 16.0(8) | |
| 105 | 16.7(10) | |
| 106 | 16.6(13) | |
| 107 | 15.4(11) | |
| 108 | 13.1(7) | |
| 109 | 9.17(46) | |
| 110 | 6.62(40) | |
| 111 | 3.95(31) | |
| 112 | 1.94(21) | |
| 113 | 0.77(8) | |
| 114 | 0.34(5) | |
| 115 | 0.11(2) | |
| 45 | 99 | 0.70(9) |
| 100 | 1.52(8) | |
| 101 | 3.00(15) | |
| 102 | 5.28(37) | |
| 103 | 8.62(60) | |
| 104 | 11.5(6) | |
| 105 | 14.2(6) | |
| 106 | 15.4(4) | |
| 107 | 16.6(10) | |
| 108 | 16.3(10) | |
| 109 | 15.7(9) | |
| 110 | 13.6(14) | |
| 111 | 11.7(6) | |
| 112 | 8.11(4) | |
| 113 | 5.11(25) | |
| 114 | 2.60(10) | |
| 115 | 1.40(5) | |
| 116 | 0.54(7) | |
| 117 | 0.20(10) | |
| 46 | 100 | 0.19(2) |
| 101 | 0.54(3) | |
| 102 | 1.21(6) | |
| 103 | 2.48(12) | |
| 104 | 4.36(17) | |
| 105 | 7.33(29) | |
| 106 | 10.7(7) | |
| 107 | 13.0(6) | |
| 108 | 14.5(6) | |
| 109 | 15.2(9) | |
| 110 | 16.2(13) | |
| 111 | 15.8(16) | |
| 112 | 14.8(12) | |
| 113 | 12.6(9) | |
| 114 | 9.58(38) | |
| 115 | 6.25(25) | |
| 116 | 3.57(14) | |
| 117 | 1.91(27) | |
| 118 | 0.93(11) | |
| 119 | 0.37(10) | |
| 120 | 0.12(2) | |
| 47 | 103 | 0.40(4) |
| 104 | 0.86(5) | |
| 105 | 1.81(9) | |
| 106 | 3.19(16) | |
| 107 | 5.73(23) | |
| 108 | 8.40(34) | |
| 109 | 11.4(8) | |
| 110 | 12.6(5) | |
| 111 | 14.0(7) | |
| 112 | 14.5(10) | |
| 113 | 16.0(17) | |
| 114 | 14.5(13) | |
| 115 | 13.5(8) | |
| 116 | 10.5(14) | |
| 117 | 7.73(31) | |
| 118 | 4.74(19) | |
| 119 | 2.64(18) | |
| 120 | 1.38(8) | |
| 121 | 0.65(3) | |
| 122 | 0.22(3) | |
| 123 | 0.07(1) | |
| 48 | 106 | 0.54(13) |
| 107 | 1.30(26) | |
| 108 | 2.47(30) | |
| 109 | 4.41(44) | |
| 110 | 7.00(35) | |
| 111 | 9.75(58) | |
| 112 | 11.6(8) | |
| 113 | 12.5(5) | |
| 114 | 13.7(7) | |
| 115 | 14.2(6) | |
| 116 | 14.0(6) | |
| 117 | 12.8(6) | |
| 118 | 11.1(4) | |
| 119 | 8.21(33) | |
| 120 | 5.64(23) | |
| 121 | 3.20(20) | |
| 122 | 1.80(13) | |
| 123 | 0.96(10) | |
| 124 | 0.42(5) | |
| 125 | 0.18(4) | |
| 126 | 0.069(34) | |
| 49 | 107 | 0.14(3) |
| 108 | 0.34(5) | |
| 109 | 0.77(8) | |
| 110 | 1.71(22) | |
| 111 | 3.15(41) | |
| 112 | 5.26(47) | |
| 113 | 7.78(70) | |
| 114 | 10.0(8) | |
| 115 | 11.3(7) | |
| 116 | 12.0(10) | |
| 117 | 13.0(8) | |
| 118 | 13.0(13) | |
| 119 | 12.7(9) | |
| 120 | 11.0(7) | |
| 121 | 9.22(37) | |
| 122 | 6.16(24) | |
| 123 | 3.98(16) | |
| 124 | 2.27(9) | |
| 125 | 1.38(8) | |
| 126 | 0.75(6) | |
| 127 | 0.41(6) | |
| 128 | 0.19(3) | |
| 129 | 0.08(2) | |
| 130 | 0.02(1) | |
| 50 | 110 | 0.23(2) |
| 111 | 0.56(6) | |
| 112 | 1.26(13) | |
| 113 | 2.39(24) | |
| 114 | 4.09(20) | |
| 115 | 6.38(25) | |
| 116 | 8.6(13) | |
| 117 | 9.97(40) | |
| 118 | 10.4(4) | |
| 119 | 11.0(4) | |
| 120 | 11.5(5) | |
| 121 | 11.6(5) | |
| 122 | 10.5(4) | |
| 123 | 9.28(37) | |
| 124 | 6.77(27) | |
| 125 | 4.82(20) | |
| 126 | 2.90(11) | |
| 127 | 2.00(8) | |
| 128 | 1.56(6) | |
| 129 | 1.29(5) | |
| 130 | 1.01(7) | |
| 131 | 0.66(7) | |
| 132 | 0.35(7) | |
| 133 | 0.05(3) | |
| 51 | 112 | 0.16(6) |
| 113 | 0.36(9) | |
| 114 | 0.82(12) | |
| 115 | 1.66(25) | |
| 116 | 2.97(23) | |
| 117 | 4.66(28) | |
| 118 | 6.6(5) | |
| 119 | 8.3(9) | |
| 120 | 9.1(5) | |
| 121 | 9.59(57) | |
| 122 | 10.2(5) | |
| 123 | 10.6(8) | |
| 124 | 10.2(5) | |
| 125 | 9.3(5) | |
| 126 | 7.63(45) | |
| 127 | 5.67(28) | |
| 128 | 3.88(31) | |
| 129 | 2.87(14) | |
| 130 | 2.43(12) | |
| 131 | 2.46(29) | |
| 132 | 1.85(27) | |
| 133 | 1.27(23) | |
| 134 | 0.42(25) | |
| 135 | 0.12(5) | |
| 52 | 114 | 0.12(3) |
| 115 | 0.27(3) | |
| 116 | 0.54(4) | |
| 117 | 1.16(8) | |
| 118 | 2.11(17) | |
| 119 | 3.48(31) | |
| 120 | 5.1(5) | |
| 121 | 6.61(53) | |
| 122 | 7.7(6) | |
| 123 | 8.02(48) | |
| 124 | 8.40(42) | |
| 125 | 8.80(35) | |
| 126 | 8.61(34) | |
| 127 | 8.18(33) | |
| 128 | 7.40(30) | |
| 129 | 5.79(35) | |
| 130 | 4.84(29) | |
| 131 | 3.83(23) | |
| 132 | 3.70(22) | |
| 133 | 3.94(39) | |
| 134 | 3.64(22) | |
| 135 | 1.70(17) | |
| 136 | 0.90(11) | |
| 137 | 0.30(8) | |
| 138 | 0.074(30) | |
| 53 | 116 | 0.06(1) |
| 117 | 0.17(3) | |
| 118 | 0.45(7) | |
| 119 | 0.82(8) | |
| 120 | 1.49(10) | |
| 121 | 2.50(15) | |
| 122 | 3.9(4) | |
| 123 | 5.4(5) | |
| 124 | 6.3(7) | |
| 125 | 6.8(4) | |
| 126 | 7.30(44) | |
| 127 | 7.60(30) | |
| 128 | 7.81(39) | |
| 129 | 7.54(30) | |
| 130 | 6.90(35) | |
| 131 | 6.06(36) | |
| 132 | 4.91(24) | |
| 133 | 4.38(31) | |
| 134 | 4.09(20) | |
| 135 | 4.32(21) | |
| 136 | 3.08(28) | |
| 137 | 2.29(21) | |
| 138 | 1.21(12) | |
| 139 | 0.53(13) | |
| 140 | 0.16(3) | |
| 141 | 0.038(8) | |
| 54 | 118 | 0.032(9) |
| 119 | 0.118(18) | |
| 120 | 0.25(2) | |
| 121 | 0.51(5) | |
| 122 | 1.01(7) | |
| 123 | 1.82(9) | |
| 124 | 2.91(17) | |
| 125 | 4.17(25) | |
| 126 | 4.99(40) | |
| 127 | 5.68(45) | |
| 128 | 5.88(41) | |
| 129 | 6.14(37) | |
| 130 | 6.27(38) | |
| 131 | 6.39(45) | |
| 132 | 6.01(18) | |
| 133 | 5.43(33) | |
| 134 | 5.05(30) | |
| 135 | 4.66(23) | |
| 136 | 4.48(27) | |
| 137 | 4.05(16) | |
| 138 | 3.96(20) | |
| 139 | 3.15(31) | |
| 140 | 2.11(25) | |
| 141 | 0.77(9) | |
| 142 | 0.32(4) | |
| 143 | 0.06(2) | |
| 55 | 122 | 0.12(3) |
| 123 | 0.27(4) | |
| 124 | 0.69(8) | |
| 125 | 1.27(13) | |
| 126 | 2.05(8) | |
| 127 | 3.03(15) | |
| 128 | 3.98(32) | |
| 129 | 4.60(32) | |
| 130 | 4.86(24) | |
| 131 | 4.94(15) | |
| 132 | 5.05(25) | |
| 133 | 5.24(26) | |
| 134 | 5.19(15) | |
| 135 | 4.74(24) | |
| 136 | 4.43(22) | |
| 137 | 3.89(27) | |
| 138 | 3.33(20) | |
| 139 | 3.55(21) | |
| 140 | 3.34(20) | |
| 141 | 3.40(13) | |
| 142 | 2.05(8) | |
| 143 | 1.04(3) | |
| 144 | 0.40(4) | |
| 145 | 0.12(2) | |
| 56 | 125 | 0.16(3) |
| 126 | 0.42(5) | |
| 127 | 0.82(8) | |
| 128 | 1.37(9) | |
| 129 | 2.23(17) | |
| 130 | 2.91(34) | |
| 131 | 3.50(50) | |
| 132 | 3.68(37) | |
| 133 | 3.86(34) | |
| 134 | 3.95(24) | |
| 135 | 4.11(21) | |
| 136 | 4.03(20) | |
| 137 | 3.85(20) | |
| 138 | 3.65(29) | |
| 139 | 3.24(22) | |
| 140 | 3.10(18) | |
| 141 | 3.28(23) | |
| 142 | 3.57(28) | |
| 143 | 3.19(16) | |
| 144 | 2.70(19) | |
| 145 | 1.33(17) | |
| 146 | 0.65(10) | |
| 147 | 0.16(3) | |
| 57 | 127 | 0.10(3) |
| 128 | 0.22(6) | |
| 129 | 0.55(8) | |
| 130 | 0.99(10) | |
| 131 | 1.56(14) | |
| 132 | 2.16(17) | |
| 133 | 2.73(22) | |
| 134 | 3.12(19) | |
| 135 | 3.24(23) | |
| 136 | 3.22(22) | |
| 137 | 3.21(16) | |
| 138 | 3.17(16) | |
| 139 | 2.97(24) | |
| 140 | 2.49(15) | |
| 141 | 2.24(16) | |
| 142 | 2.23(16) | |
| 143 | 2.20(18) | |
| 144 | 2.27(20) | |
| 145 | 2.31(18) | |
| 146 | 1.88(15) | |
| 147 | 1.25(19) | |
| 148 | 0.53(11) | |
| 149 | 0.20(5) | |
| 150 | 0.03(1) | |
| 58 | 130 | 0.17(6) |
| 131 | 0.33(6) | |
| 132 | 0.61(5) | |
| 133 | 0.96(9) | |
| 134 | 1.52(9) | |
| 135 | 1.96(20) | |
| 136 | 2.20(20) | |
| 137 | 2.34(16) | |
| 138 | 2.34(14) | |
| 139 | 2.28(11) | |
| 140 | 2.27(11) | |
| 141 | 2.08(12) | |
| 142 | 1.82(9) | |
| 143 | 1.60(10) | |
| 144 | 1.52(9) | |
| 145 | 1.45(10) | |
| 146 | 1.45(9) | |
| 147 | 1.33(9) | |
| 148 | 1.19(10) | |
| 149 | 0.75(4) | |
| 150 | 0.44(4) | |
| 151 | 0.11(4) | |
| 152 | 0.02(1) | |
| 59 | 131 | 0.053(13) |
| 132 | 0.104(21) | |
| 133 | 0.214(38) | |
| 134 | 0.362(36) | |
| 135 | 0.69(10) | |
| 136 | 1.09(11) | |
| 137 | 1.41(10) | |
| 138 | 1.66(12) | |
| 139 | 1.77(11) | |
| 140 | 1.73(14) | |
| 141 | 1.69(8) | |
| 142 | 1.59(8) | |
| 143 | 1.50(9) | |
| 144 | 1.43(7) | |
| 145 | 1.26(9) | |
| 146 | 1.13(12) | |
| 147 | 0.94(10) | |
| 148 | 0.84(7) | |
| 149 | 0.88(7) | |
| 150 | 0.73(7) | |
| 151 | 0.54(3) | |
| 152 | 0.27(2) | |
| 153 | 0.066(19) | |
| 154 | 0.012(6) | |
| 60 | 135 | 0.12(1) |
| 136 | 0.26(2) | |
| 137 | 0.48(3) | |
| 138 | 0.71(9) | |
| 139 | 0.99(6) | |
| 140 | 1.15(6) | |
| 141 | 1.34(7) | |
| 142 | 1.37(5) | |
| 143 | 1.28(9) | |
| 144 | 1.12(7) | |
| 145 | 1.02(4) | |
| 146 | 0.92(5) | |
| 147 | 0.77(4) | |
| 148 | 0.63(4) | |
| 149 | 0.56(2) | |
| 150 | 0.58(3) | |
| 151 | 0.48(3) | |
| 152 | 0.39(2) | |
| 153 | 0.22(3) | |
| 154 | 0.11(3) | |
| 155 | 0.023(6) | |
| 61 | 137 | 0.086(26) |
| 138 | 0.20(3) | |
| 139 | 0.32(6) | |
| 140 | 0.50(4) | |
| 141 | 0.73(7) | |
| 142 | 0.86(9) | |
| 143 | 1.01(12) | |
| 144 | 1.02(15) | |
| 145 | 0.88(5) | |
| 146 | 0.84(4) | |
| 147 | 0.75(5) | |
| 148 | 0.70(3) | |
| 149 | 0.58(8) | |
| 150 | 0.51(12) | |
| 151 | 0.45(7) | |
| 152 | 0.33(8) | |
| 153 | 0.26(3) | |
| 154 | 0.186(22) | |
| 155 | 0.117(12) | |
| 156 | 0.062(10) | |
| 62 | 142 | 0.33(6) |
| 143 | 0.47(8) | |
| 144 | 0.65(10) | |
| 145 | 0.70(7) | |
| 146 | 0.75(7) | |
| 147 | 0.700(28) | |
| 148 | 0.645(45) | |
| 149 | 0.572(40) | |
| 150 | 0.51(8) | |
| 151 | 0.436(22) | |
| 152 | 0.35(3) | |
| 153 | 0.267(11) | |
| 154 | 0.203(16) | |
| 155 | 0.15(2) | |
| 156 | 0.10(2) | |
| 157 | 0.054(15) | |
| 158 | 0.029(7) | |
| 63 | 144 | 0.26(4) |
| 145 | 0.40(5) | |
| 146 | 0.514(26) | |
| 147 | 0.535(21) | |
| 148 | 0.560(34) | |
| 149 | 0.567(34) | |
| 150 | 0.558(33) | |
| 151 | 0.527(42) | |
| 152 | 0.491(24) | |
| 153 | 0.387(23) | |
| 154 | 0.315(16) | |
| 155 | 0.221(15) | |
| 156 | 0.154(11) | |
| 157 | 0.108(11) | |
| 158 | 0.064(23) | |
| 159 | 0.044(15) | |
| 160 | 0.019(11) | |
| 64 | 147 | 0.26(4) |
| 148 | 0.34(4) | |
| 149 | 0.429(34) | |
| 150 | 0.454(45) | |
| 151 | 0.47(12) | |
| 152 | 0.476(24) | |
| 153 | 0.45(5) | |
| 154 | 0.34(5) | |
| 155 | 0.29(3) | |
| 156 | 0.24(3) | |
| 157 | 0.17(2) | |
| 158 | 0.12(2) | |
| 159 | 0.077(14) | |
| 160 | 0.052(7) | |
| 161 | 0.028(5) | |
| 162 | 0.012(7) |
References
- [1] G. Friedlander, L. Friedman, B. Gordon,and L. Yaffe, Phys. Rev. 129 (1963) 1809
-
[2]
R. Klapisch, Annual Review of Nuclear Sciences,
Vol 19 (1969) 33
and R. Klapisch, J. Chaumont, C. Philippe, I. Amarel, R. Fergeau, R. Salome and R. Bernas, Nucl. Inst. Methods 53 (1967) 216 - [3] B.N. Belyaev, V.D. Domkin, Yu.G. Korobulin, L. N. Androneko and G. E. Solyakin, Nucl. Phys. A348 (1980) 479
- [4] A. V. Prokovief, Nucl. Inst. Methods A 463 (2001) 557
- [5] M. Gloris, R. Michel, F. Sudbrock, U. Herpers, P. Malmborg, B. Holmqvist, Nucl. Instrum. and Methods A 463 (2001) 593
- [6] Yu. E. Titarenko, O. V. Shvedov, M. M. Igumnov, S. G. Mashnik, E. I. Karpikhin, V. D. Kazaritsky, V. F. Batyaev, A. B. Koldobsky, V. M. Zhivun, A. N. Sosnin, R. E. Prael, M. B. Chadwick, T. A. Gabriel and M. Blann. Nucl. Instrum. and Methods A 414 (1998) 73
- [7] M. Bernas, C. Engelmann, P. Armbruster, S. Czajkowski, F. Ameil, C. Böckstiegel, Ph. Dessagne, C. Donzaud, H. Geissel, A. Heinz, Z. Janas, C. Kozhuharov, C. Miehé, G. Münzenberg, M. Pfützner, W. Schwab, C. Stéphan, K. Sümmerer, L. Tassan-Got and B. Voss, Phys. Lett B 415 (1997) 111
- [8] Ch. Engelmann, F. Ameil, P. Armbruster, M. Bernas S. Czajkowski, Ph. Dessagne, C. Donzaud, H. Geissel, A. Heinz,Z. Janas, C. Kozhuharov, Ch. Miehé, G. Münzenberg, M. Pfützner, C. Röhl, W. Schwab, C. Stéphan, K. Sümmerer, L. Tassan-Got and B. Voss, Zeit. Phys. A352 (1995) 351
- [9] F. Carminati, R. Klapisch, J. P. Revol, Ch. Roche, J. A. Rubio, C. Rubbia. CERN Report CERN/AT/93-47(ET), 1993.
-
[10]
P. Armbruster, H. Geissel, G. Münzenberg, (GSI)
Darmstadt, M. Bernas, (IPN) Orsay
Patentschrift Deutsches Patentamt P 44 10 587.8.33, GSI Darmstadt 27.03.1994
Brevet de l’ Institut national de la propriété industrielle, Paris, France 95 03 499, GSI Darmstadt 24.03.1995 - [11] B. Mustapha, PhD Thesis Paris XI University (1999) IPNO-T-99-05
- [12] F. Rejmund, B. Mustapha, P. Armbruster, J. Benlliure, M. Bernas, A. Boudard, J. P. Dufour, T. Enqvist, R. Legrain, S. Leray, K.-H. Schmidt, C. Stéphan, J. Taieb, L. Tassan-Got and C. Volant, Nucl. Phys. A683 (2001) 481
- [13] J. Benlliure, P. Armbruster, M. Bernas, A. Boudard, J.-P. Dufour, T. Enqvist, R. Legrain, S. Leray, B. Mustapha, F. Rejmund, K.-H. Schmidt, C. Stéphan, L. Tassan-Got and C. Volant, Nucl. Phys. A683 (2001) 513
- [14] W. Wlazlo, T. Enqvist, P. Armbruster J. Benlliure, M. Bernas, A. Boudard, S. Czajkowski, R. Legrain, S. Leray, B. Mustapha, M. Pravikoff, F. Rejmund, K.-H. Schmidt, C. Stéphan, J. Taieb, L. Tassan-Got and C. Volant, Phys. Rev. Lett. 84 (25) (2000) 5736
- [15] T. Enqvist, W. Wlazlo, P. Armbruster, J. Benlliure, M. Bernas, A. Boudard, S. Czajkowski, R. Legrain, S. Leray, B. Mustapha, M. Pravikoff, F. Rejmund, K.-H. Schmidt, C. Stéphan, J. Taieb, L. Tassan-Got and C. Volant, Nucl. Phys. A686 (2001) 481
- [16] T. Enqvist, P. Armbruster, J. Benlliure, M. Bernas, A. Boudard, S. Czajkowski, R. Legrain, S. Leray, B. Mustapha, M. Pravikoff, F. Rejmund, K.-H. Schmidt, C. Stéphan, J. Taieb, L. Tassan-Got, F. Vivès, C. Volant and W. Wlazlo, Nucl. Phys. A 703 (2002) 435
-
[17]
J. Taieb, PhD Thesis Paris XI University (2000)
IPNO-T-00-10 and
J. Taieb, P. Armbruster, J. Benlliure, M. Bernas, A. Boudard, E. Casajeros, S. Czajkowski, T. Enqvist, R. Legrain, S. Leray, B. Mustapha, M. Pravikoff, F. Rejmund, K.-H. Schmidt, C. Stéphan, L. Tassan-Got, C. Volant and W. Wlazlo, submitted to Nucl. Phys. A - [18] E. Casarejos Ruiz, PhD Thesis, University de Santiago de Compostela (2001), GSI Rep. Diss.2002-04
- [19] P. Armbruster, M. Bernas, S. Czajkowski, H. Geissel, T. Aumann, Ph. Dessagne, C. Donzaud, E. Hanelt, A. Heinz, M. Hesse, C. Kozhuharov, Ch. Miehe, G. Münzenberg, M. Pfützner, K.-H. Schmidt, W. Schwab, C. Stéphan, K. Sümmerer, L. Tassan-Got and B. Voss, Z. Phys. A355 (1996) 191
- [20] C. Donzaud, S. Czajkowski, P. Armbruster, M. Bernas, C. Böckstiegel, Ph. Dessagne, H. Geissel, E. Hanelt, A. Heinz, C. Kozhuharov, Ch. Miehé, G. Münzenberg, M. Pfützner, W. Schwab, C. Stéphan, K. Sümmerer, L. Tassan-Got, B. Voss, Eur. Phys. J. A1, 407-426 (1998)
- [21] W. Schwab, M. Bernas, P. Armbruster, S. Czajkowski, Ph. Dessagne, C. Donzaud, H. Geissel, A. Heinz, C. Kozhuharov, C. Miehé, G. Münzenberg, M. Pfützner, C. Stéphan, K. Sümmerer , L. Tassan-Got and B. Voss, Eur. Phys. J. A2 (1998) 179
- [22] T. Enqvist, J. Benlliure, F. Farget, K.-H. Schmidt, P. Armbruster, M. Bernas, L. Tassan-Got, A. Boudard, R. Legrain, C. Volant, C. Böckstiegel, M. de Jong and J.-P. Dufour, Nucl. Phys. A 658 (1999) 47
- [23] Ch. Engelmann, Thesis Universität Tübingen (1998), GSI Rep. Diss. 1998-15
- [24] R. E. Prael, H. Liechtenstein, Los Alamos-UR-89-3014, 1989
- [25] J.-J. Gaimard and K.-H. Schmidt, Nucl. Phys. A 531 (1991) 709.
- [26] A. R: Junghans, M. de Jong, H.-G. Clerc, A. V. Ignatyuk, G.A. Kudyaev, K.-H. Schmidt, Nucl. Phys. A 629 (1998) 635
- [27] J. Benlliure, A. Grewe, M. de Jong, K.-H. Schmidt and S. Zhdanov, Nucl. Phys. A 628 (1998) 458
- [28] A. Boudard, J. Cugnon, S. Leray and C. Volant, Phys. Rev. C 66 (2002) 044615
- [29] B. Jurado, K.-H. Schmidt and K.-H. Behr, Nucl. Inst. Methods A483 (2002) 603
- [30] P. Chesny,A. Forges, J.M. Gheller, G. Guiller, P. Pariset, L. Tassan-Got, P. Armbruster, H.-H. Behr, J. Benlliure, K. Burkard, A. Brünle, T. Enqvist, F. Farget, K.-H. Schmidt, GSI Annual Report 1996, GSI 1997-1 p. 190.
- [31] C. Scheidenberger, Th. Stöhlker, W. E. Meyerhof, H. Geissel, P. H. Mokler and B. Blank, Nucl. Inst. and Methods 142 (1998) 441
- [32] H. Geissel, P. Armbruster, K.-H. Behr, A. Brünle, K. Burkard, M. Chen, H.Folger, B. Franczak, H. Keller, O. Klepper, B. Langenbeck, F. Nickel, E. Pfeng, M. Pfützner, E. Roeckl, K. Rykaczewski, I. Schall, D. Schart, C. Scheidenberger, K.-H. Schmidt, A. Schröter, T. Schwab, K. Sümmerer, M. Weber, G. Münzenberg, T. Brohm, H.-G. Clerc, M. Fauerbach, J.-J. Gaimard, A. Grewe, E. Hanelt, B. Knödler, M. Steiner, B. Voss, J. Weckenmann, C. Ziegler, A. Magel, H. Wollnik, J.-P. Dufour, Y. Fujita, D. J. Vieira, B. Sherill, Nucl. Inst. and Methods B 70 (1992) 286
- [33] M. Pfützner, H. Geissel, G. Münzenberg, F. Nickel, C. Scheidenberger, K.-H. Schmidt, K. Sümmerer, T. Brohm, B. Voss and H. Bichsel, Nucl. Inst. and Methods B86 (1994) 213
- [34] B. Voss, T. Brohm, H.-G. Clerc, A. Grewe, E. Hanelt, A. Heinz, M. de Jong, A. Junghans, W. Morawek, C. Röhl, S. Steinhäuser, C. Zeigler, K.-H. Schmidt, K.-H. Behr, H. Geissel, F. Nickel, C. Scheidenberger, K. Sümmerer and A. Magel, Nucl. Inst. and Methods A 364 (1995) 150
- [35] B.A. Bochagov, V.S. Bychenkov, V.D. Dmitriev, S.P. Mal’tsev, A.I. Obukhov, N.A. Perfilov and O. E. Shigaev, Sov. J. Nucl. Phys. 28 (2) (1978) 291
- [36] J. Benlliure, J. Pereira-Conca and K.-H. Schmidt, Nucl. Instrum. and Methods A478 (2002) 493
- [37] Th. Schwab, GSI report 91-10 (1991)
- [38] B.D. Wilkins, E.P. Steinberg, R.R. Chasman, Phys. Rev. C14 (1976) 1832
- [39] C. Böckstiegel, S. Steinhäuser, J. Benlliure, H.-G. Clerc, A. Grewe, A. Heinz, M. de Jong, A.R. Junghans, J. Müller, K.-H. Schmidt, Phys. Lett. B 398 (1997) 259
- [40] J. Pereira-Conca, PhD Thesis, in progress, Univ. Santiago de Compostela, private communication.
- [41] P. Napolitani, P. Armbruster, M. Bernas and L. Tassan-Got, to be submitted to Nucl. Phys. A
- [42] P.J. Karol, Phys. Rev. C 11 (1975) 1203
-
[43]
J. Chaumont, PhD Thesis Univ. of Paris XI (1970)
csnwww.in2p3.fr/AMDC/experimental/th-chaumont.pdf -
[44]
M. V. Ricciardi, K.-H. Schmidt, J. Benlliure, T. Enqvist,
F. Ameil, P. Armbruster, M. Bernas, A. Boudard, S. Czajkowski,
R. Legrain, S. Leray, B. Mustapha, M. Pravikoff, C. Stephan,
L. Tassan-Got, C. Volant, proceedings of the XXXIX Int. Winter Meeting on
Nucl. Phys., Bormio, Italy (2001).
M. V. Ricciardi, PhD Thesis in progress, GSI-Darmstadt. - [45] L.A. Vaishnene, L.N. Andronenko, G.G. Kovshevny, A.A. Kotov, G.E. Solyakin and W. Neubert, Z. Phys. A 302 (1981) 143
- [46] B. Jurado, PhD Thesis, Compostela (2002), Diss. GSI Rep. 2002-10
- [47] T. Brohm, PhD thesis, TU-Darmstadt, (1994)
- [48] P. Armbruster, Nucl. Phys. A140, (1970) 385
- [49] K. Sistemich, P. Armbruster, J. Eidens and E. Roeckl, Nucl. Phys. A139 (1969) 289
- [50] H. U. Wenger, F. Botta, R. Chawla, M. Daum, D. Gavillet, Z. Kopajtic, D. Ledergerber, H. P. Linder and S. Röllin, Annals of Nucl. Energy 26 (1999) 141
- [51] R. Silberberg, C. H. Tsao, A. F. Barghouty, Astrophys. J. 501 (1998) 911 and (Tsao@nrl.navy.mil) Phys. Report 191, 351 (1990)
- [52] L. Dresner, ORNL-TM-7882, Oak Ridge National Laboratory, 1981.
- [53] S.I. Mulgin, K.-H. Schmidt, A. Grewe, S. V. Zhdanov, Nucl. Phys. A 640 (1998) 375.
- [54] U. Brosa, S. Grossmann, A. Müller, Phys. Rep. 197 (1990) 167
- [55] A.V. Ignatyuk, G. N. Smirenkin and A. S. Tishin, Sov. J. Nucl. Phys. 21 (1975) 255.
- [56] D. Hilscher, U. Jahnke, F. Goldenbaum, L. Pienkowski, J. Galin and B. Lott, Nucl. Inst. and Methods A414 (1998) 100