Evidence of Critical Behavior in the Disassembly of Nuclei with A 36
Abstract
A wide variety of observables indicate that maximal fluctuations in the disassembly of hot nuclei with A36 occur at an excitation energy of 5.60.5 MeV/u and temperature of 8.30.5 MeV. Associated with this point of maximal fluctuations are a number of quantitative indicators of apparent critical behavior. The associated caloric curve does not appear to show a flattening such as that seen for heavier systems. This suggests that, in contrast to similar signals seen for liquid-gas transitions in heavier nuclei, the observed behavior in these very light nuclei is associated with a transition much closer to the critical point.
pacs:
25.70.Pq, 24.60.Ky, 05.70.JkMost efforts to determine the critical point for the expected liquid gas-phase transition in finite nucleonic matter have focused on examinations of the temperature and excitation energy region where maximal fluctuations in the disassembly of highly excited nuclei are observed Campi ; Richert ; Chomaz_1 ; Bonasera . A variety of signatures have been employed in the identification of this region Campi ; Richert ; Chomaz_1 ; Bonasera ; Pan ; Elliott_1 ; DAgostino_1 ; Moretto ; Elliott_2 ; Bauer ; Natowitz_1 and several publications Elliott_1 ; DAgostino_1 ; Moretto ; Elliott_2 ; Bauer ; Natowitz_1 have reported the observation of apparent critical behavior. Fisher Droplet Model analyses have been applied to extract critical parameters Elliott_1 ; DAgostino_1 ; Moretto ; Elliott_2 ; Bauer which are very close to those observed for liquid-gas phase transitions in macroscopic systems Fisher . Data from the EOS Hauger_PRC98 and ISiS Beaulieu collaborations have been employed to construct a co-existence curve for nucleonic matter Elliott_2 . Those analyses have proceeded under the assumption that the point of apparent critical behavior was the true critical point of the system Elliott_1 ; DAgostino_1 . However, some recent theoretical treatments suggest that apparent signals of critical behavior may be encountered well away from the actual critical point Gulminelli_1 ; Norenberg and applications of -scaling analyses have suggested that the observation of scaling and power-law mass distributions Botet_PRL01 ; Frankland are not sufficient to identify the true critical point. Recently, several of the present authors suggested that disassembly for heavier systems occurs within the co-existence region, at temperatures well below the critical temperatures Natowitz_2 . It was further suggested that the decreasing importance of Coulomb effects makes the lightest nuclei the most favorable venue for investigation of the critical point.
In this letter we report results of an extensive investigation of nuclear disassembly in nuclei of 36 excited to energies as high as 9 MeV/u. We find that the maximum fluctuations occur at an excitation energy of 5.60.5 MeV and a temperature of 8.30.5 MeV. At this same point, a number of indications of apparent critical behavior are seen. While this does not guarantee that the critical point has been reached, we also find that the caloric curve does not exhibit a plateauing at the point of maximum fluctuations, in contrast to experimental results for heavier systems Natowitz_1 . These observations suggest that the critical point for these very light nuclei may have been reached.
Using the TAMU NIMROD detector NIMROD and beams from the TAMU K500 Super-conducting Cyclotron, we have probed the properties of excited quasi projectile-like fragments (QP) produced in the reactions of 47 MeV/u 40Ar + 58Ni. Earlier work on systems at energies near the Fermi energy have demonstrated the essential binary nature of such collisions, even at relatively small impact parameters Peter . As a result, these collisions prove to be very useful in preparing highly excited light nuclei Steckmeyer .
The charged particle detector array of NIMROD includes 166 individual CsI detectors arranged in 12 rings in polar angles from to . In these experiments each forward ring included two Si-Si-CsI telescopes and three Si-CsI telescopes to identify intermediate mass fragments (IMF). The NIMROD neutron ball, which surrounds the charged particle array, was used to determine the neutron multiplicities for selected events. The correlation of the charged particle multiplicity and the neutron multiplicity was used to select violent collisions. In this work, we developed a new method to reconstruct the QP source. We first carry out three source (QP, Quasi-Target and a mid-rapidity sources) fits to the observed energy spectra and angular distributions of the light charged particles (LCP). We then employ the parameters of these fits to control the assignment of individual LCP to one of the sources using Monte Carlo sampling techniques. We associate IMFs with Z4 with the QP source if they have rapidity , where is the beam rapidity. For the present analysis we have selected reconstructed QP events with total charge number 12 from violent collisions. The 28000 reconstructed QP events comprise of violent collisions.
The excitation energy distribution was deduced using the energy balance equation Cussol where the kinetic energies of charged particles, mass excesses and average neutron contributions were considered. Using results of the source fits we have also evaluated (on the average) small corrections for undetected mass and energy (mostly as protons), in the sampled events. The QP source velocity was determined from momentum conservation of all QP detected particles.
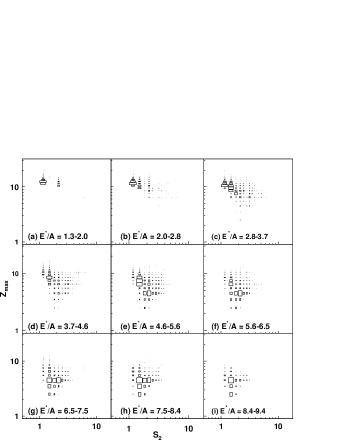
Campi plots of the natural log of the largest cluster charge, ln, versus the natural log of the normalized second moment, ln, (, where is the multiplicity of QP clusters with atomic number ), are very instructive in searches for critical behavior Campi ; DAgostino_1 . In Figure 1 we present such plots for nine selected excitation energy bins. In the low excitation energy region only the upper (liquid phase) branch exists. In the range of near 5.6 MeV/u, the liquid branch and the lower (gas phase) branch are populated essentially equally. At the higher the gas phase branch is strongly dominant. These results indicate that the region of maximal fluctuations signaling a transition between the two phases is to be found near 5.6 MeV/u.
To further explore this region we have investigated other proposed observables commonly related to fluctuations and critical behavior. Since we wish to compare our results with several model calculations which are based upon specification of the initial temperature of the excited system, we first turn to a determination of the caloric curve for these A=36 nuclei. We have used two different techniques to derive ”initial temperatures” from the observed apparent temperatures. The first consisted of fitting the kinetic energy spectra for different LCPs in 9 different bins in with Maxwellian distributions to obtain the slope temperatures. To derive the initial temperatures it is necessary that the experimentally observed slope temperatures be corrected for effects due to secondary decay. We therefore employed the measured excitation energy dependence of the multiplicity for the ejectile under consideration to determine initial temperatures Hagel ; Wada . The second technique employed results of a Quantum Statistical Model (QSM) calculation to correct the observed double isotope, H-He, ratio temperatures for secondary decay effects Gulminelli_2 ; Majka . For this work we employed the QSM model described in reference Majka . The first technique employing observed spectral slopes assumes sequential evaporation of the ejectiles from a cooling compound nucleus source Hagel ; Wada while the second assumes simultaneous fragmentation of a reduced density equilibrated nucleus and subsequent secondary evaporation from the primary fragments Gulminelli_2 ; Majka . Given that the discussion above suggests an important transition from liquid to gas dominance at 5.6 MeV/u excitation energy, the first method should not be appropriate above that energy and the second method is not appropriate below that energy. The data points in Figure 2 represent the initial temperature values determined from cascade corrected slopes (solid squares) and H-He isotope ratios (solid circles), each determined in its appropriate region of applicability. The two techniques lead to reasonable agreement in the transition region. We note that the caloric curve, defined in this manner, exhibits no obvious plateau. The temperature at 5.6 MeV excitation is 8.3 0.5 MeV.
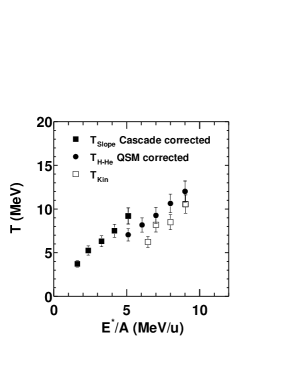
If the vapor phase may be characterized as an ideal gas of clusters Fisher , then, at and above = 8.3 MeV, this should be signaled by a kinetic temperature, T, where E is the Coulomb corrected average kinetic energy of primary fragments. Secondary decay effects make it difficult to test this expectation. However, in an inspection of the average kinetic energies for the different species observed, we find that, for each window, the average kinetic energy of 3He isotropically emitted in the projectile like frame, is higher than those of other species. This together with simple model estimates indicates that the 3He spectra are the least affected by secondary decay. Kinetic temperatures for 3He, defined as where is the average kinetic energy and is the Coulomb energy, are plotted as open squares in Figure 2. Above = 8.3 MeV the kinetic temperatures show a similar trend to the chemical temperatures but are approximately 1.5 MeV lower. While not perfect this approximate agreement provides additional evidence for disassembly of an equilibrated system.
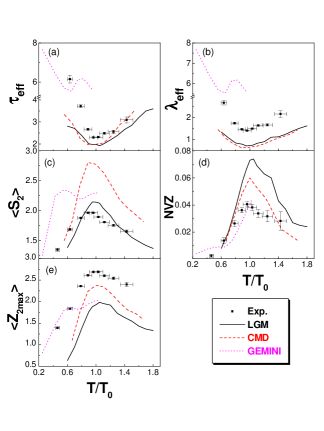
Returning to the characterization of the apparent transition at = 5.6 MeV, we plot in Figure 3(a) the effective Fisher-law parameter extracteded from power law fits for = 2 - 7 of the QP charge distributions in the different windows. The results are plotted as a function of , where is MeV temperature derived for = 5.6 MeV. As seen in Figure 1, at low a large residue always remains, i.e. the nucleus is basically in the liquid phase accompanied by some light particles. When , the charge distribution shows a near power-law distribution with 2.3. This value is close to the critical exponent of the liquid gas phase transition Fisher . As continues to increase, the charge distribution becomes steeper which indicates that the system tends to vaporize. The observed minimum in is rather broad. For comparison to the experimental data we also display, in Figure 3(a), the variation of effective predicted by three different models: standard statistical sequential decay as modeled by the code GEMINI Charity , the isospin dependent Lattice Gas Model (LGM) of Das Gupta et al. (using A = 36 and Z = 16 particles in a cubic lattice with 64 sites ) Pan ; DasGupta and Classical Molecular Dynamics (CMD) with Coulomb forces DasGupta . The last, without Coulomb, has been shown to give results essentially the same as the LGM which is known to have a liquid gas phase transition. Thus the addition of Coulomb interactions to that model is argued to be equivalent to the more difficult task of inclusion of Coulomb interactions in the LGM. In order to compare all parameters on a scale, for the GEMINI calculation is taken as 8.3 MeV. For the LGM and CMD calculations is taken as the associated phase transition temperature for A = 36 and Z = 16. For the potential employed Ref.DasGupta these are, respectively, = 5.0 MeV and = 4.5 MeV. Scaled in this way, the LGM and CMD results exhibit a variation of vs that is very similar to that seen in the experiment while the GEMINI calculation shows dramatically different behavior.
In a LGM investigation of scaling and apparent critical behavior, Gulminelli et al. have pointed out that, in finite systems, the size distribution of the maximum cluster, i.e. the liquid, might overlap with the gas cluster distribution in such a manner as to mimic the critical power law behavior with 2.2 Gulminelli_1 . They further note, however, that at that point the scaling laws are satisfied Gulminelli_1 . We find that removal of the heaviest cluster from the distribution leads to distributions which are exponential in nature over the entire energy range sampled. In Figure 3(b) the resultant exponential slope parameters, , are also plotted against excitation energy. A minimum is seen in the same region where exhibts a minimum. Once again the LGM and CMD models show similar behavior while the GEMINI calculation leads to very different predictions.
For a further comparison we present in Figure 3(c) - 3(e) experimental and calculated results for (c) the mean normalized second moment, , from Figure 1, (d) the normalized variance in distribution, NVZ = Dorso , (e) - the average atomic number of the second largest fragment Sugawa . For these additional parameters, which are often used to characterize a region of maximum fluctuations, the data show maxima at = 1. The LGM and CMD calculations show very similar behavior with some difference in absolute value. (Note suppressed zero points on y-axes of the plots in Figure 3.) The GEMINI results are very different in each case.
To recap, in our measurements for the disassembly of a small nucleus with A maximal fluctuations are observed at MeV/u excitation energy and = MeV. The fragment topological structures suggest the onset of a phase change. Comparisons with results of LGM and CMD (with Coulomb) calculations suggest that the critical point may have been reached. As pointed out in the introduction, recent theoretical treatments suggest that apparent signals of critical behavior may be encountered well away from the actual critical point Gulminelli_1 ; Norenberg ; Botet_PRL01 ; Frankland , and therefore most of the parameters investigated, in Figures 1 and 3 may not be sufficient by themselves to identify the true critical point of the system. What differentiates the present work from previous identifications of points of critical behavior in nuclei, in addition to the fact that these are the lightest nuclei for which a detailed experimental analysis has been made, is the comportment of the caloric curve. For heavier systems the points identified as the critical points appear to occur at excitation energies very close to those at which the onset of significant flattening in the caloric curves are observed Natowitz_1 . The reason for this flattening is still under discussion. It may reflect expansion and/or spinodal decomposition inside the coexistence region Dorso_2 ; Ono ; Norenberg . In contrast no quasi plateau region in the caloric curve is apparent in the present study. Further, above the point of maximal fluctuations, the kinetic temperatures of ejectiles, thought to represent early emission with little contamination from secondary decay, show a similar trend to that of the chemical temperatures. Also, we believe it is worth noting that the significance of the event topology in the = 8.3 MeV region is also indicated in a Zipf’s law test (not shown) as proposed in Ma_1 . Moreover, the analysis of -scaling of distribution, the fluctuation of total kinetic energy of QP and critical exponents also support the phase change around MeV Ma_2 . Taken together, this body of evidence suggests a phase change in an equilibrated system at, or extremely close to, the critical point of this mesoscopic system.
This work was supported by the the U.S. Department of Energy and the Robert A. Welch Foundation. The work of YGM is also supported by the NSFC under Grant No. 19725521 and the Major State Basic Research Development Program in China under Contract No. G2000077404. R.A, A.M-D and A.M-R wish to thank the partial support of DGAPA and CONACYT-Mexico.
References
- (1) X. Campi, J. Phys. A 19, L917 (1986); Phys. Lett. B208, 351 (1988).
- (2) J. Richert and P.Wagner, Phys. Rep. 350, 1 (2001).
- (3) P. Chomaz, in Proceedings of the INPC 2001 Conference, Berkeley, Ca., July 2001.
- (4) A. Bonasera et al. Riv. Del Nuov. Cim. 23, 1 (2000).
- (5) J. C. Pan et al., Phys. Rev. Lett. 80, 1182 (1998).
- (6) J. B. Elliott et al., Phys. Rev. C 62, 064603 (2000).
- (7) M. D’Agostino et al., Nucl. Phys. A650, 329 (1999).
- (8) L. G. Moretto et al., in Proceedings of the INPC 2001 Conference, Berkeley, Ca., July 2001.
- (9) J. B. Elliott et al., Phys. Rev. Lett. 88, 042701 (2002); J. B. Elliott et al., Phys. Rev. C 67, 024609 (2003).
- (10) M. Kleine Berkenbusch et al., Phys. Rev. Lett. 88, 022701 (2002).
- (11) J. B. Natowitz et al., Phys. Rev. C 65, 034618 (2002).
- (12) M. E. Fisher, Rep. Prog. Phys. 30, 615 (1969); Physics 3, 255 (1967).
- (13) J. A. Hauger et al., Phys. Rev. C 57, 764 (1998); ibid 62, 024626(2000).
- (14) L. Beaulieu et al., Phys. Rev. Lett. 84, 5971 (2000).
- (15) F. Gulminelli et al., Phys. Rev. C 65, 051601 (2002); F. Gulminelli and P. Chomaz, Phys. Rev. Lett. 82, 1402 (1999).
- (16) W. Norenberg et al., GSI Preprint 2002-3, January, 2002.
- (17) R. Botet et al., Phys. Rev. Lett. 86, 3514 (2001).
- (18) J.D. Frankland et al., ArXiv nucl-ex/0201020.
- (19) J.B. Natowitz et al., ArXiv nucl-ex/0206010.
- (20) http://Cyclotron.tamu.edu/nimrod/
- (21) J. Péter et al., Nucl. Phys. A593, 95 (1995).
- (22) J. C. Steckmeyer et al., Phys. Rev. Lett. 76, 4895 (1996).
- (23) D. Cussol et al., Nucl. Phys. A561, 298 (1993).
- (24) K. Hagel et al., Nucl. Phys. A486, 429 (1988).
- (25) R. Wada et al., Phys. Rev. C 39, 497 (1989).
- (26) F. Gulminelli and D. Durand, Nucl. Phys. A615, 117 (1997).
- (27) Z. Majka et al., Phys. Rev. C 55, 2991 (1997).
- (28) R. J. Charity et al., Nucl. Phys. A483, 371 (1988).
- (29) J. Pan and S. Das Gupta, Phys. Rev. C 57, 1839 (1998).
- (30) C. O. Dorso et al., Phys. Rev. C 60, 034606 (1999).
- (31) Y. Sugawa and H. Horiuchi, Prog. Theo. Phys. 105, 131 (2001).
- (32) A. Strachan and C. O. Dorso, Phys. Rev. C 58, R632 (1998).
- (33) T. Furuta and A. Ono, ArXiv:nucl-th/0305050.
- (34) Y. G. Ma, Phys. Rev. Lett. 83, 3617 (1999).
- (35) Y. G. Ma (NIMROD Collaboration), talk presentation in HIC03, Montreal, Canada, June 25-28, 2003. http://www.physics.mcgill.ca/HIC03/talks.html