The astrophysical rate of 15O(Ne via the () reaction in inverse kinematics
Abstract
A recoil coincidence technique has been applied to measure the -decay branching ratios of near-threshold states in 19Ne. Populating these states using the () reaction in inverse kinematics, we detected the recoils and their decay products with 100% geometric efficiency using a magnetic spectrometer. Combining our branching ratio measurements with independent determinations of the radiative widths of these states, we calculate the astrophysical rate of 15O(Ne. Using this reaction rate, we perform hydrodynamic calculations of nova outbursts and conclude that no significant breakout from the hot CNO cycles into the process occurs in novae via 15O(Ne.
pacs:
26.30.+k, 25.60.Je, 26.50.+x, 27.20.+nI Introduction
Explosive thermonuclear fusion reactions on the surfaces of accreting compact objects in binary star systems cause the astronomical phenomena of novae and x-ray bursts. In novae, which take place on white dwarfs, hydrogen is burned at different stages of the outburst by combinations of the chains, the hot and cold CNO cycles, and the NeNa and MgAl cycles José and Hernanz (1998); Starrfield et al. (2000). The main nuclear activity involves () and () reactions interspersed with decays. In the case of massive ONe novae, marginal activity is also seen in nuclei beyond Si, with a likely nucleosynthetic endpoint around Ca José et al. (2001). X-ray bursts occur on the surfaces of neutron stars, where high peak temperatures allow significant nucleosynthesis beyond Ca. During these violent thermonuclear runaways, helium is burned via the 3 reaction, and intermediate mass nuclei (F through Sc) are produced through the process, a succession of () and () reactions Wallace and Woosley (1981). Heavier nuclei are synthesized via the process Wallace and Woosley (1981); Schatz et al. (1998), a sequence of rapid proton captures and decays which further processes seed nuclei left by the process. Nucleosynthesis in x-ray bursts is limited by a closed SnSbTe cycle Schatz et al. (2001). Three reactions potentially important for breakout from the hot CNO cycles have been identified, 15O(Ne, 18F(Ne, and 18Ne(Na Wiescher et al. (1999). This paper is concerned with the first of these. Direct measurements of the 15O(,)19Ne reaction at astrophysically relevant energies have not yet been performed, as the small cross sections would require very high intensity radioactive 15O beams. Currently, the best information about the astrophysical reaction rate comes from studies of the decay properties of resonances in 19Ne that contribute to the reaction at the relevant temperatures of 0.1 - 2 GK.
Calculation of the reaction rate requires the widths and radiative widths of states in 19Ne lying just above the -emission threshold at 3.529 MeV. Since these states lie below the proton and neutron separation energies of 6.4 and 11.6 MeV respectively Audi and Wapstra (1995), they can only decay by the emission of particles or rays. Hence knowledge of either the radiative width or the total width of a state plus its -decay branching ratio Bα is sufficient to determine its contribution to the astrophysical reaction rate. In the past, -decay branching ratios for these states have been measured by populating the states in transfer reactions and using solid-state detectors to count either particles Magnus et al. (1990); Kubono et al. (2002), or both particles and 15O nuclei Laird et al. (2002) from the subsequent decays. While these studies provided valuable data on higher-lying states, none yielded useful information on the 3/2+ level at 4.033 MeV which dominates the 15O(Ne reaction rate at the temperatures found e.g. in novae. Previously, the only experimental information on the contribution made by this state came from measurements of transfer reactions populating the analog state in the mirror nucleus 19F Mao et al. (1995, 1996).
II Experimental Method
We have measured the -decay branching ratios of all the states in 19Ne relevant to the astrophysical rate of the 15O(Ne reaction Davids et al. (2003). This measurement was carried out at the Kernfysisch Versneller Instituut (KVI) using a recoil coincidence technique Rehm et al. (2000), through which we have detected both - and -decaying recoils with 100% geometric efficiency and unambiguous discrimination in a magnetic spectrometer. We populated states in 19Ne via the Ne,Ne reaction at an incident beam energy of 43 MeV/u. A 910 MeV 21Ne beam provided by the variable energy, superconducting cyclotron AGOR bombarded a 1 mg cm-2 (CH target. Both triton ejectiles and 19Ne recoils entered the Big-Bite Spectrometer (BBS) van den Berg (1995), which was positioned at 0∘. The 19Ne recoils subsequently deexcited by the emission of rays, retaining their identities as 19Ne, or by the emission of particles, resulting in the formation of 15O decay products. Fig. 1 schematically illustrates the experimental arrangement.
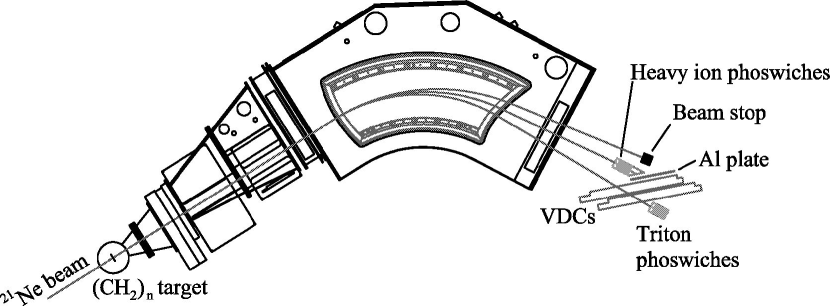
The high geometric efficiency of the experimental setup is a consequence of kinematic forward focusing in this reaction of an energetic, heavy projectile on a light target nucleus. There are two solutions to the kinematics of the reaction at laboratory angles around 0∘, one in which the tritons are emitted forward in the center-of-mass system, and one in which they are emitted backward. We have detected those emitted backward in the center-of-mass system, which have laboratory energies around 14 MeV/u. Tritons emitted at center-of-mass angles around 180∘ in inverse kinematics correspond to forward-going tritons emitted near 0∘ in the () reaction in normal kinematics. For triton ejectiles emitted at laboratory scattering angles of 4∘ or less in this measurement, the 19Ne recoils emerge at scattering angles of less than 0.4∘. The impulse delivered to the 15O decay product in an decay results in an angular spread about the original 19Ne trajectory. However, the high incident beam energy and low decay energies of the states studied limit the laboratory scattering angles of the 15O decay products to 1.5∘, well within the angular acceptance of the spectrometer. Simultaneous detection of both ejectile and recoil is possible in this configuration because the BBS has a momentum acceptance of 9.5% and a solid angle of 9.2 msr ( in the dispersive direction and in the non-dispersive direction).
The 19Ne recoils and 15O decay products were identified and stopped in two phoswich detectors Leegte et al. (1992) placed in a vacuum chamber. These phoswiches provided energy loss, total energy, and timing information. Each detector is made up of a 1 mm layer of fast plastic scintillator (NE102A) coupled to a 5 cm layer of slow plastic scintillator (NE115). Both layers are viewed by a single photomultiplier tube, whose signals are integrated for 40 ns and 400 ns in a charge-to-digital converter. The short integration window yields energy-loss signals from the thin, fast plastic layer while the long window is used to obtain the total energy signals from the thick, stopping, slow plastic layer. The spatial extent of these two detectors (6.5 cm 6.5 cm each) was sufficient to provide 100% acceptance for 19Ne recoils and 15O decay products from the excitation of 19Ne states lying at energies up to 5.5 MeV. This fact was confirmed by direct measurements in the non-dispersive direction of the spectrometer, and by raytracing calculations in the dispersive direction.
Triton ejectiles were identified and stopped in a similar array of six phoswich detectors after passing through two position-sensitive vertical drift chambers (VDCs) Wörtche (2001), all of which were placed in air. Using the position information from the VDCs, we reconstructed the trajectories of the tritons, allowing determination of their kinetic energies and laboratory scattering angles. Excitation energy resolution of 90 keV full-width-at-half-maximum was obtained via raytracing techniques.
The cross section for fragmentation of the 43 MeV/u 21Ne beam on the C component of the (CH target is far larger than that for the reaction, so the experiment required distinguishing a small signal from a large background of fragmentation products. An Al plate positioned just behind the heavy-ion phoswich detectors obscured the high-magnetic-rigidity half of the focal plane and stopped many of the heavy fragmentation products. The beam was stopped in a Faraday cup located just in front of this plate and next to the heavy-ion phoswich array.
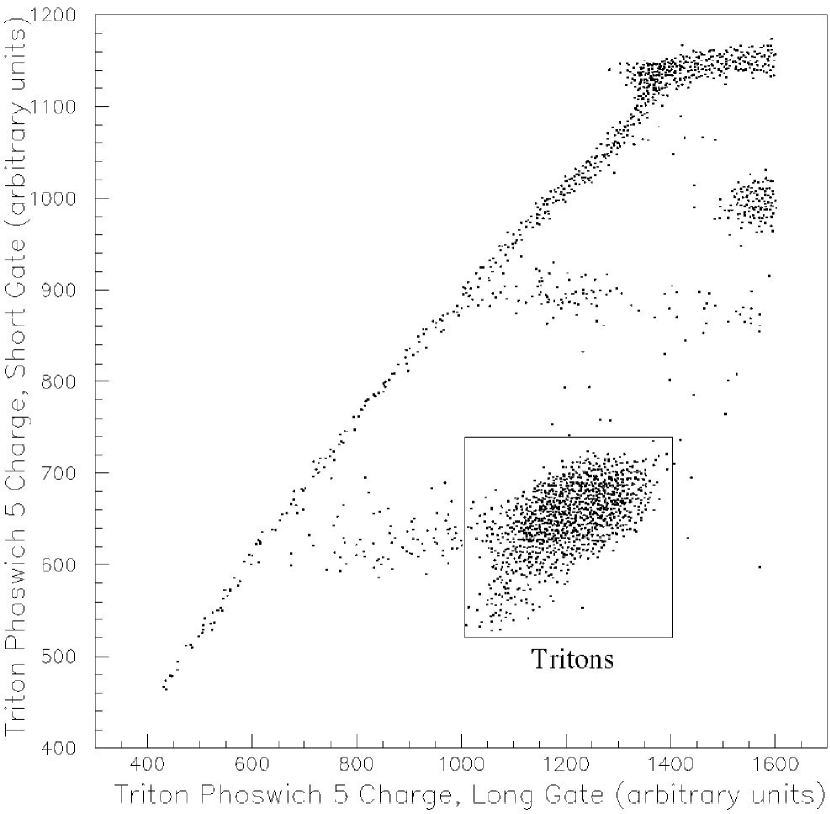
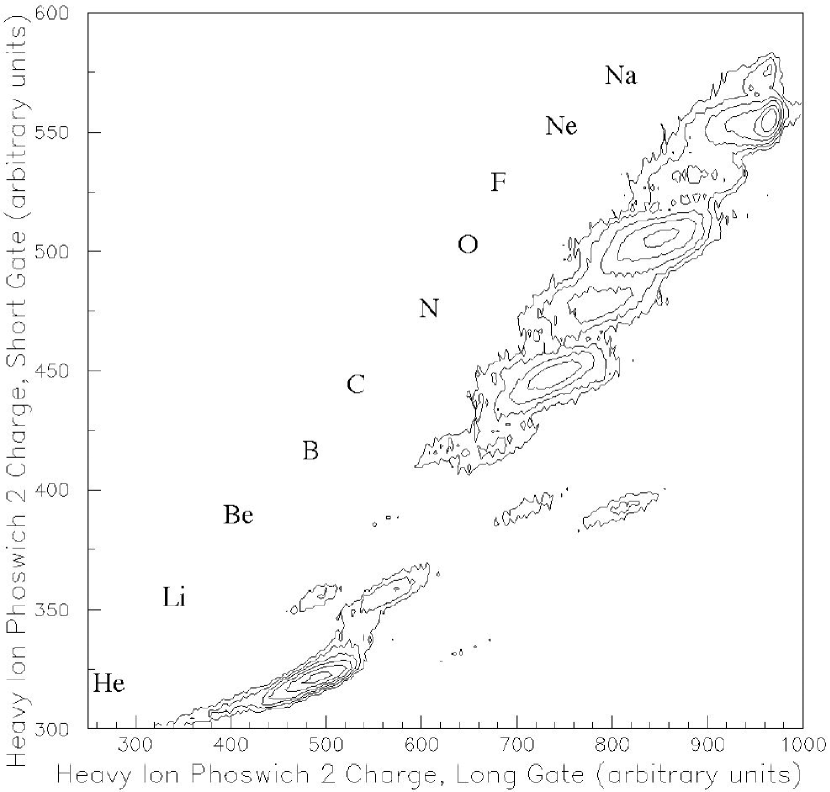
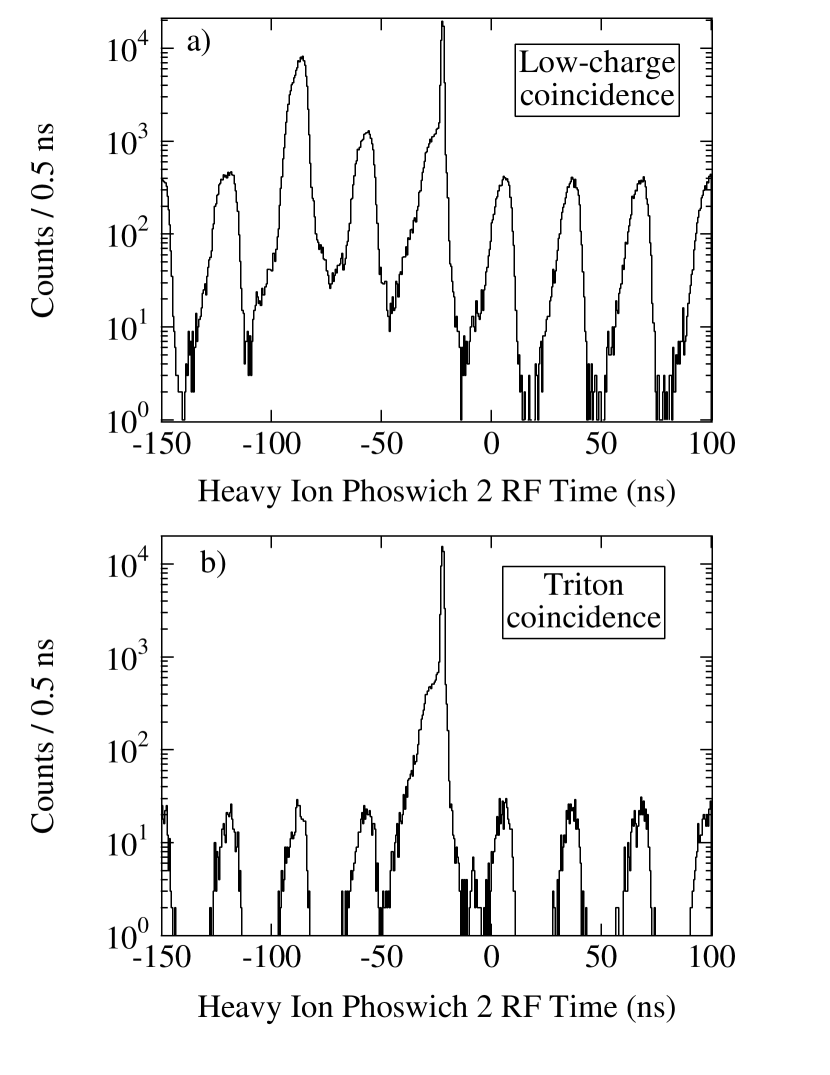
Accurate particle identification was essential to this measurement. Fig. 2 shows the energy loss versus total energy spectrum obtained from one of the triton phoswich detectors. Only the region directly surrounding the triton group is shown. It is clearly separated from the other particle groups. Fig. 3 shows a similar spectrum obtained from the second of two heavy-ion phoswiches, which was used for detecting both 19Ne and 15O nuclei. The separation of the different elements is good throughout, but the isotopic separation decreases with increasing mass and charge. Additional separation is obtained through the use of timing. Fig. 4 shows the time-of-flight (TOF) spectrum of the second heavy-ion phoswich with respect to the cyclotron radio frequency (RF) signal. Panel (a) shows the TOF of ions arriving in coincidence with low-integrated-charge hits in the triton phoswiches, while panel (b) shows the TOF of ions arriving in coincidence with tritons in the triton phoswiches. The narrow peak evident there is due to triton-19Ne coincidences, while the broad peak underlying it is due to triton-15O coincidences. Combining such TOF, energy loss, and total energy information we have unambiguously identified coincidences of tritons with both 19Ne and 15O nuclei.


III Results
Measurements of the scattering angle and kinetic energy of the triton ejectile are sufficient to determine the excitation energy of the 19Ne recoil in this two-body reaction. Fig. 5 shows a scatter plot of these quantities from 19Ne-triton coincidence events, while Fig. 6 shows the same observables from 15O-triton coincidences. The curved loci in these figures represent states in 19Ne, the excitation energies of which increase with increasing triton kinetic energy. This energy dependence and the fact that for a given state the observed triton kinetic energy increases with increasing scattering angle are opposite to the trends usually observed simply because the tritons were emitted backward in the center-of-mass system.
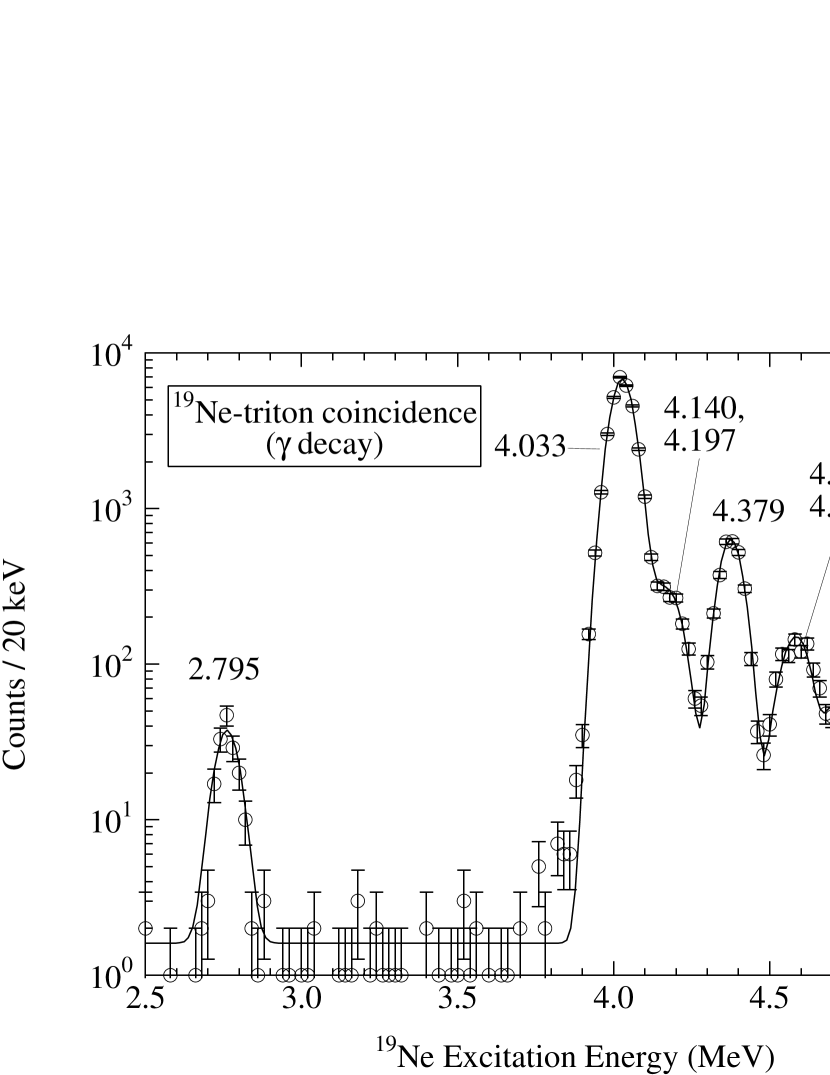
Fig. 7 shows the 19Ne excitation energy spectrum obtained from 19Ne-triton coincidences, while Fig. 8 and Fig. 9 show that obtained from 15O-triton coincidences. The solid curves are the sums of constant backgrounds and Gaussians centered at the energies of known states in 19Ne Tilley et al. (1995). The widths of the Gaussians are fixed by the experimental resolution, which is insufficient to completely resolve some pairs of closely-spaced states from one another. In these cases, the yield to each state can be determined from the fit. Both the 4.033 MeV and 4.379 MeV states, which are potentially the most important for the astrophysical reaction rate in novae, are well resolved. The 3/2+, 4.033 MeV state, whose dominant shell-model configuration is (sd)5 (1p)-2 Fortune et al. (1978), was copiously populated via an s-wave transfer of two neutrons from the 3/2+ ground state of the 21Ne beam to the proton target, as is evident from Fig. 7. The background represents a larger fraction of the total events in the 15O-triton coincidence spectrum than in the 19Ne-triton coincidence spectrum, though it is still quite small. A single fragmentation reaction of 21Ne on a C nucleus in the target can produce 15O and a triton, whereas it can not produce 19Ne and a triton. This accounts for the larger background in the -decay spectrum compared with the -decay spectrum, where the background comes from random coincidences between different fragmentation events. The fact that the BBS was set to detect MeV/u tritons meant that only tritons from the extreme low-energy tail of the triton fragmentation distribution were present in the background.
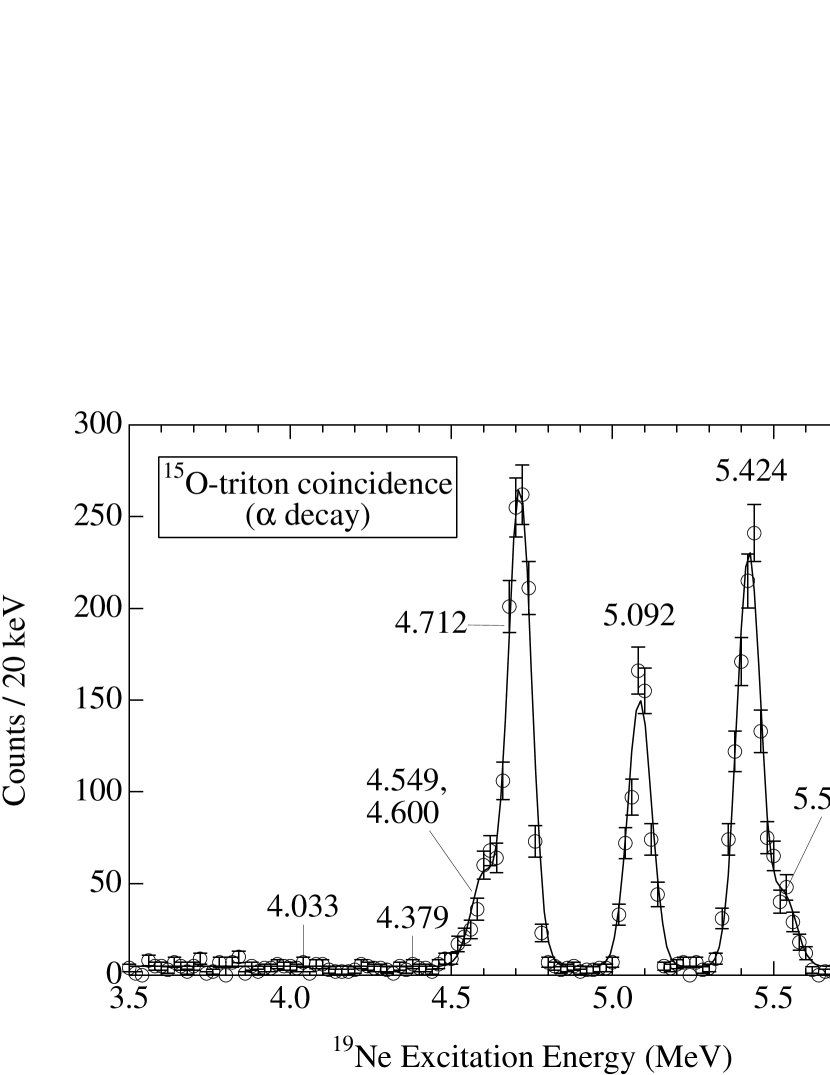
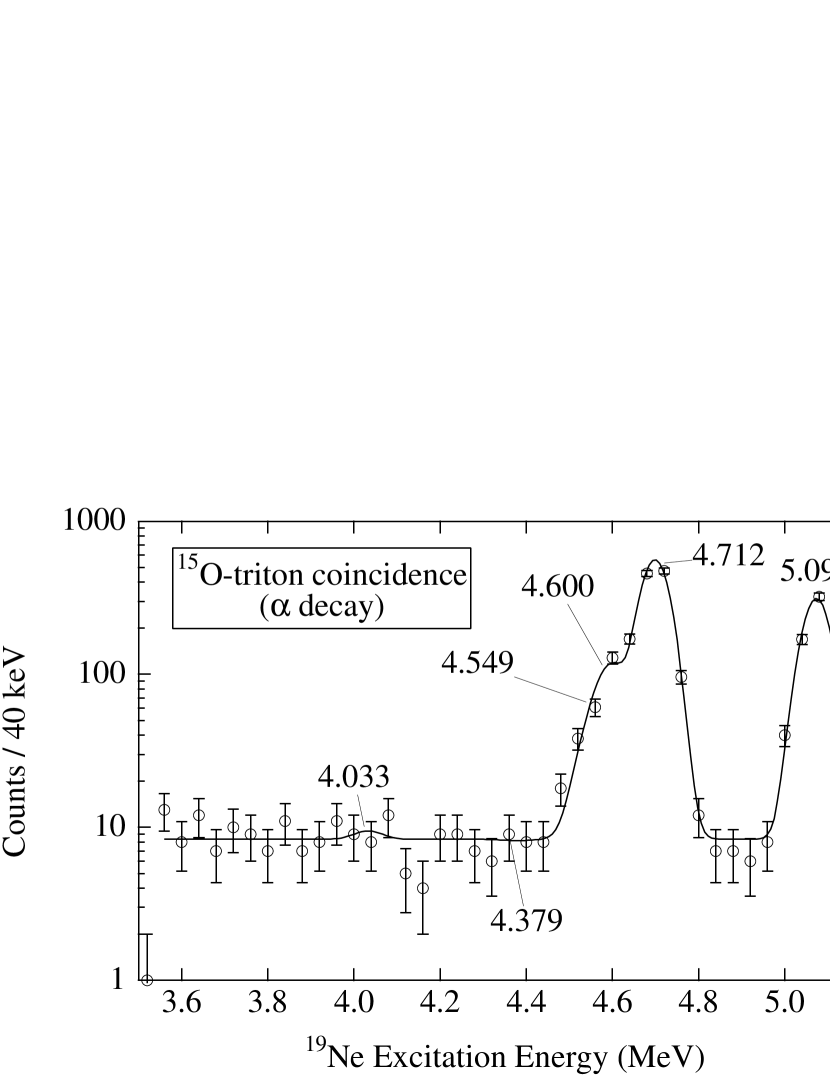
Of the nine -decaying states indicated in Fig. 7, only the four highest-lying levels can also be seen in the -decay spectrum, Fig. 9. The reason for this is that the decay energy of the lower-lying states is insufficient to permit appreciable transmission of particles through the Coulomb and centrifugal barriers. No decay from the 4.140 MeV and 4.197 MeV states was anticipated, as these decays are hindered by centrifugal barriers and low decay energies. As a result, no information on their -decay branching ratios is given here. For the four highest-lying states, at excitation energies of 4.549-, 4.600-, 4.712-, and 5.092 MeV, Bα was determined from the fits.
A different procedure was required for the two astrophysically important states lying at 4.033- and 4.379 MeV, from which no evidence of decay was immediately apparent. The - and -decay spectra and their associated backgrounds were integrated in 100 keV bins centered at the known energies of the states. A Bayesian statistical analysis Hagiwara et al. (2002) was applied to these data to obtain upper limits on Bα at both the 90% and the 99.73% confidence levels.
Table 1 contains our measured branching ratios, along with the results of Refs. Magnus et al. (1990); Laird et al. (2002). Central values and 1 uncertainties are given where they could be obtained; upper limits are specified at the 90% confidence level. Uncertainties in the present branching ratio determinations are purely statistical. Where more than one measurement is available, a weighted average of Bα is also shown. An exception is made for the 4.379 MeV state because the Bα determination of Ref. Magnus et al. (1990) was based on low statistics, and would more appropriately have been given as an upper limit. Since the present upper limit is more restrictive, it is adopted here. As no evidence for decay of states lying above 5.092 MeV was observed, the observation of decay from states at 5.424-, 5.539-, and 5.832 MeV is consistent with 100% -decay branching ratios for these states.
| Ex (MeV) | Jπ | Bα (present work) | Bα (Ref. Magnus et al. (1990)) | Bα (Ref. Laird et al. (2002)) | Bα (adopted) | (meV) | Ref. | (meV) |
|---|---|---|---|---|---|---|---|---|
| 4.033 | 45 | Hackman et al. (2000) | ||||||
| 4.379 | 0.044 0.032 | 458 92 | Brown (2002) | |||||
| 4.549 | ( | 0.16 0.04 | 0.07 0.03 | 0.10 0.02 | 39 | Tilley et al. (1995) | 4.4 | |
| 4.600 | () | 0.32 0.04 | 0.25 0.04 | 0.30 0.02 | 101 55 | Kiss et al. (1982) | 43 24 | |
| 4.712 | () | 0.85 0.04 | 0.82 0.15 | 0.85 0.04 | 43 8 | Tilley et al. (1995) | 230 80 | |
| 5.092 | 0.90 0.06 | 0.90 0.09 | 0.90 0.05 | 107 17 | Wilmes et al. (2002); Pringle and Vermeer (1989) | 960 530 |
IV Decay Widths
Very few experimental data on the lifetimes or radiative widths of states in 19Ne have been reported. The 4.033 MeV state is the only one of the six states considered here for which direct experimental measurements are available. The radiative width reported for this state Hackman et al. (2000) results from a combined analysis of Coulomb excitation and Doppler shift attenuation data Davidson and Roush (1973). In Ref. Hackman et al. (2000), these experimental data are combined with shell-model calculations of the mixing ratio in order to reduce the uncertainties on the best-fit value. Since it is difficult to evaluate the theoretical uncertainties associated with this procedure, we adopt here the result of the analysis that assumes to be completely unknown and is therefore based entirely on experimental data, meV Hackman et al. (2000). Note that this choice differs from that made in Ref. Davids et al. (2003). We wish to be as conservative as possible here, so we opt for the value of based purely on experimental measurements, without theoretical input and its corresponding uncertainty.
Measurements of for analog states in the mirror nucleus 19F can be found for four of the states Tilley et al. (1995); Kiss et al. (1982); Wilmes et al. (2002); Pringle and Vermeer (1989), and these have been adopted under the assumption that Ne) = F). In the case of the 5.092 MeV state, F) has been derived from the measured resonance strength Wilmes et al. (2002) and the measured -decay branching ratio Pringle and Vermeer (1989). For the 4.379 MeV state, no measurements are available in either nucleus, and we adopt the results of shell-model calculations Brown (2002), assigning a 1 uncertainty of 20% to the calculated electromagnetic transition rate. Table 1 shows the adopted values of and , which has been calculated as . The table contains central values and 1 uncertainties where they can be calculated, and upper limits where this is not possible. These 90% confidence level upper limits on are based on 1.28 upper limits on . For comparison, Refs. Wilmes et al. (1995); de Oliveira et al. (1997) contain earlier compilations of decay widths.
V Isospin Symmetry
It is of interest to compare the decay widths of states in 19Ne with the corresponding widths in the mirror nucleus 19F. This issue has been addressed in the past de Oliveira et al. (1997), but the availability of new data on 19F Wilmes et al. (2002) makes it opportune to reexamine this question. As no experimental electromagnetic transition strengths for both a 19Ne state and its analog in 19F are available, we instead use all available information to compare their reduced alpha widths . We compute these reduced widths via
| (1) |
where (E) is the energy- and angular momentum-dependent partial width, Rn the nuclear radius, Pℓ(E, Rn) the Coulomb penetrability, the reduced mass, and E the center of mass energy of the resonance Rolfs and Rodney (1988). The penetrability is given by
| (2) |
where and are the regular and irregular Coulomb wavefunctions respectively. For simplicity, we assume that Rn = 5 fm for both 19Ne and 19F, as was done in Ref. de Oliveira et al. (1997). The results of this comparison are shown in Table 2. For all of the analog states in the T = 1/2, A = 19 system examined here, the reduced widths agree within the experimental uncertainties at the 2 level.
| 19Ne Ex (MeV) | 19F Ex (MeV) | Jπ | 19Ne (meV) | 19F (meV) (Wilmes et al. (2002)) | (19Ne) | (19F) |
|---|---|---|---|---|---|---|
| 4.379 | 4.378 | 0.0078 | ||||
| 4.549 | 4.556 | ( | 4.4 | 3.2 | 0.0016 | |
| 4.600 | 4.550 | () | ||||
| 4.712 | 4.683 | () | ||||
| 5.092 | 5.107 |
VI Astrophysical Implications
We have calculated the thermally averaged 15O(Ne reaction rate per particle pair as
| (3) |
where the sum runs over the resonances whose strengths are given by
| (4) |
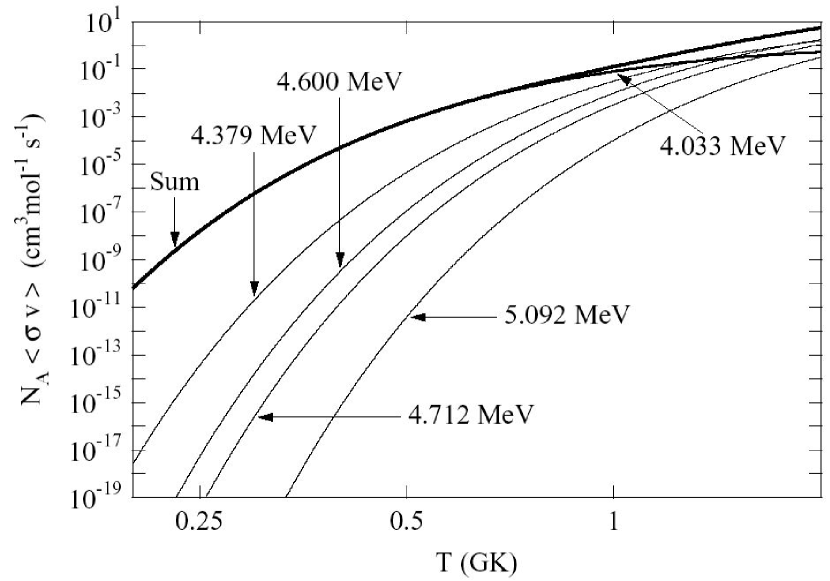
In these equations, is the reaction cross section, the relative velocity, the Boltzmann constant, the temperature, the center of mass energy of a resonance and its angular momentum. The contributions of individual states are shown in Fig. 10. Since we wish to be as conservative as possible in evaluating the reaction rate, the contributions of the 4.033- and 4.379 MeV states are calculated using our 99.73% confidence level upper limits on their widths, 514 eV and 5.6 meV respectively. These values were obtained using our upper limits on Bα and 3 upper limits on for these states. Also shown in Fig. 10 is the sum of the individual rates and the direct capture contribution, which was calculated as per the prescription of Ref. Langanke et al. (1986). Although the contribution of the 4.549 MeV state is included in the sum, its individual contribution is not shown in the figure because it is so small. The 4.033 MeV state completely dominates the reaction rate at temperatures below 0.5 GK. Since hydrodynamic nova models indicate that peak temperatures do not exceed this value José and Hernanz (1998); Starrfield et al. (2000), the 4.033 MeV state is the only resonance that need be considered in calculating the reaction rate in novae.
The possibility of breakout from the hot CNO cycles into the process under the high temperature and density conditions attained in the most massive ONe nova outbursts has been extensively discussed in previous work Wiescher et al. (1999). In order to investigate this possibility, we have performed a series of hydrodynamic calculations of nova outbursts on 1.35 M⊙ ONe white dwarfs using an implicit, spherically symmetric, hydrodynamic code in Lagrangian formulation José and Hernanz (1998). This code describes the entire outburst from the onset of accretion through the thermonuclear runaway, including the expansion and ejection of the accreted envelope. We assume a mass accretion rate of M⊙ yr-1 and 50% mixing between the solar-like accreted material and the outermost, ONe-rich shells of the underlying white dwarf. The mass, composition, and mass accretion rate were chosen in order to simulate the most energetic, hottest novae, in which hot CNO breakout is the most likely. In the same spirit, we have employed in these simulations an extreme, 99.73% confidence level upper limit on the 15O(,)19Ne rate. This rate is a factor of larger than that adopted in previous work Langanke et al. (1986); Mao et al. (1995); Vancraeynest et al. (1998). For these reasons, our simulations would identify the role played by 15O(,)19Ne in hot CNO breakout in novae, if there were any.

In order to evaluate the potential of the 15O(,) reaction to initiate breakout from the CNO cycles, we compare its rate with the 15O decay rate. We compute the rate per unit volume of a reaction involving distinct nuclei 1 and 2
| (5) |
where is the number density, the mass fraction, and the atomic mass of nucleus i, and is the mass density. The decay rate of a nucleus per unit volume is given by
| (6) |
where is its decay half-life. As shown in Fig. 11, the 15O(,)19Ne rate is less than 0.3% of the 15O decay rate at all times throughout the whole accreted envelope, including the hottest, innermost layer at its base, which is not ejected by the explosion. Hence more than 99.7% of the 15O nuclei synthesized in the nova outburst decay before they capture an particle, and there is no significant CNO breakout via 15O(,)19Ne. Moreover, as Fig. 11 illustrates, the contribution of 15O(,) to the production of 19Ne is greatly exceeded by the contribution of 18F(), the rate of which is taken from Ref. Coc et al. (2000). Thus our nova simulations support the conclusion drawn in Refs. Wiescher et al. (1999); Davids et al. (2003); Iliadis et al. (2002) that the 15O()19Ne reaction plays no important role in nova explosions.
VII Summary
In summary, we have measured the -decay branching ratios for all of the states in 19Ne relevant to the astrophysical rate of the 15O(,)19Ne reaction, populating them by means of the Ne,Ne reaction at 43 MeV/u and observing their decays with 100% geometric efficiency in a magnetic spectrometer. Combining our measurements with independent determinations of the radiative widths of these states, we have calculated the astrophysical rate of 15O(,)19Ne. Using this rate, we have carried out a series of hydrodynamic simulations of nova outbursts. On the basis of these calculations, we conclude that there can be no significant enrichment of nova ejecta due to CNO breakout via 15O(,)19Ne.
Acknowledgements.
This work was performed as part of the research program of the Stichting voor Fundamenteel Onderzoek der Materie with financial support from the Nederlandse Organisatie voor Wetenschappelijk Onderzoek. KER, RHS, and AHW acknowledge support from a NATO Collaborative Linkage Grant. The ANL Physics Division is supported by the U. S. Department of Energy Nuclear Physics Division under Contract No. W-31-109-ENG-38. RES acknowledges support from the US DOE under contract DE-FG02-98ER41086. JJ and MH acknowledge support from MCYT grants AYA2001-2360, AYA2002-04094-C03-02 and AYA2002-04094-C03-03.References
- José and Hernanz (1998) J. José and M. Hernanz, Astrophys. J. 494, 680 (1998).
- Starrfield et al. (2000) S. Starrfield, W. M. Sparks, J. W. Truran, and M. C. Wiescher, Astrophys. J. Suppl. Ser. 127, 485 (2000).
- José et al. (2001) J. José, A. Coc, and M. Hernanz, Astrophys. J. 560, 897 (2001).
- Wallace and Woosley (1981) R. K. Wallace and S. E. Woosley, Astrophys. J. Suppl. Ser. 45, 389 (1981).
- Schatz et al. (1998) H. Schatz, A. Aprahamian, J. Görres, M. Wiescher, T. Rauscher, J. F. Rembges, F.-K. Thielemann, B. Pfeiffer, P. Moeller, K.-L. Kratz, et al., Phys. Rep. 294, 167 (1998).
- Schatz et al. (2001) H. Schatz, A. Aprahamian, V. Barnard, L. Bildsten, A. Cumming, M. Ouellette, T. Rauscher, F.-K. Thielemann, and M. Wiescher, Phys. Rev. Lett. 86, 3471 (2001).
- Wiescher et al. (1999) M. Wiescher, J. Görres, and H. Schatz, J. Phys. G 25, R133 (1999).
- Audi and Wapstra (1995) G. Audi and A. H. Wapstra, Nucl. Phys. A595, 409 (1995).
- Magnus et al. (1990) P. V. Magnus, M. S. Smith, A. J. Howard, P. D. Parker, and A. E. Champagne, Nucl. Phys. A506, 332 (1990).
- Kubono et al. (2002) S. Kubono, Y. Yanagisawa, T. Teranishi, S. Kato, Y. Kishida, S. Michimasa, Y. Ohshiro, S. Shimoura, K. Ue, S. Watanabe, et al., European Physical Journal A 13, 217 (2002).
- Laird et al. (2002) A. M. Laird, S. Cherubini, A. N. Ostrowski, M. Aliotta, T. Davinson, A. di Pietro, P. Figuera, W. Galster, J. S. Graulich, D. Groombridge, et al., Phys. Rev. C 66, 048801 (2002).
- Mao et al. (1995) Z. Q. Mao, H. T. Fortune, and A. G. Lacaze, Phys. Rev. Lett. 74, 3760 (1995).
- Mao et al. (1996) Z. Q. Mao, H. T. Fortune, and A. G. Lacaze, Phys. Rev. C 53, 1197 (1996).
- Davids et al. (2003) B. Davids, A. M. van den Berg, P. Dendooven, F. Fleurot, M. Hunyadi, M. A. de Huu, K. E. Rehm, R. E. Segel, R. H. Siemssen, H. W. Wilschut, et al., Phys. Rev. C 67, 012801(R) (2003).
- Rehm et al. (2000) K. E. Rehm, J. A. Caggiano, P. Collon, A. Heinz, R. V. F. Janssens, C. L. Jiang, R. Pardo, M. Paul, J. P. Schiffer, R. H. Siemssen, et al., Argonne National Laboratory Physics Division Annual Report (unpublished, 2000), p. 6.
- van den Berg (1995) A. M. van den Berg, Nucl. Instrum. Methods B99, 637 (1995).
- Leegte et al. (1992) H. K. W. Leegte, E. E. Koldenhof, A. L. Boonstra, and H. W. Wilschut, Nucl. Instrum. Methods A313, 260 (1992).
- Wörtche (2001) H. J. Wörtche, Nucl. Phys. A687, 321c (2001).
- Tilley et al. (1995) D. R. Tilley, H. R. Weller, C. M. Cheves, and R. M. Chasteler, Nucl. Phys. A595, 1 (1995).
- Fortune et al. (1978) H. T. Fortune, H. Nann, and B. H. Wildenthal, Phys. Rev. C 18, 1563 (1978).
- Hagiwara et al. (2002) K. Hagiwara et al., Phys. Rev. D 66, 010001 (2002).
- Hackman et al. (2000) G. Hackman, S. M. Austin, T. Glasmacher, T. Aumann, B. A. Brown, R. W. Ibbotson, K. Miller, B. Pritychenko, L. A. Riley, B. Roeder, et al., Phys. Rev. C 61, 052801(R) (2000).
- Brown (2002) B. A. Brown, private communication (2002).
- Kiss et al. (1982) Á. Z. Kiss, B. Nyakó, E. Somorjai, A. Anttila, and M. Bister, Nucl. Instrum. Methods 203, 107 (1982).
- Wilmes et al. (2002) S. Wilmes, V. Wilmes, G. Staudt, P. Mohr, and J. W. Hammer, Phys. Rev. C 66, 65802 (2002).
- Pringle and Vermeer (1989) D. M. Pringle and W. J. Vermeer, Nucl. Phys. A499, 117 (1989).
- Davidson and Roush (1973) J. M. Davidson and M. L. Roush, Nucl. Phys. A213, 332 (1973).
- Wilmes et al. (1995) S. Wilmes, P. Mohr, U. Atzrott, V. Kölle, G. Staudt, A. Mayer, and J. W. Hammer, Phys. Rev. C 52, 2823 (1995).
- de Oliveira et al. (1997) F. de Oliveira, A. Coc, P. Aguer, G. Bogaert, J. Kiener, A. Lefebvre, V. Tatischeff, J.-P. Thibaud, S. Fortier, J. M. Maison, et al., Phys. Rev. C 55, 3149(R) (1997).
- Rolfs and Rodney (1988) C. E. Rolfs and W. S. Rodney, Cauldrons in the Cosmos (The University of Chicago Press, Chicago, 1988).
- Langanke et al. (1986) K. Langanke, M. Wiescher, W. A. Fowler, and J. Görres, Astrophys. J. 301, 629 (1986).
- Vancraeynest et al. (1998) G. Vancraeynest, P. Decrock, M. Gaelens, M. Huyse, P. van Duppen, C. R. Bain, T. Davinson, R. D. Page, A. C. Shotter, P. J. Woods, et al., Phys. Rev. C 57, 2711 (1998).
- Coc et al. (2000) A. Coc, M. Hernanz, J. José, and J.-P. Thibaud, Astron. Astrophys. 357, 561 (2000).
- Iliadis et al. (2002) C. Iliadis, A. Champagne, J. José, S. Starrfield, and P. Tupper, Astrophys. J. Suppl. Ser. 142, 105 (2002).