Correlations, Fluctuations, and Flow Measurements from the STAR Experiment
Abstract
New measurements of short-range and long-range two-particle correlations, azimuthal anisotropy, and event-by-event fluctuations from the STAR experiment for and 200 GeV Au+Au collisions are summarized. Striking evidence is presented for large, non-statistical fluctuations in mean transverse momentum. Descriptions of the data in terms of phenomenological source function models are also presented.
1 Introduction
Determining whether or not color deconfinement and chiral symmetry restoration occur during relativistic heavy ion collisions at RHIC requires a multi-prong effort involving experiment, phenomenology, and theory. Experimentally, measurements of inclusive spectra and correlation distributions for hadrons and leptons are needed to study quantum interference, final state interactions, and non-statistical fluctuations which produce correlations evident in the observed momentum distributions. Detailed studies of non-statistical event-by-event fluctuations [1] by way of correlation measurements are possible at RHIC, especially with the large acceptance STAR detector [2]. To help bridge the gap between experiment and theory, phenomenological source function models are being used by both experimentalists and theorists to describe the data.
This paper summarizes recent correlation measurements and phenomenological source model descriptions from the STAR experiment for soft hadron production in Au+Au collisions at and 200 GeV at RHIC. The data include results on Hanbury Brown and Twiss (HBT) pion interferometry, pion phase space densities, pion-kaon correlations, long-range correlations in pseudorapidity space, azimuthal anisotropy, and event-by-event fluctuations in mean transverse momentum. Data presented here were obtained with the STAR Time Projection Chamber (TPC) using the Level 0 trigger detectors CTB (Central Trigger Barrel) and ZDC (Zero-Degree Calorimeter) [2] and should be regarded as preliminary.
2 Source Function Phenomenology
Models of the space-time and momentum distribution of the hadronic freeze-out region in relativistic heavy ion collisions typically have the following form (for bosons) [3]:
| (1) |
where [with components (source rapidity) and ] is the space-time coordinate, (with components ) is the on-shell momentum coordinate, is the transverse mass, represents the collective velocity field which accounts for longitudinal (Bjorken) and transverse expansions, is the chemical potential, is the local temperature, and is an empirical modulation function. The latter may depend on the radial, azimuthal, rapidity and longitudinal proper time () coordinates of the source. A special case of the general emission function in Eq. (1) is referred to as the “blast-wave” model. This model assumes longitudinal boost invariance, finite freeze-out duration with respect to a fixed longitudinal proper time , and integration over the observed rapidity . The blast-wave model has been used to describe some of the STAR data taken in the first two RHIC runs as discussed below.
3 HBT Pion Interferometry
Preliminary results for three-dimensional Pratt-Bertsch [4] “out-side-long” HBT analyses of the recent GeV Au+Au minimum bias collision data from STAR for charged pions (see contribution to these proceedings by M. Lopez-Noriega) are very similar to the STAR [5] and PHENIX [6] results at 130 GeV. The measured three-dimensional correlations were fitted with the standard gaussian form,
| (2) |
where the relative momentum vector was evaluated in the longitudinal co-moving source (LCMS) frame and decomposed into components (parallel to beam direction), (parallel to pair transverse momentum) and (orthogonal to each). Standard cuts and corrections for track splitting, two-track merging in the STAR TPC, and Coulomb corrections were included as in Ref. [5]. The correlation lengths222 The conjugate lengths of the relative momentum correlations characterize the homogeneity scale of the emitting source. It is customary to refer to these lengths as “radii.” For expanding sources additional analysis is required to determine the total source geometry. or “radii,” , at GeV are similar in magnitude and have the same centrality and transverse mass () dependences as the results at GeV. adheres to the Makhlin-Sinyukov [7] dependence on expected for Bjorken expansion with corresponding source lifetimes which range from approximately 8 fm/c for peripheral collisions to 10 fm/c for central events. The ratio for the 200 GeV data is approximately unity in agreement with results reported at 130 GeV [5]. This result is not understood theoretically but can be described with a brief emission duration () and sharp radial cut-off of the source geometry.
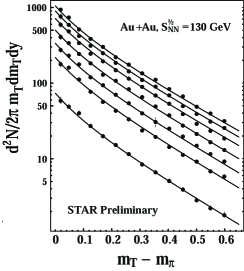
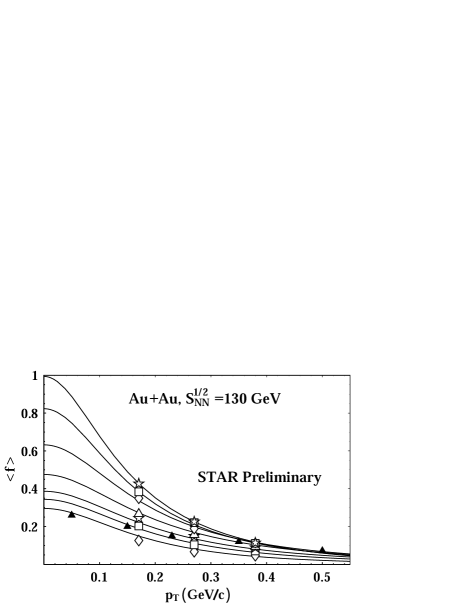
Another important aspect of the pion emission source which can be inferred from the HBT results is the phase space density (PSD). Bertsch [8] and Ferenc et al. [9] have shown that the pion transverse momentum () distribution together with the volume of the two-pion HBT correlation function can be used to determine the spatial average of the pion PSD, . This method was applied to the minimum bias GeV Au+Au collision data from STAR for negative pions for seven centrality bins [defined by the percent ranges 0-5 (most central), 5-10, 10-20, 20-30, 30-40, 40-50, and 50-80 (peripheral) of the total reaction cross section]. The distribution data, shown in Fig. 2, were fitted with a Bose-Einstein (BE) distribution, , with effective temperatures approximately 200 MeV (solid curves). The spectra in Fig. 2 increase in magnitude monotonically with centrality. The volumes of the three-dimensional Pratt-Bertsch HBT correlation functions for these seven centralities were obtained by direct summation of the binned data. The resulting estimates of for three ranges of (defined by the limits 0.125, 0.225, 0.325, and 0.45 GeV/c) are shown in Fig. 2. For comparison, similar estimates for central Pb+Pb collisions at the SPS from experiment NA49 [9] are indicated by the solid triangles in Fig. 2. The results show that increases with from SPS to RHIC and monotonically increases with centrality at RHIC energies. Apparently the universal pion PSD suggested by Ferenc [9] for AGS and SPS energies is not valid at RHIC energies.
An interesting prediction follows from the source function model of Tomášik and Heinz [3], which includes explicit longitudinal expansion effects, when fitted to the negative pion spectra in Fig. 2 and the PSD values in Fig. 2 (solid curves). The model, when extrapolated to low , predicts large values of for central events, suggesting that significant multiparticle Bose-Einstein effects may be present at low at RHIC.
4 Non-Identical Two-Particle Short-Range Correlations
Lednický et al. [10] pointed out that measurements of short-range relative momentum correlations in the co-moving pair frame of non-identical particles could be used to constrain dynamical models of the emission source, in particular the average space-time differences between emission regions for different particle species.333This analysis method cannot simultaneously determine spatial and temporal differences. For example, for K-, the attractive Coulomb interaction produces correlations greater than unity. Correlations obtained for pairs where the pion speed is selected to be greater than the kaon’s are denoted and vice versa for . If the pion and kaon emission times are the same, for example, observation of implies that the average emission radius is smaller than that of the and vice versa if . Similar arguments apply to the other charge sign combinations.
Three-dimensional Pratt-Bertsch [4] correlation ratios for the top 12% central events from the 130 GeV Au+Au collision data from STAR were measured and analyzed (see contribution to these proceedings by F. Retiere). Transverse velocity magnitudes () were restricted to the range from due to limitations imposed by dE/dx based particle identification with the TPC. Due to the inherent ambiguity in the analysis the data are consistent with pion emission which in one limit occurs at relatively smaller transverse position ( fm in the lab frame) than the kaons, assuming equal emission times, or in another limit occurs an average of 5.4 fm/ later than kaons assuming emission at equal transverse positions.
These correlation ratios can be understood in terms of the “blast-wave” model discussed above. The selection of particles together with the brief emission duration and sharp radial cut-off of the emission source geometry in the blast-wave model results in the emission zone being a thin shell near the outer edge of the source. Thermal smearing effects, which are larger for lighter mass particles (pions), conspire with the latter effect to cause the average pion emission radius to be smaller than the kaon’s. The parameters of the blast-wave model which describe these data [ = 110 MeV, (average transverse flow rapidity), R = 13 fm, fm/ and fm/], are consistent with those which describe the distribution shapes, pion HBT radii, and ratio.
5 Long-Range Correlations in Pseudorapidity Space
Two-particle momentum space correlations in general are six-dimensional objects. Depending on the nature of the dynamics to be studied and possible limitations of statistics, projections onto fewer dimensions, usually one or two, are typical in most analyses. For the STAR data presented, charge independent (CI) and charge dependent (CD) combinations of charged-sign pairs were formed. The CI correlations were obtained by summing over all pairs regardless of charge sign. The CD correlations are defined by , where are charge-pair specific correlations.
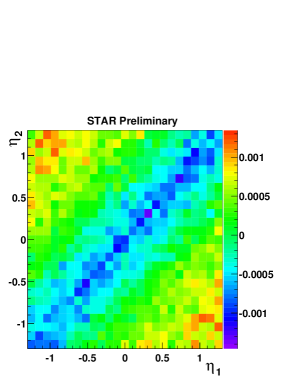
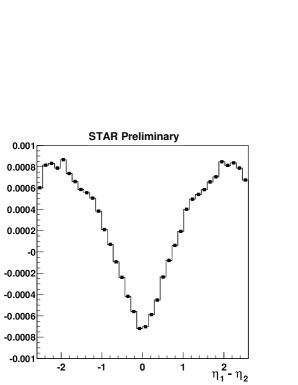
Correlations in pseudorapidity () space are affected by string fragmentation, source expansion, medium effects, etc. Fig. 4 displays, for example, the two-particle CD pseudorapidity correlation , for 130 GeV Au+Au collision data from STAR for central events (multiplicities of maximum) using primary particles with GeV/c, , and full azimuthal acceptance. The charge-pair specific correlations were obtained by dividing the number of particle pairs of each charge combination from the same event (sibling pairs) in a given bin (0.1 in width), summed over all events in the sample, by the number of corresponding charged particle mixed-pairs in the bin from different events. The latter events were required to have primary vertex locations within 5 cm in the TPC along the beam axis. The correlation function was normalized based on the total number of pairs used in the numerator and denominator. Large-scale structure covering the full STAR pseudorapidity acceptance is evident in Fig. 4 where the dark band along the diagonal is negative and the off-diagonal corners are positive. The dominant structure is with respect to the difference variable . Projection onto the axis, shown in Fig. 4, results in the CD autocorrelation. This is one example of long-range axial (longitudinal or azimuthal) correlations which potentially carry new information about the dynamics and evolution of the collision.
6 Long-Range Azimuthal Angular Correlations
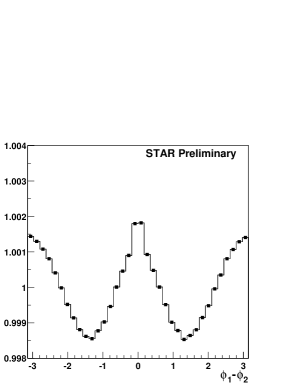
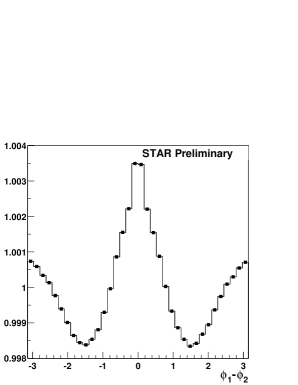
Two-dimensional azimuthal angle correlations, , are dominated by elliptic flow contributions which produce a dependence. Autocorrelation projections onto the axis are shown in Figs. 6 and 6 for like and unlike charge-sign pairs for GeV Au+Au collision data from STAR for combined mid-central and central events (multiplicities greater than 0.47 of maximum) assuming the same primary track acceptances described in the preceding section. In addition to elliptic flow, this kind of analysis reveals long-range non-flow components [11] (e.g. non-collective, few-body processes such as resonance decays, mini-jets, etc.) which appear as the dependences in Figs. 6 and 6.
A possible method to assess the importance of non-flow components has been discussed by Borghini et al. [12]. It is based on the technique of forming four-particle cumulants for studying azimuthal anisotropy in particle production from heavy ion collisions. In the cumulant expansion, dependences on lower-order correlation contributions are eliminated term-by-term leaving only those contributions arising from true, four-particle correlations. In this way, the deduced values of obtained with this procedure are expected to more accurately measure the collective, elliptic flow produced in heavy ion collisions.
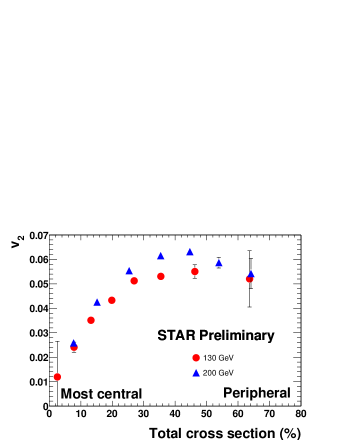
This new method was implemented in STAR [11] and used to analyze the and 200 GeV Au+Au data. Values of obtained in this way are reduced about 15% relative to that obtained with either the standard reaction plane method [13] or with two-particle angular correlations [11]. A comparison of versus centrality using four-particle cumulants for the and 200 GeV Au+Au data is shown in Fig. 8 where it is noted that on average increases about 7-10% at the higher energy.
From the study of elliptic flow in STAR it has been found that the event plane resolution is sufficient to conduct three-dimensional Pratt-Bertsch HBT analysis with respect to event plane. This type of analysis of charged pion data for and 200 GeV Au+Au collisions was reported in these proceedings by M. Lopez-Noriega. This analysis indicates an out-of-event-plane extended source with % azimuthal anisotropy for the geometrical source shape. The azimuthal dependence of the HBT radii cannot be explained assuming only azimuthal momentum anisotropy or a source with only azimuthal anisotropy in the density. In particular, the blast-wave model provides consistent descriptions of both and the azimuthally dependent HBT radii. Interestingly, the azimuthal source shape anisotropies at RHIC and the AGS [14] are both out-of-plane extended but the magnitude at RHIC is about one-tenth as large.
7 Long-Range Transverse Momentum Correlations
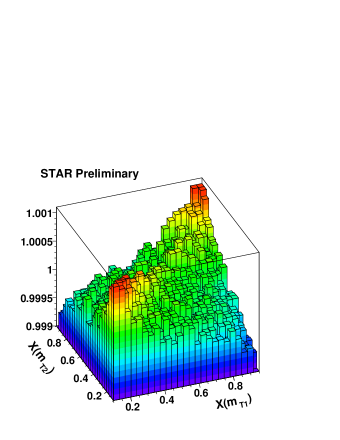
The shape of the transverse momentum spectrum of charged hadrons near mid-rapidity produced in relativistic heavy ion collisions is affected by quantum statistics, thermalization, transverse expansion, hard QCD processes, mini-jets, etc. In addition, non-statistical or dynamical fluctuations within each event or from event-to-event modify the shape of the inclusive distribution, increasing the yield at higher . For example, an intrinsic Boltzmann distribution with gaussian-like event-by-event fluctuations in the inverse temperature parameter becomes a Lévy distribution in the inclusive spectrum [15]. Similarly, fluctuations in inverse temperature produce a long-range “saddle shape” in the two-dimensional correlation function [15], which is the transverse momentum space analog of the two-dimensional correlations shown in the preceding sections. This is shown in Fig. 8 for the 5% most central Au+Au events at GeV using all charged particles with GeV/, , and full acceptance.444Approximately constant statistics in each bin were achieved by mapping into where ; = pion mass was assumed. The dominant features in these data include HBT and Coulomb interaction correlations which produce the ridge at low , the peak at large momentum, plus the long-range saddle shape. All features have similar amplitudes and are the result of non-statistical processes.
Further evidence that non-statistical event-by-event fluctuations occur in RHIC collisions is observed in the distribution of event-wise average (). From application of the central limit theorem (CLT) [15, 16] it is known that in the absence of non-statistical fluctuations, the mean and width of the event-wise distribution are equal to and , respectively, where and are the mean and variance of the inclusive distribution and is the event multiplicity. Increased width in the data beyond this amount provides further evidence for non-statistical fluctuations.
The inclusive spectrum of charged particles near mid-rapidity over the range of interest here is described very well by a Gamma distribution [16]. The distribution for RHIC events which would be expected in the absence of non-statistical fluctuations is accurately described by the -fold convolution of the inclusive Gamma distribution. This is also a Gamma distribution [16] whose variance is in agreement with the CLT [15, 16]. The accuracy of the -fold Gamma distribution for representing the statistical-fluctuations-only reference distribution is assured, for moderate to large values of , by the strong suppression of higher-order moments in this distribution. This suppression is driven by powers of which increase with moment number. Traditional mixed event and Monte Carlo sampled references were also obtained and shown to be consistent with the more accurate Gamma distribution reference.
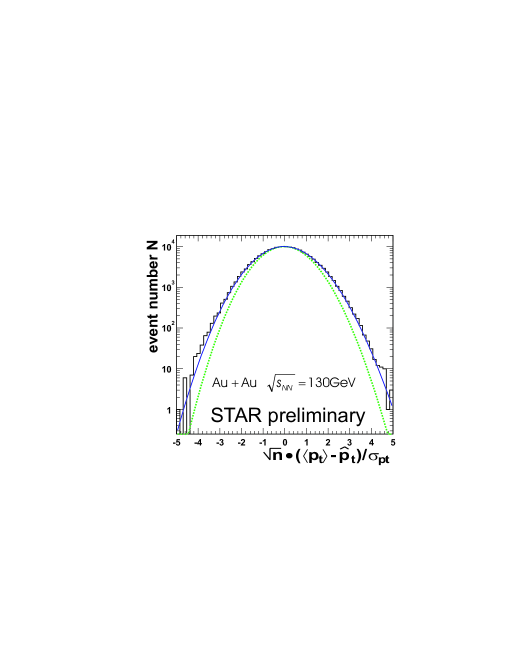
The frequency distribution555The distribution shown is for the quantity which is designed to suppress the slight dependence of on , remove the statistical broadening, and eliminate dependence on the variance of the inclusive distribution. of event-wise for the upper 15% central Au+Au collisions at GeV from STAR is shown in Fig. 10 in comparison with the Gamma distribution reference. These data are from 183K events and use 70% of all primary charged particles (less than 100% due to tracking inefficiency and track quality requirements) with GeV/, , and full acceptance. Striking evidence is observed for large, non-statistical fluctuations which increase the width of the measured distribution by 140.5(stat)% relative to the Gamma distribution reference.
Quantitative measures of non-statistical fluctuations are provided by a number of quantities [17, 18, 19], for example:
| (3) | |||||
| (4) | |||||
| (5) |
where is the number of events, is the event index, is the event multiplicity, is the mean multiplicity, is a particle index, and . For minimal variations of within the event ensemble
| (6) |
Charge sum (CI) and difference (CD) measures corresponding to are given by
| (7) |
where , , and is evaluated noting that the covariance, , vanishes via the CLT.
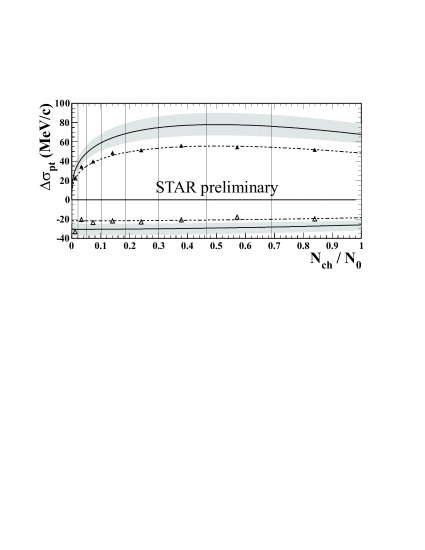
The centrality dependence of is shown in Fig. 10 for 205K GeV Au+Au minimum bias events from STAR using 70% of all charged primary particles for charge independent and charge dependent measures. Statistical errors are MeV/. The dashed lines are polynomial fits to the data, the solid lines are estimated extrapolations to 100% of the primary particles in the acceptance, and the shaded bands indicate % systematic errors.
These data provide a quantitative measure of the non-statistical fluctuations visually demonstrated in Fig. 10 and reveal an intriguing dependence on centrality. They also show that the CI (CD) fluctuations at RHIC are larger (smaller) than at the SPS [20]. The PHENIX experiment’s null result [21], which was carried out with much smaller acceptance than in STAR, does not contradict STAR’s observation of strong, non-statistical fluctuations.
8 Summary and Conclusions
During the first two years of RHIC operation the STAR experiment has produced a wealth of new correlation, flow, and event-by-event fluctuation measurements.666Event-by-event fluctuations in net charge were also measured for the 130 and 200 GeV Au+Au and p+p collision data; see the contribution to these proceedings by C. Pruneau. The results for the GeV Au+Au collisions are similar to those for the 130 GeV data. Compared to heavy ion results at lower energies from the AGS and SPS, the RHIC events display (1) similar HBT correlation lengths, (2) , (3) larger pion phase space densities, (4) stronger elliptic flow , (5) larger (smaller) charge independent (dependent) mean fluctuations, (6) strong transverse expansion with (apparent) brief emission duration, and (7) similar out-of-event-plane extended sources but with much smaller azimuthal source shape anisotropies. The STAR measurements, the successful description of the data in terms of the blast-wave model, and the general success of the hydrodynamical approaches [22] at RHIC energies, taken together, suggest that the Au+Au collisions at RHIC are governed by rapid thermal equilibration, very high initial pressures, followed by hydrodynamical expansion. Analyses of the emerging fluctuation measurements from STAR will also help determine the source structure and dynamics and allow further differentiation among QGP and purely hadronic scenarios.
References
- [1] H. Heiselberg, Phys. Rep. 351 (2001) 161.
- [2] K. H. Ackermann et al. (STAR Collaboration), Nucl. Instrum. Meth. Phys. Research (2002) in press; J. W. Harris et al. (STAR Collaboration), Nucl. Phys. A566 (1994) 277c; ibid. A698 (2002) 64c.
- [3] E. Schnedermann, J. Sollfrank and U. Heinz, Phys. Rev. C 48, (1993) 2462; B. Tomášik et al. nucl-th/9907096 (2001); Phys. Rev. C 65 (2002) 031902(R).
- [4] S. Pratt, T. Csörgő and J. Zimányi, Phys. Rev. C 42 (1990) 2646; G. Bertsch, M. Gong and M. Tohyama, Phys. Rev. C 37 (1988) 1896.
- [5] C. Adler et al. (STAR Collaboration), Phys. Rev. Lett. 87 (2001) 082301.
- [6] K. Adcox et al. (PHENIX Collaboration), Phys. Rev. Lett. 88 (2002) 192302.
- [7] A. N. Makhlin and Y. M. Sinyukov, Z. Phys. C 39 (1988) 69.
- [8] G. F. Bertsch, Phys. Rev. Lett. 72 (1994) 2349; ibid. 77 (1996) 789(E).
- [9] D. Ferenc et al. Phys. Lett. B 457 (1999) 347.
- [10] R. Lednický, V. Lyuboshitz, B. Erazmus and D. Nouais, Phys. Lett. B373 (1996) 30.
- [11] C. Adler et al. (STAR Collaboration), Phys. Rev. C 66 (2002) 034904.
- [12] N. Borghini, P. M. Dinh and J.-Y. Ollitrault, Phys. Rev. C 63 (2001) 054906.
- [13] K. H. Ackermann et al., (STAR Collaboration), Phys. Rev. Lett. 86 (2001) 402.
- [14] M. A. Lisa et al. (E895 Collaboration), Phys. Lett. B 496 (2000) 1.
- [15] T. A. Trainor, eprint hep-ph/0001148 (2000); priv. comm.
- [16] M. J. Tannenbaum, Phys. Lett. B 498 (2001) 29.
- [17] J. G. Reid, Nucl. Phys. A698 (2002) 611c.
- [18] M. Gaździcki and S. Mrówczyński, Z. Phys. C 54 (1992) 127.
- [19] S. A. Voloshin, V. Koch and H. G. Ritter, Phys. Rev. C 60 (1999) 024901.
- [20] H. Appelshäuser et al. (NA49 Collaboration), Phys. Lett. B 459 (1999) 679; H. Appelshäuser et al. (CERES Collaboration), Nucl. Phys. A698 (2002) 253c; J. G. Reid (NA49 Collaboration), priv. comm.
- [21] K. Adcox et al. (PHENIX Collaboration), Phys. Rev. C 66 (2002) 024901.
- [22] D. Teaney, J. Lauret and E. V. Shuryak, eprint nucl-th/0110037 (2001).