Measurement of Source Chaoticity for Particle Emission in Au+Au Collisions at = 130 GeV using 3-Particle HBT Correlations
Abstract
Data from the first physics run at the Relativistic Heavy-Ion Collider at Brookhaven National Laboratory from the STAR experiment have been analyzed using three-pion correlations to study whether pions are emitted independently at freezeout. We have made a high-statistics measurement of the three-pion correlation function and calculated the normalized three-particle correlator to obtain a quantitative measurement of the degree of chaoticity in the freeze-out environment.
1 Introduction
Two-pion Hanbury Brown and Twiss (HBT) interferometry in principle provides a means of extracting the space-time evolution of the pion source at freeze-out produced in relativistic heavy-ion collisions [1, 2]. An underlying assumption of this method is that pions are produced from a completely chaotic source, i.e. a source in which the hadronized pions are created with random quantum particle production phases. Although two-pion HBT provides some estimation of this chaoticity, a better method is available using three-particle correlations. Normalizing the three-pion correlation function appropriately by the two-pion correlator, the effects from particle misidentification and decay contributions can be made to drop out [3], thereby isolating possible coherence effects in the particle emission process. The resulting three-pion correlator provides the means of extracting the degree of source chaoticity by examining its value at zero relative momentum.
2 Derivation of Chaoticity from Normalized Three-pion Correlator
The measured observable in this analysis is the normalized three-pion correlator [3]:
| (1) |
Here and are the standard invariant relative momenta which can be computed for each pion triplet from the three measured momenta . and , where represents the momentum probability distribution.
For fully chaotic sources approaches as all relative momenta (and thus ) go to zero. If the source is partially coherent, a relationship can be established between the limiting value of the three-pion correlator at and the chaotic fraction () of the single-particle spectrum [3]:
| (2) |
Chaotic fraction gives an upper limit on the value of the two-pion parameter, which is sensitive to the number of coherent pairs in a sample.
The three-boson correlation function is calculated from the data by taking the ratio and normalizing it to unity at large . Here is the three-pion distribution as a function of the invariant three-pion relative momentum, integrated over the total momentum of the pion triplet as well as all other relative momentum components. It is obtained by taking three pions from a single event, calculating , and binning the results in a histogram. is computed by taking a single pion from three separate events.
3 Experimental Results and Discussion
Data for the present results are from 1M events taken during the Year-1 physics run at STAR using the Time Projection Chamber (TPC) [4] as the primary tracking detector. Two multiplicity classes were created by taking the 12% most central for the high multiplicity set, the next 20% most central for the low multiplicity set. For both multiplicity bins, tracks were constrained to have in the range GeV/, and pseudorapidity . In the range MeV/, approximately 150 million triplets were included in both the negative and positive pion studies.
The correlation function was corrected for Coulomb repulsion with a finite Gaussian source approximation [5]. The , correction factor is the product of three two-pion correction terms, obtained from the three pairs from the triplet.
In calculating , the actual binned values of the correlation function for the various values of are used instead of a fit [6]. , , and are calculated from triplets of particles from the dataset and the three pairs that can be formed from the triplet. Eq. (1) is then evaluated (as a function of ) using the binned two- and three-pion correlation functions, and averaged over the number of triplets in each bins.
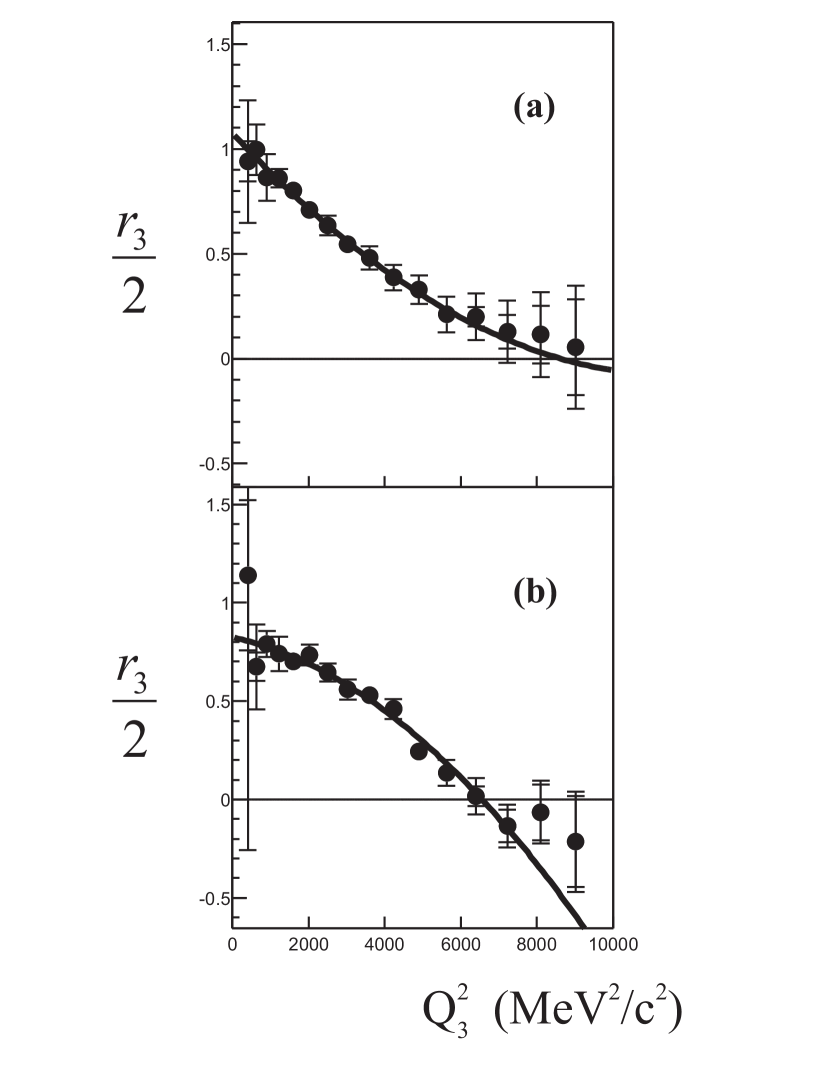
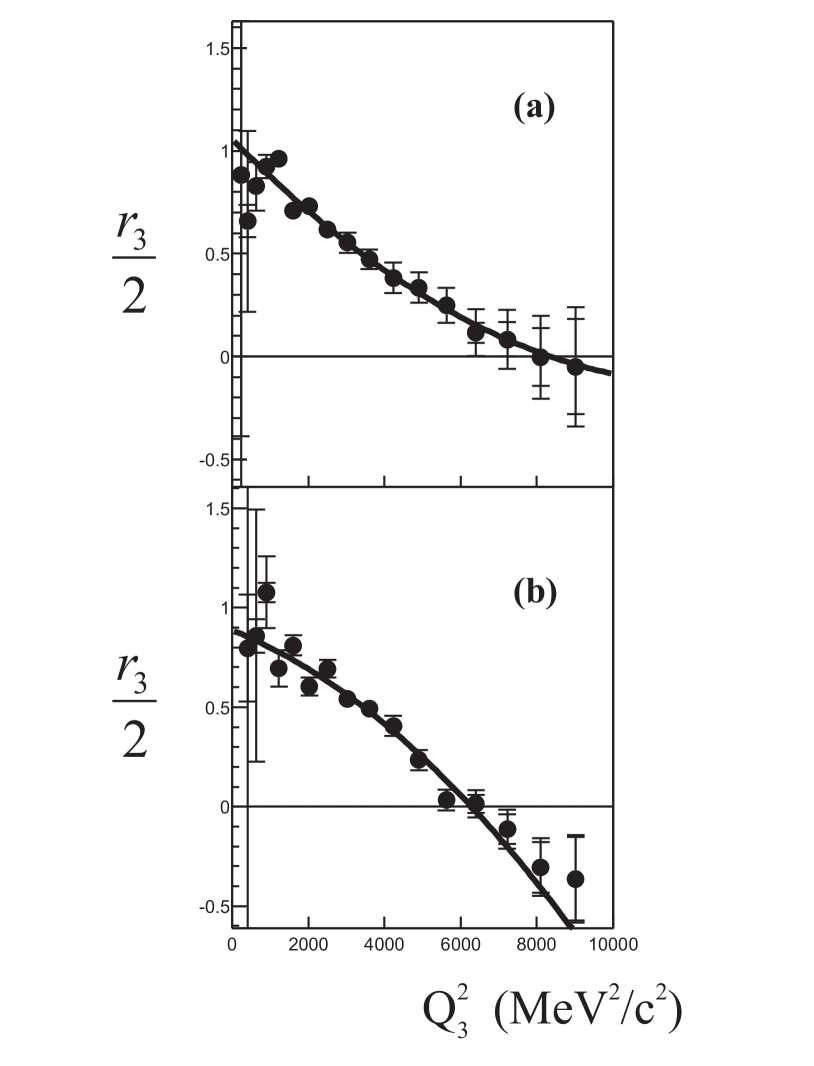
The results for the three multiplicity bins are shown in Figures 2 () and 2 (), plotted as functions of , and fitted to a function of the form:
| (3) |
This functional form is suggested by the theoretical analysis in [3] which shows that the leading relative momentum dependencies in the numerator and denominator of Eq. 1 are in even powers of [7]. The fit range used is MeV/.
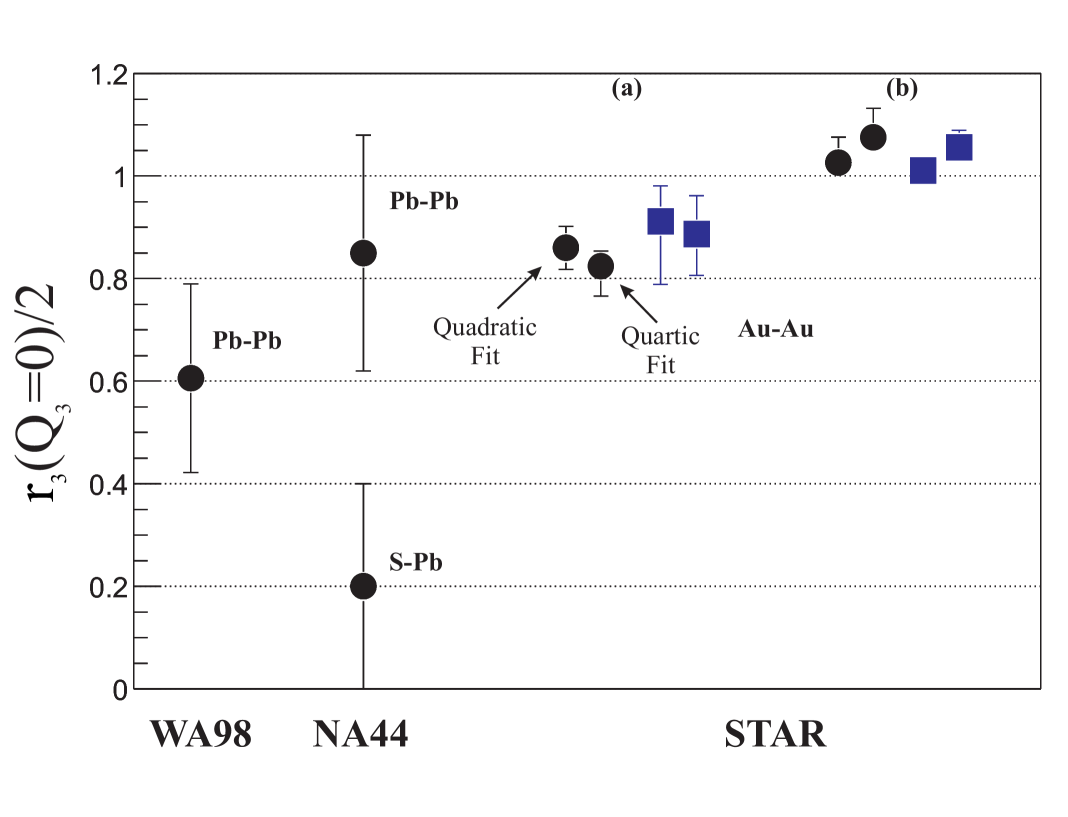
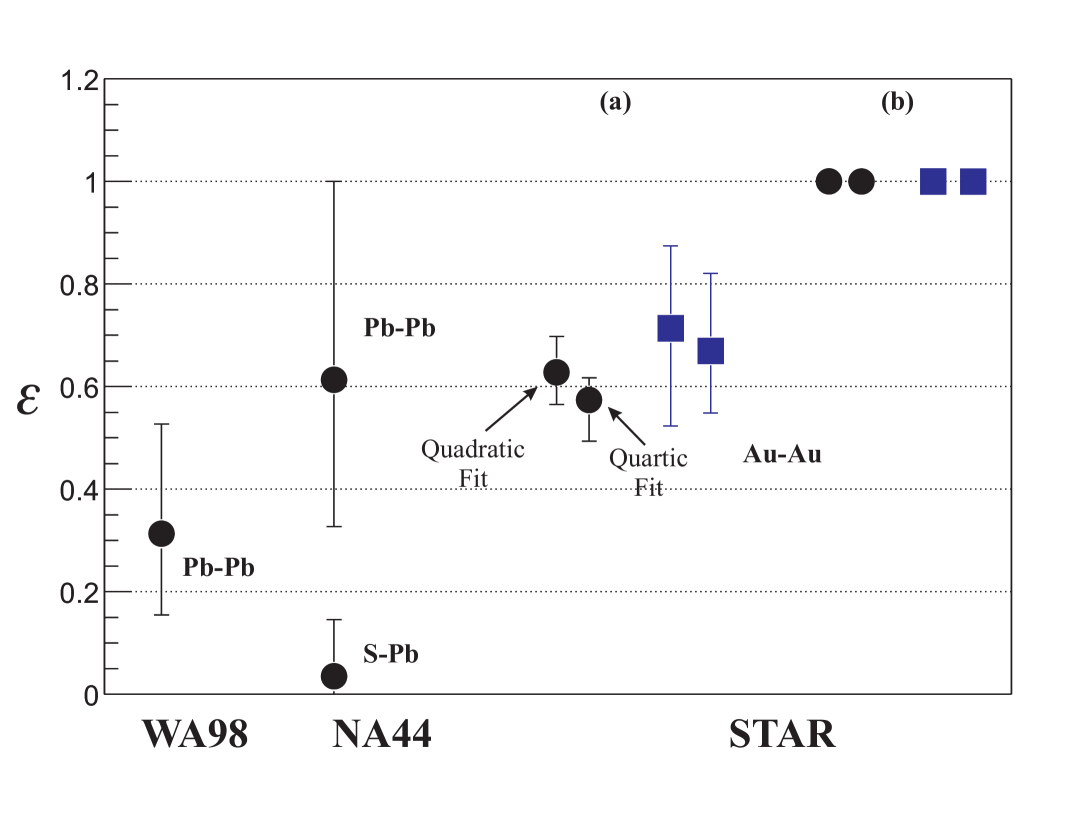
The resulting intercepts are shown in Fig. 4, along with the results of WA98 and NA44. NA44 reported a result close to unity for Pb-Pb interactions, but a much lower result for S-Pb [8], both with no clear dependence. WA98 also reported a result close to unity at for Pb+Pb, and the -dependence in their result is similar to what we see in central collisions [9].
Figure 4 shows the calculation of for STAR’s measurements, and for those from WA98 and NA44. The plot shows a systematic trend in the STAR results going from the peripheral bin to the central bin, with the central results showing a fully chaotic source. By calculating the number of coherent pair in the dataset from the chaotic fraction, a maximum value of the two-pion factor has been determined which is consistent with the value of found in the two-pion analysis [10].
4 Conclusion
In summary, we have presented three-pion HBT results for GeV data at STAR, and have shown that for the two multiplicity classes the STAR data indicate a large degree of chaoticity in the source at freeze-out. High statistics from STAR have allowed a normalized three-pion correlator calculation that extends to MeV/ in , and when used in conjunction with the formalism of partially coherent sources obtained from [3], quantitative limits on the fraction of chaoticity are obtained which are in agreement with two-pion parameter measured at STAR. STAR’s measured values provide increased confidence in the validity of standard HBT analyses based on the assumption of a chaotic source.
References
- [1] M. Gyulassy, S.K. Kauffmann, and L.W. Wilson, Phys. Rev. C 20, 2267 (1979).
- [2] U. A. Wiedemann and U. Heinz, Phys. Rep. 319, 145 (1999).
- [3] U. Heinz and Q. H. Zhang, Phys. Rev. C 56, 426 (1997).
- [4] J.W. Harris (STAR Collaboration), Nuclear Physics A 698, 64c-77c (2002).
- [5] S. Pratt, T. Csörgő and J. Zimányi, Phys. Rev. C 42, 2646 (1990).
- [6] T.J. Humanic, Phys. Rev. C 60, 014901 (1999).
- [7] For a fully chaotic source (), the leading quadratic relative momentum dependencies in the numerator and denominator of Eq. 1 cancel, if the ratio is taken pointwise in 9-dimensional space. If numerator and denominator are first projected on the single variable , this cancellation in the ratio is spoiled. For partially coherent sources there is no such cancellation to begin with [3]. The parametrization in Eq. (3) thus captures the expected leading dependence of the data (U. Heinz, private communication).
- [8] I.G. Bearden et. al., Phys. Lett. B 455, 77 (1999).
- [9] M.M. Aggarwal et. al., Phys. Rev. Lett. 85, 2895 (2000).
- [10] C. Adler et. al., Phys. Rev. Lett. 87, 082301 (2001).