and production in Au+Au collisions at and GeV
Abstract
Mid-rapidity Omega and anti-Omega production in Au+Au collisions at RHIC is studied with the STAR experiment. We report preliminary results on yields and spectra at and GeV. Production relative to negatively charged hadrons (h-) as well as thermal freeze-out and collective expansion are discussed.
1 Introduction
Strangeness production/enhancement has been long suggested as a possible signature able to discriminate between the quark-gluon plasma (QGP) and hadron gas (HG) scenario in heavy ions collisions. Due to high gluon density expected in high energy nuclear collisions, the production of multi-strange baryons (, ) may be enhanced over other particles [1]. Furthermore, any enhancement is expected to increase with the strangeness content of the particle, making the the most sensitive strangeness probe. Its production relative to other hadrons gives a severe constraint to statistical models.
In addition, early kinetic freeze-out of , and has been suggested at SPS, which would result in these particles carrying information on the flow velocity of strongly interacting matter (HG or QGP at hadronisation) [2]. Thus, measuring the transverse velocity of may be helpful in understanding the system evolution of collective expansion [3].
2 Experiment and Analysis
The Solenoidal Tracker at RHIC (STAR) detector system [4], in the configuration used to collect data presented here, consists principally of a large Time Projection Chamber (TPC) used for charged particle tracking. A magnet surrounding the TPC was operated at 0.25 (0.5) T for the data taken at GeV. Triggering was achieved using two hadronic calorimeters (ZDC) in the very forward region and an array of scintillator slats arranged in a barrel (CTB) around the TPC. The centrality cuts used correspond to the top 11% (130 GeV) and 10% (200 GeV) of the total hadronic cross section. In addition, the reconstructed were selected in the kinematical region GeV/c and . The total number of events analysed is and for the 130 and 200 GeV runs respectively.
The current analysis proceeds as follows in order to reconstruct the Omega baryon. As a first step, were reconstructed topologically through the sequential weak decay (BR=67.8%) and (BR=63.9%). Within an event, all tracks reconstructed in the TPC were extrapolated backward to the primary vertex of the collision. Candidate tracks were paired to form neutral decay vertices (), which were associated afterward with a bachelor track to form vertices. Selections are mainly based on geometrical cuts, i.e. distance of closest approach between candidate tracks and to the primary vertex. Then, to reduce further the combinatorial background resulting from close but uncorrelated tracks, an identification of daughter tracks based on mean specific energy loss in the TPC was used. Invariant mass distributions of the and are shown on Fig.1.
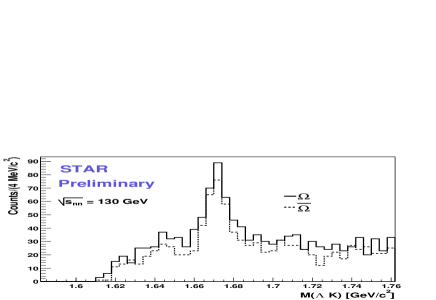
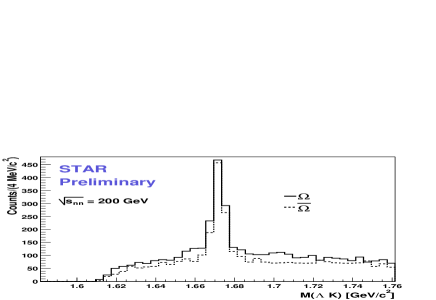
To estimate the raw signal, the background was subtracted by using a linear interpolation between two regions located a few MeV/c2 on either side of the peak region. The raw signals were corrected for acceptance and efficiency using Monte Carlo ’s embedded into real events.
3 Results and Discussion
Figure 2 shows the corrected transverse mass spectra at GeV. The yields (dN/dy) and the inverse slopes (T) are extracted from exponential fits (specified by eq.1) to the data.
| (1) |
The results are quoted in table 1 along with those at = 130 GeV [8]. Statistical models have produced values of dN/dy that are in good agreement with preliminary results at GeV [5, 6, 7], assuming chemical equilibrium with T 175 MeV and 47 MeV.
| Energy | GeV | GeV | ||
|---|---|---|---|---|
| Particle | ||||
| T (MeV) | 424 65 | 387 52 | 417 23 | 394 19 |
| dN/dy | 0.32 0.09 | 0.34 0.09 | 0.31 0.04 | 0.33 0.05 |
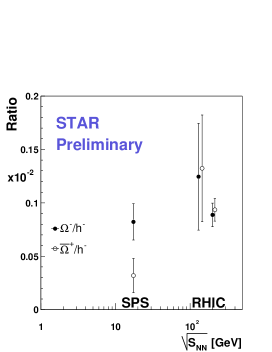
The mid-rapidity ratios and are shown on Fig. 2 for SPS and RHIC energies. Unlike at the SPS, the ratio approaches the ratio at RHIC; this can be explained by the lower net baryon density in the system. The ratio is found to be consistent with the values obtained at SPS; its value might indicate that strangeness saturation was already reached at SPS and we are still in that regime at RHIC. This trend has also been observed for the particles and is detailed in [9].
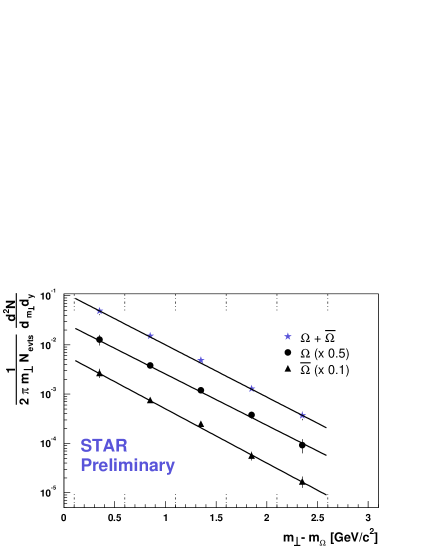
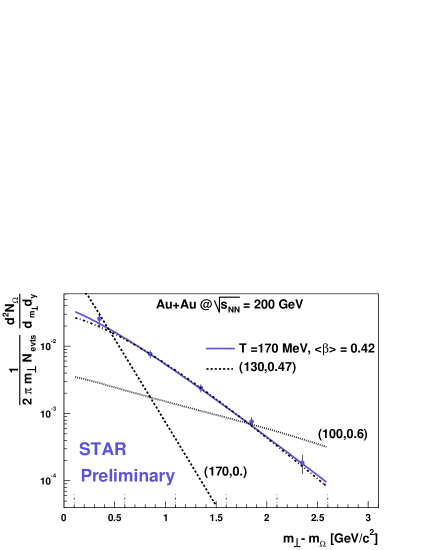
To address the question of transverse flow, m⟂ spectra were fit using the so-called blast-wave parameterization [10] :
| (2) |
To perform the first fit (Fig.3) the kinetic freeze-out temperature has been set to the value of chemical freeze-out given by statistical models (T = T 170 MeV). Thus, we obtain equal to 0.45 0.17 (syst.). This compares to 0.2 for [2] and may be interpreted as a higher transverse flow component at RHIC. The parameters extracted from similar fits for pions, kaons and protons are T = 100 MeV and = 0.6 (for Au+Au at 200 GeV) [12], and are not compatible with the ones we obtained for (using a different approach, the latest NA49 results [13] have shown that a global fit of particles spectra with a single set of parameters (T,), including , was possible at = 17.3 GeV). Nevertheless, the two parameters (T,) are strongly correlated and others values can be used that give equally good results, as demonstrated with the second fit on Fig. 3 fixing T at 130 MeV. Further studies may allow us to determine (T,) more precisely and hence estimate the limiting values for these parameters.
4 Conclusion
We have presented preliminary results on and production at RHIC. We found similar and inverse slope values at = 130 GeV and 200 GeV. Multi-strange particles ratios give some indication that the fireball is chemically equilibrated and the production scale with h- from SPS to RHIC. The mean transverse velocity of the , assuming an early thermal freeze-out, is found to be = 0.45 0.17 (syst.). It would be premature to draw conclusions about flow (since, among other details, its is unknown) but the increase in from SPS to RHIC energy raises the question of which mechanism might produce it [3]. In the near future, with larger statistics, improvements in the determination of transverse flow (blast-wave fits) as well as anisotropic flow (v2) measurement of might be possible and give us a clearer picture of the dynamics.
References
- [1] P. Koch, B. Muller and J. Rafelski, Phys. Rept. 142:167-262 (1986)
- [2] K.A. Bugaev, M. Gaździcki and M.I. Gorenstein, Phys. Lett. B544, 127-131 (2002)
- [3] D. Teaney, J. Lauret and E.V. Shuryak, nucl-th/0110037.
- [4] J. Harris for the STAR collaboration, Nuc. Phys. A698 64c-77c, (2002)
- [5] P. Braun-Munziger et al., Phys.Lett. B518, 41-46 (2001)
- [6] G. Van Buren for the STAR collaboration, these proceedings.
- [7] W. Broniowski and W. Florkowsky, Phys. Rev. C65, 064905 (2002)
- [8] B. Hippolyte, PhD Thesis, Université de Strasbourg.
- [9] J. Castillo for the STAR collaboration, these proceedings.
- [10] E. Schnedermann, J. Sollfrank and U. Heinz, Phys. Rev. C48, 2462-2475 (1993)
- [11] R. Caliandro et al., J. Phys. G25, 171-180 (1999).
- [12] M. Kaneta, Private Communication.
- [13] M. Van Leuven for the NA49 Collaboration, these proceedings.