Bose-Einstein Correlations of Charged Kaons
in Central Pb+Pb Collisions at
Abstract
Bose-Einstein correlations of charged kaons were measured near mid-rapidity in central Pb+Pb collisions at 158 AGeV by the NA49 experiment at the CERN SPS. Source radii were extracted using the Yano-Koonin-Podgoretsky and Bertsch-Pratt parameterizations. The results are compared to published pion data. The measured dependence for kaons and pions is consistent with collective transverse expansion of the source and a freeze-out time of about 9.5 .
S.V. Afanasiev9,T. Anticic21, B. Baatar9,D. Barna5, J. Bartke7, R.A. Barton3, M. Behler15, L. Betev10, H. Białkowska19, A. Billmeier10, C. Blume8, C.O. Blyth3, B. Boimska19, M. Botje1, J. Bracinik4, R. Bramm10, R. Brun11, P. Bunčić10,11, V. Cerny4, O. Chvala17, J.G. Cramer18, P. Csató5, P. Dinkelaker10, V. Eckardt16, P. Filip16, Z. Fodor5, P. Foka8, P. Freund16, V. Friese8,15, J. Gál5, M. Gaździcki10, G. Georgopoulos2, E. Gładysz7, S. Hegyi5, C. Höhne15, G. Igo14, P.G. Jones3, K. Kadija11,21, A. Karev16, V.I. Kolesnikov9, T. Kollegger10, M. Kowalski7, I. Kraus8, M. Kreps4, M. van Leeuwen1, R. Lednicky16, P. Lévai5, A.I. Malakhov9, S. Margetis13, C. Markert8, B.W. Mayes12, G.L. Melkumov9, C. Meurer10, A. Mischke8, M. Mitrovski10, J. Molnár5, J.M. Nelson3, G. Pálla5, A.D. Panagiotou2, K. Perl20, A. Petridis2, M. Pikna4, L. Pinsky12, F. Pühlhofer15, J.G. Reid18, R. Renfordt10, W. Retyk20, C. Roland6, G. Roland6, A. Rybicki7, T. Sammer16, A. Sandoval8, H. Sann8, N. Schmitz16, P. Seyboth16, F. Siklér5, B. Sitar4, E. Skrzypczak20, G.T.A. Squier3, R. Stock10, H. Ströbele10, T. Susa21, I. Szentpétery5, J. Sziklai5, T.A. Trainor18, D. Varga5, M. Vassiliou2, G.I. Veres5, G. Vesztergombi5, D. Vranić8, A. Wetzler10, C. Whitten14, I.K. Yoo8,15, J. Zaranek10, J. Zimányi5
1NIKHEF, Amsterdam, Netherlands.
2Department of Physics, University of Athens, Athens, Greece.
3Birmingham University, Birmingham, England.
4Comenius University, Bratislava, Slovakia.
5KFKI Research Institute for Particle and Nuclear Physics,
Budapest, Hungary.
6MIT, Cambridge, USA.
7Institute of Nuclear Physics, Cracow, Poland.
8Gesellschaft für Schwerionenforschung (GSI),
Darmstadt, Germany.
9Joint Institute for Nuclear Research, Dubna, Russia.
10Fachbereich Physik der Universität, Frankfurt, Germany.
11CERN, Geneva, Switzerland.
12University of Houston, Houston, TX, USA.
13Kent State University, Kent, OH, USA.
14University of California at Los Angeles, Los Angeles, USA.
15Fachbereich Physik der Universität, Marburg, Germany.
16Max-Planck-Institut für Physik, Munich, Germany.
17Institute of Particle and Nuclear Physics, Charles University,
Prague, Czech Republic.
18Nuclear Physics Laboratory, University of Washington,
Seattle, WA, USA.
19Institute for Nuclear Studies, Warsaw, Poland.
20Institute for Experimental Physics, University of Warsaw,
Warsaw, Poland.
21Rudjer Boskovic Institute, Zagreb, Croatia.
1 Introduction
Momentum correlations between pions have been widely used to study the space-time extent of the emitting source in nucleus-nucleus collisions. For identical bosons the symmetry requirement of Bose–Einstein (BE) statistics results in an enhanced production of bosons with small momentum difference. This effect was first observed by Goldhaber, Goldhaber, Lee and Pais (GGLP) [1] for pairs of like-charge pions at small opening angles. Kopylov and Podgoretsky [2] noticed the deep analogy with Hanbury-Brown and Twiss (HBT) space– time correlations [3] of the classical electromagnetic fields used in astronomy for interferometric measurement of star angular radii and developed the basic methods of momentum interferometry in particle and nuclear collisions. This technique represents an important tool for investigating the underlying reaction mechanism as far as it influences the decoupling configuration. For example, an unusually long decoupling time was suggested as one of the signatures of quark-gluon plasma (QGP) formation [4, 5].
In this paper, we present data from an experimental study of BE correlations between charged kaons emitted in central collisions of Pb nuclei at a beam energy of 158 AGeV with a fixed Pb target. We compare the results with those from earlier analyses of pion data for the same reaction. It was argued [6] that correlations of kaons and pions might differ due to different contributions from resonance decays during their propagation toward freeze-out. A comparison could help to distinguish between a QGP deflagration and a conventional production mechanism based on independent nucleon-nucleon interactions. However, rescattering between the final hadrons may smear out the differences and obscure what happened in the earlier stages of the collision.
A probably more important aspect of kaons is associated with their higher mass. The particle source resulting from a collision between heavy nuclei is rapidly expanding in longitudinal and transverse directions. This manifests itself in a dependence of the extracted correlation parameters on the transverse mass of the particles, which form the pair [7]. Therefore, kaons and pions probe the situation in different kinematic regimes. Assuming that the decoupling surface coincides for both particle species, the kaons extend the range of the pion data and improve the sensitivity of comparisons with reaction models.
Because of their much smaller abundance a study of kaon correlations requires higher event numbers and a significantly improved particle identification compared to the pion case. The only published results on kaon correlation in Pb+Pb collisions were obtained by experiment NA44 at the CERN SPS [8]. The NA49 spectrometer [9] includes a high-resolution time-of-flight (TOF) detector with acceptance at mid-rapidity which allows to select a relatively clean kaon sample. Data obtained from an analysis of approximately 1.7 million central as well as from 2 million semi-central events will be shown. The K+K+ and K-K- correlation functions are obtained in terms of the Bertsch-Pratt (BP) [4, 5, 10, 11] and Yano-Koonin-Podgoretsky (YKP) [10, 11, 12] coordinate frames. They are corrected for Coulomb effects. The extracted parameters - correlation radii, freeze-out duration - will be compared with those obtained for pions [8, 13, 14, 15, 16] in the same central rapidity range.
2 Experiment and Data
The 158 AGeV Pb ions from the CERN SPS were measured in position and direction by beam position detectors before hitting a Pb foil target of 224(336) mg/cm2 thickness (1(2.5) % interaction probability) during the 1995/1996(2000) data taking periods.
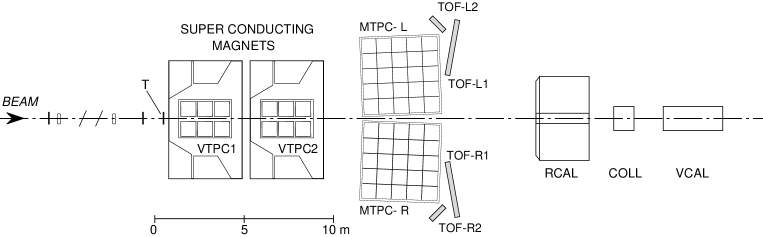
The trigger condition was derived from the signal detected in the veto calorimeter (VCAL, see Fig. 1) which intercepts mainly projectile spectators 25 m downstream of the target. For the central data sample the 5% most central interactions were selected. In a geometrical picture this corresponds to impact parameters smaller than 3.5 fm. Data taken during different run periods contribute 380 000 (1995), 400 000 events (1996) and 911 000 events (2000). From the year 2000 run an additional sample corresponding to semi-central events (centrality 5% - 20%) was available and analysed.
The NA49 spectrometer (described in detail in [9]) consists of two superconducting magnets (total bending power of 7.5 Tm) with TPCs (time projection chambers) inside the magnetic field, two additional TPCs downstream of the magnets, and several TOF (time-of-flight) walls on both sides of the beam (Fig. 1). The momentum vectors of charged particles are determined from their trajectories as measured in the TPCs and the position of the interaction point. The accuracy of the four-momentum difference111Note that the units are chosen such that of a particle pair is of the order of 3.5 MeV in the momentum range of interest.
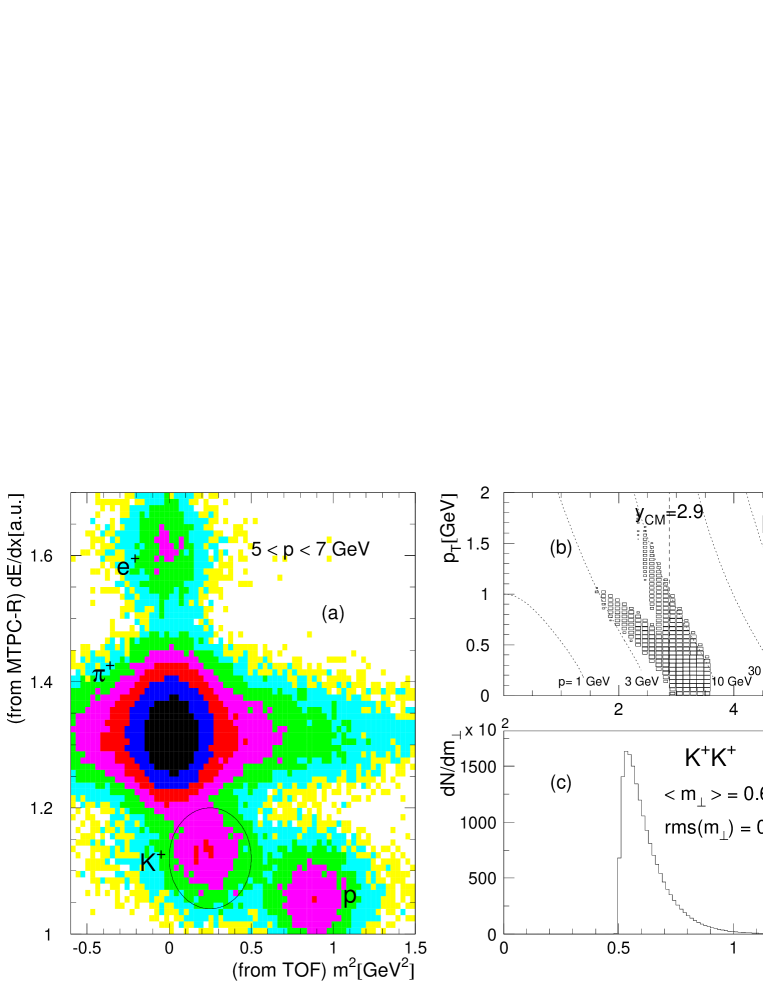
For particle identification a combination of the specific energy loss measured in the TPCs MTPC-R/L with the mass information obtained from the TOF walls TOF-R1/L1 was used. The method is illustrated by Fig. 2a for a typical momentum range. From Fig. 2a it is clear that no satisfactory kaon identification can be derived from either the specific ionization or the TOF signal alone. Therefore we restrict the phase space used in the present study to the acceptance of the TOF walls. Particles inside the region around the kaon peak (see Fig. 2a) are selected as kaons. The corresponding population in the rapidity () and transverse momentum () plane is displayed in Fig. 2b for the K+ mesons; for K- it is nearly identical. From fits of sums of Gaussian distributions for the different particle species the purity of the kaon sample is estimated to be about 93%, resulting in a purity of 86% for pairs. The distribution of the average transverse mass222, where is the average transverse momentum of the kaons in the pair. of accepted K+K+ pairs is shown in Fig. 2c. Due to statistical limitations a subdivision into intervals was not possible. Because of slightly different detector efficiencies the weighted means of the correlation functions obtained from the 1995, the 1996 data and the 2000 data were used for the BE correlation analysis. Details of the analysis can be found in [17].
3 Bose-Einstein Correlation Analysis
The correlation function is defined as the ratio of the probability of observing particles with four-momenta and simultaneously in one event divided by the probability for pairs of independent particles with the same single- particle phase space distribution. Experimentally, the raw correlation function is obtained as
| (1) |
where denotes the yield of particle pairs from the same event with the four-momentum difference . is the uncorrelated reference generated by the event-mixing method and the factor is used to normalize the correlation function to be unity at large relative momenta (200 - 2000 MeV).
Assuming an expanding Gaussian source in a representation given by Yano-Koonin-Podgoretsky [12] and Heinz [18] that is appropriate to explicitly take into account collective expansion, the correlation due to quantum statistics can be parameterized in terms of the components of :
| (2) | |||||
where is the transverse momentum difference, is the longitudinal momentum difference, is the energy difference, is the correlation intensity parameter and is the “Yano-Koonin velocity” which describes the source’s longitudinal collective motion in the given rapidity range. The radii , where denote the transverse, longitudinal and temporal extent of the coherence lengths, respectively.
Although the YKP parameters have the most straightforward physical interpretation [19], this parameterization can be ill-defined in some kinematic regions [20]. Therefore, we use the Bertsch-Pratt parameterization in addition. For cylindrically symmetric systems and the midrapidity range it reads with vanishing cross terms [10] :
| (3) | |||||
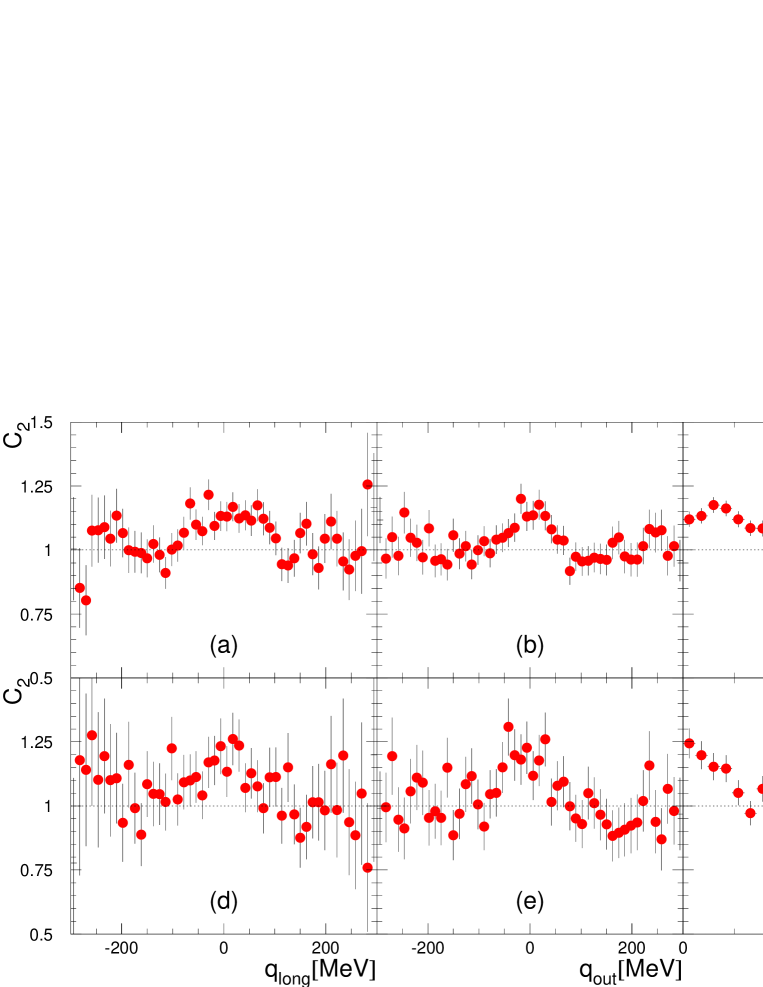
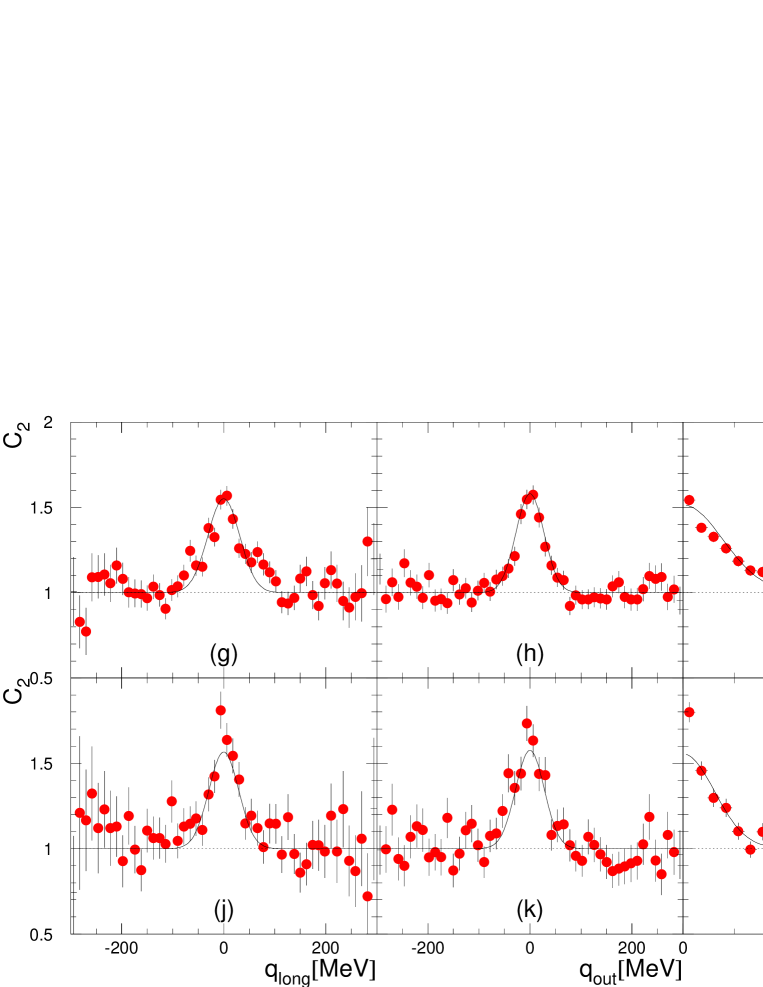
where is identical with defined above, and (, ) are the components of the transverse 3-momentum difference in outward direction and perpendicular to it. As reference frame, a pairwise defined co-moving system would be appropriate. In view of the limited rapidity range considered here it is approximated by the so-called fixed local center-of-mass system, thus having the same frame for all particle pairs. Projections of the raw correlation function of and pairs are shown in Fig. 3 in BP-variables.
In order to extract the quantum-statistical effects, the counter-acting influence of the Coulomb repulsion as well as the dilution by misidentified pairs must be taken into account, while the effect of the strong interaction can be neglected [21]. This leads to the ansatz:
| (4) |
where denotes the purity of the pairs, represents the Coulomb repulsion factor and is the correlation from quantum statistics parameterized by Eqs. 2 or 3. Because of the considerable size of the source in the present reaction [22] the classical Gamov correction factor is not appropriate [23]. For pions the Coulomb correction can be approximately determined from the experimental correlation function for unlike-sign pairs [13], which is dominated by the Coulomb interaction and receives no contribution from BE correlation. In contrast, the strong interaction cannot be neglected [24] for unlike-sign kaons. Therefore, a parameterization of the Coulomb repulsion factor derived from a finite-size source Coulomb wave calculation [21] is used for the present analysis:
| (5) |
where is the average distance between the emission points of the kaons in the pair center-of-mass system. Following [21] the value of can be calculated from the correlation radii in Eqs. 2 and 3. As a consistency check the analogous procedure is applied below to the correlations which are also measured in this experiment.
The determination of the radius parameters proceeds in an iterative way. Starting with estimated values for , the Coulomb repulsion factor (Eq. 5) is calculated and smeared with the measuring resolution of . A set of and are then obtained from a 3-dimensional maximum likelihood fit of the r.h.s. of Eq. 4 to the raw correlation function Eq. 1. The procedure is iterated until the fit parameters reach stable values.
For the central collisions the final results for the YKP and BP parameterizations are summarized in Table 1 with the fit quality given by . The quoted errors are only statistical. The systematic errors on the the fitted parameters due to uncertainty in Coulomb correction and strong interaction are estimated to be about 10% of each parameter.
| YKP | ||||||
| K+ | 0.740.06 | 3.950.35 | 4.340.30 | 2.860.65 | 0.010.02 | 216/228 |
| K- | 0.860.05 | 4.520.45 | 4.150.28 | 3.000.52 | 0.010.05 | 270/328 |
| BP | ||||||
| K+ | 0.810.06 | 4.460.25 | 3.580.40 | 5.070.27 | 439/446 | |
| K- | 0.890.07 | 4.780.33 | 4.550.31 | 4.970.39 | 499/537 |
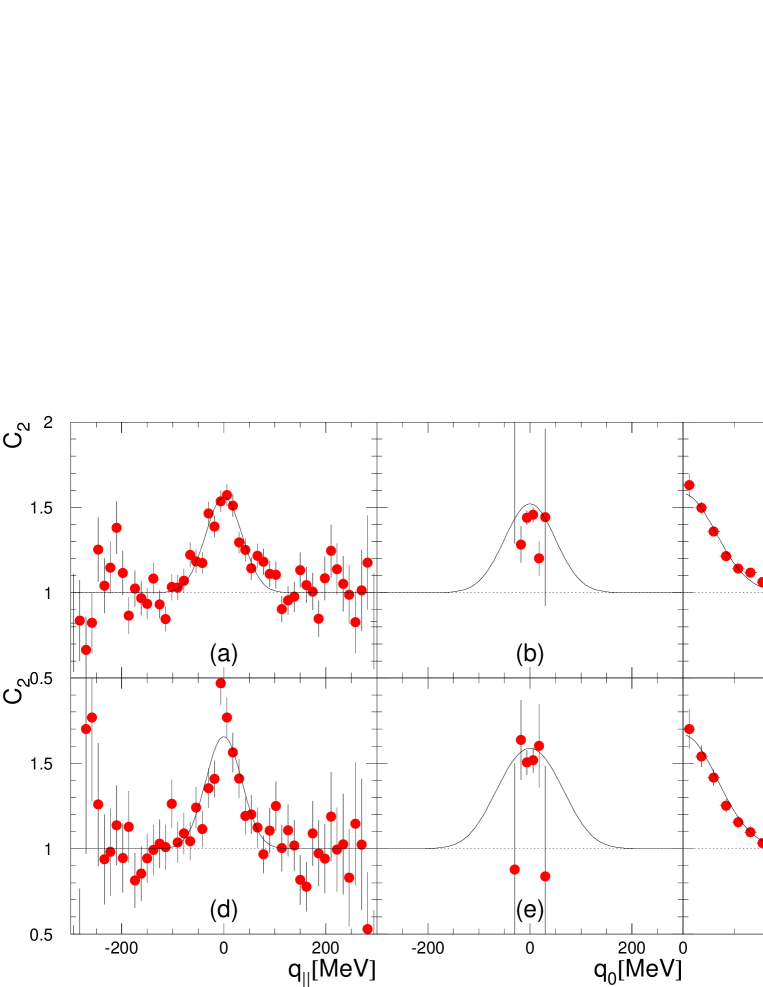
Using Eq. 4 and the fitted parameters one can calculate a Coulomb corrected correlation function from the directly measured raw correlation function :
| (6) |
The result is shown in Fig. 4 as data points and compared to the fitted correlation functions which are depicted by the curves. One observes good agreement.
In addition the kaons from about 2 million semi-central (5% - 20%) events were also analysed and the extracted parameters are listed in Table 2. Both the values of the radius parameters and of the correlation intensity are found to be smaller than for the central collision events, in qualitative agreement with the expected decrease of the radii with the decreasing centrality.
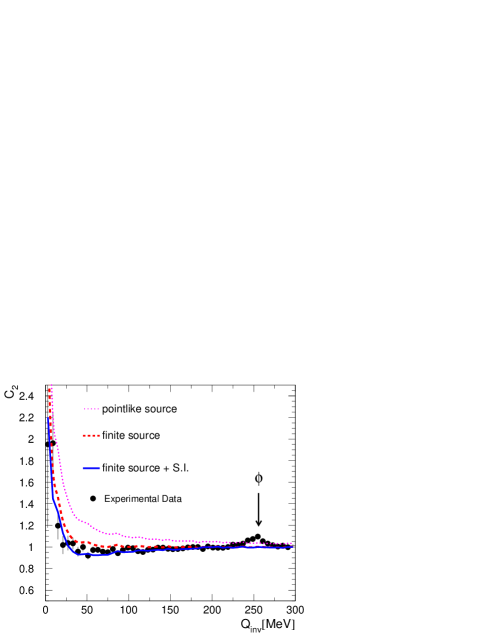
Fig. 5 displays a plot of the correlation function versus for central collision events. The observed correlation is due to the Coulomb attraction as well as the strong interaction of the and [21]. The data points are compared to theoretical calculations for which the effects of momentum resolution and misidentification were taken into account. As demonstrated by the dotted curve, the Gamov factor (appropriate for a point like source) does not describe the data. The finite size Coulomb wave calculation using the fitted radius parameters is shown by the dashed curve. It already provides a much better representation, but still stays somewhat above the data. When also including the contribution from strong interactions (full curve) a good reproduction of the region MeV is obtained. This agreement can be taken as a confirmation of the Coulomb correction procedure used for like-charge kaon correlations.
| YKP | ||||||
| K+ | 0.550.05 | 3.360.38 | 2.960.18 | 3.410.72 | 0.020.02 | 2573/2019 |
| K- | 0.600.06 | 4.070.51 | 3.950.38 | 2.030.82 | 0.010.04 | 1553/1574 |
| BP | ||||||
| K+ | 0.600.03 | 3.350.35 | 3.160.48 | 3.400.26 | 1529/2012 | |
| K- | 0.670.04 | 3.550.50 | 3.360.51 | 3.950.37 | 968/769 |
4 Discussion and Conclusion
From Tables 1 and 2 one observes that the radius parameters for K+ and K- are similar with a trend to somewhat larger values for K-. This is consistent with the expected influence of Coulomb interaction with the positive charge of the reaction zone [22]. The correlation intensity parameter stays below unity. Possible causes are e.g. a partially coherent source, a contribution to the observed kaons from decays of long-lived resonances, or a deviation from the Gaussian parameterization due to a mixture of sources with different radii [25]. The longitudinal source velocities are close to zero in agreement with the fact that our acceptance is restricted to midrapidity (see Fig. 2b).
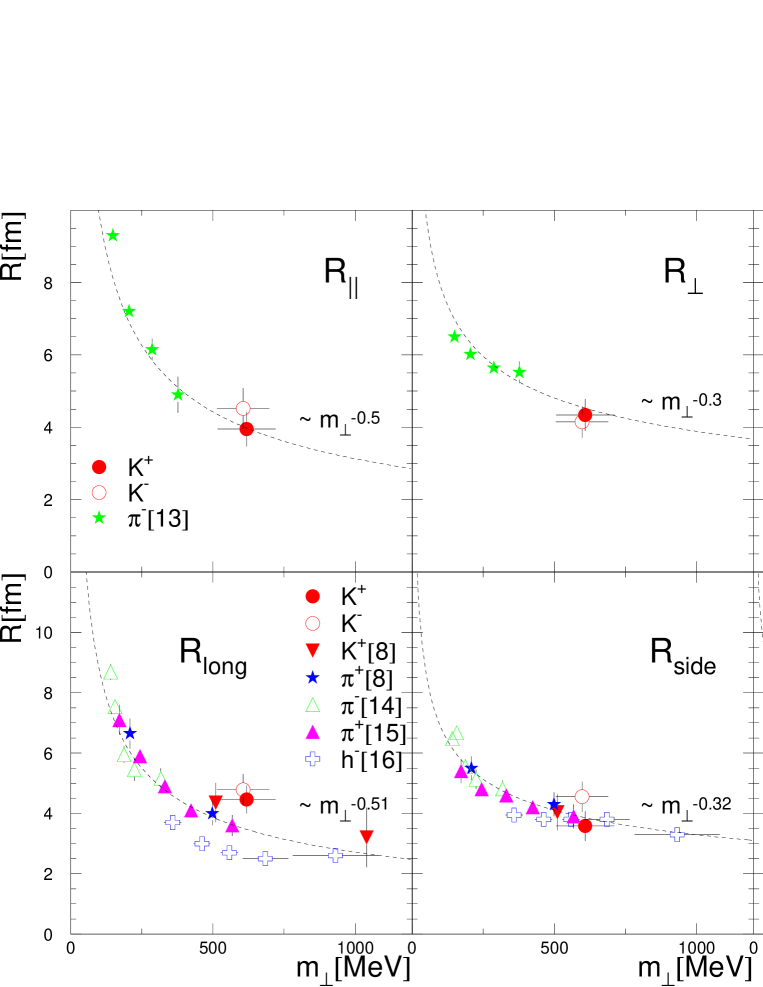
When comparing the radius parameters obtained from kaon correlations with those of pions one has to bear in mind that these parameters depend on the transverse momentum or transverse mass as a consequence of the collective expansion of the source [7]. In Fig. 6 we show the earlier pion data [8, 13, 14, 15, 16] for the same reaction together with the kaon results from Table 1 as well as those from the CERN experiment NA44 [8]. The radii show dependence with for the longitudinal radii (as suggested by Makhlin and Sinyukov [26]) and for the transverse radii.
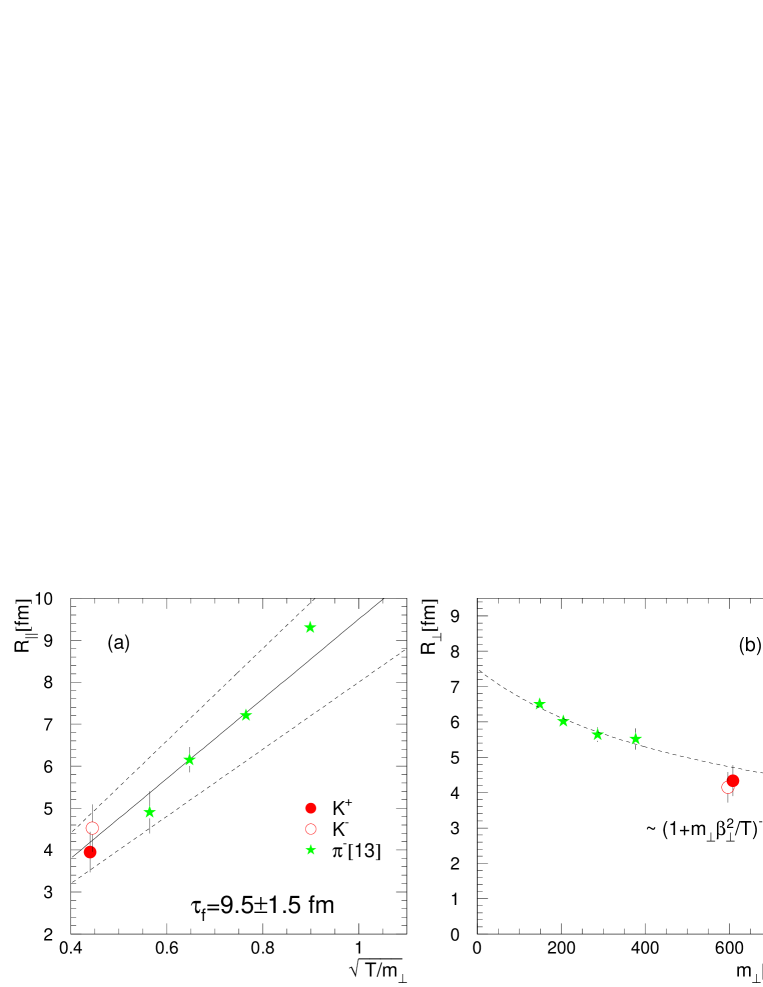
According to the relation :
| (7) |
based on a hydrodynamic expansion model [26], where and are the freeze-out time and temperature of the particles, respectively, the longitudinal radii can be plotted as a function of (Fig. 7a) using the known freeze-out temperature MeV from [13]. From its gradient the freeze-out time is extracted as fm, which is consistent with the previous estimate based on the pion correlation study in [13]. Furthermore, the relatively weak dependence of on can also be reproduced by hydrodynamic expansion models [10, 13] with a transverse expansion velocity around 0.55 (see Fig. 7b).
In conclusion the kaon radius parameters are fully consistent with the published pion results and the hydrodynamic expansion model. The influence of different contributions of resonance formation and different rescattering cross sections seem to be either minor or similar in both cases. Pions and kaons thus seem to decouple simultaneously.
Acknowledgements
Acknowledgements: This work was supported by the Director, Office of Energy Research, Division of Nuclear Physics of the Office of High Energy and Nuclear Physics of the US Department of Energy (DE-ACO3-76SFOOO98 and DE-FG02-91ER40609), the US National Science Foundation, the Bundesministerium fur Bildung und Forschung, Germany, the Alexander von Humboldt Foundation, the UK Engineering and Physical Sciences Research Council, the Polish State Committee for Scientific Research (2 P03B 130 23 and 2 P03B 02418), the Hungarian Scientific Research Foundation (T14920, T32293 and T032648), Hungarian National Science Foundation, OTKA, (F034707), the EC Marie Curie Foundation, and the Polish-German Foundation.
References
- [1] G. Goldhaber, S. Goldhaber, W. Lee and A. Pais, Phys. Rev. 120 (1960) 300
- [2] G.I. Kopylov and M.I. Podgoretsky, Sov. J. Nucl. Phys. 15 (1972) 219 ; ibid. 18 (1973) 336; Sov. Phys. JEPT 42 (1975); G.I. Kopylov, Phys. Lett. 50 (1974) 472; M.I. Podgoretsky, Sov. J. Part. Nucl. 20 (1989) 266
- [3] R. Hanbury-Brown and T. Q. Twiss, Nature 178 (1956) 1046; in honour of Hanbury-Brown and Twiss the GGLP correlations are often called HBT correlations. However, they represent orthogonal measurements [2]
- [4] S. Pratt, Phys. Rev. D33 (1986) 1314
- [5] G. Bertsch et al., Phys. Rev. D37 (1988) 1202
- [6] M. Gyulassy et al., Phys. Rev. C41 (1990) R21
- [7] U. Heinz et al., Heavy Ion Phys. 4 (1996) 249
- [8] I. Bearden et al., NA44 Collaboration, Phys. Rev. Lett 87 (2001) 112301
- [9] S. Afanasiev et al., NA49 Collaboration, Nucl. Instrum. Meth. A430 (1999) 210
- [10] S. Chapman, P. Scotto and U. Heinz, Phys. Rev. C52 (1995) 2694
- [11] M.I. Podgoretsky, Sov. J. Nucl. Phys. 37 (1983) 272
- [12] F. Yano and S. Koonin, Phys. Lett. B78 (1978) 556
- [13] H. Appelshäuser et al., NA49 Collaboration, Eur. Phys. J. C2 (1998) 661
- [14] L. Rosselet et al., WA98 Collaboration, Nucl. Phys. A698 (2002) 647c
- [15] D. Adamova et al., NA45 Collaboration, preprint nucl-ex/0207005 (2002), submitted to Nucl. Phys. A
- [16] F. Antinori et al., WA97 Collaboration, J.Phys. G 27 (2001) 2325
- [17] I.-K. Yoo, Dissertation, University of Marburg (2001) ISBN 3-89703-463-8
- [18] U. Heinz, Nucl. Phys. A610 (1996) 264c
- [19] U. Heinz, B. Tomásik, U. Wiedemann and Wu Y.-F., Phys. Lett. B 382 (1996) 181
- [20] B. Tomásik and U. Heinz, Acta Phys. Slov. 49 No.2 (1999) 251
- [21] Y. M. Sinyukov et al., Phys. Lett. B432 (1998) 248
- [22] G. Baym and P. Braun-Munzinger, Nucl. Phys. A610 (1996) 286c
- [23] T. Alber et al., NA35 Collaboration, Phys. Rev. Lett. 74 (1995) 1303 ; T. Alber et al., NA35 Collaboration, Z. Phys. C66 (1995) 77
- [24] R. Lednicky and V. Lyuboshitz, Sov. J. Nucl. Phys. 35 (1982) 770
- [25] R. Lednicky and M. I. Podgoretsky, Sov. J. Nucl. Phys. 30 (1979) 432
- [26] A. N. Makhlin and Y. M. Sinyukov, Z. Phys. C39 (1988) 69