Measurement of the neutral pion cross section in proton-proton collisions at GeV with PHENIX
Abstract
The inclusive cross section for neutral pion production in the range in has been measured by the PHENIX experiment in proton-proton collisions at . An NLO pQCD calculation is, within the experimental and theoretical uncertainties, consistent with the measurement.
1 Introduction
A detailed understanding of hadron production in proton-proton collisions is essential to both the heavy-ion and spin physics programs at the Relativistic Heavy Ion Collider(RHIC). For the heavy-ion program, proton-proton data provide the reference to which hadron production in heavy-ion collisions can be compared so that novel phenomena, such as jet energy loss or suppression, can be distinguished from the proton-proton results. In the spin physics program, hadron production is a key probe of transverse and longitudinal spin structure functions and thus an understanding of the unpolarized cross section with next-to-leading order(NLO) perturbative QCD calculations provides the theoretical underpinnings for the physics interpretation of the polarized data.
2 Experimental Setup
The PHENIX detector[1][2] consists of two central arm spectrometers, two muon arm spectrometers, and other detectors for triggering. This work used the electromagnetic calorimeters (EMCal) in the central arms, each of which have an azimuthal coverage of and pseudo-rapidity coverage of . This detector consists of 6 lead scintillator sampling calorimeter (PbSc) sectors and 2 lead glass (PbGl) sectors. In this paper, we will report only the measurement done with the 5 PbSc sectors, which have a nominal energy resolution of and a position resolution of .
The data were collected during the proton-proton run in 2001–2002 at RHIC using the minimum bias (MB) and the newly installed EMCal triggers. The MB trigger was made with beam–beam counters (BBC) which covered pesudo-rapidity range from 3.0 to 3.9. The analysis imposed a cut of on the vertex. The EMCal trigger was essential to enhance the sample of neutral pions at high . This trigger consisted of two types: 2x2 non-overwrapping tower sum (0.8 GeV threshold), and 4x4 overwrapping tower sum (2 and 3 GeV thresholds). For higher , this work is based upon the data collected via the 2x2 trigger whose rejection factor was 90.
3 Analysis Procedure
The cross sections for the two trigger samples were computed as the ratio of the yield corrected for efficiency, acceptance, and smearing (,) to the integrated effective luminosity (,) which were computed as:
| Correction Term | Source | Estimate |
|---|---|---|
| Background subtraction | 5% | |
| Hot/Warm towers | 2-3% | |
| Run dependence | 10%(MB) 6%(2x2) | |
| Fast MC statistical error | 1% | |
| Edge towers | 5% | |
| Position resolution | 0-1% | |
| Energy absolute calibration | 3-8% | |
| Energy non-linearity | 0-10% | |
| Energy resolution | 3% | |
| 2x2 high trigger threshold | 10% |
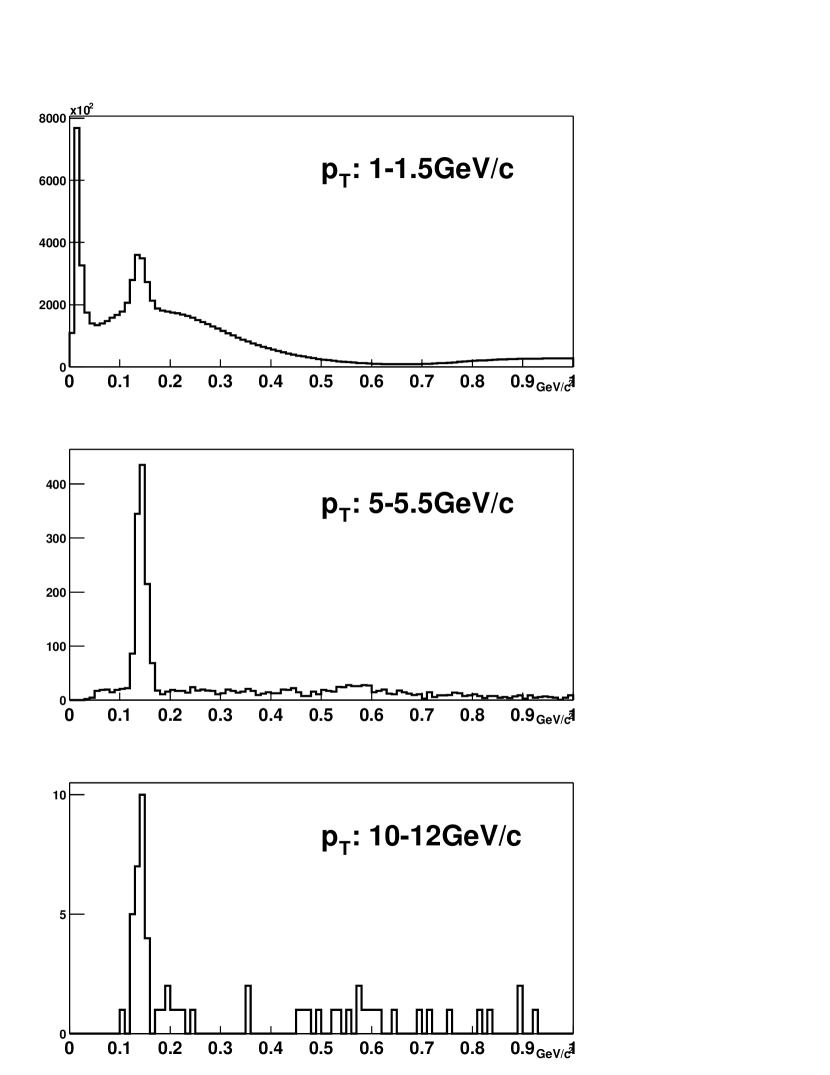
Figure 2 shows sample invariant mass spectra for two photons. Above a of , the ratio of the combinatorial background to the signal was %. To extract the number of [ & ] in each bin, several functions – including a gaussian and some order of polynomial – were used to fit to the combinatorial background over a variety of fit ranges. The systematic error was estimated from the variation in these fits and the run-to-run stability of the yield.
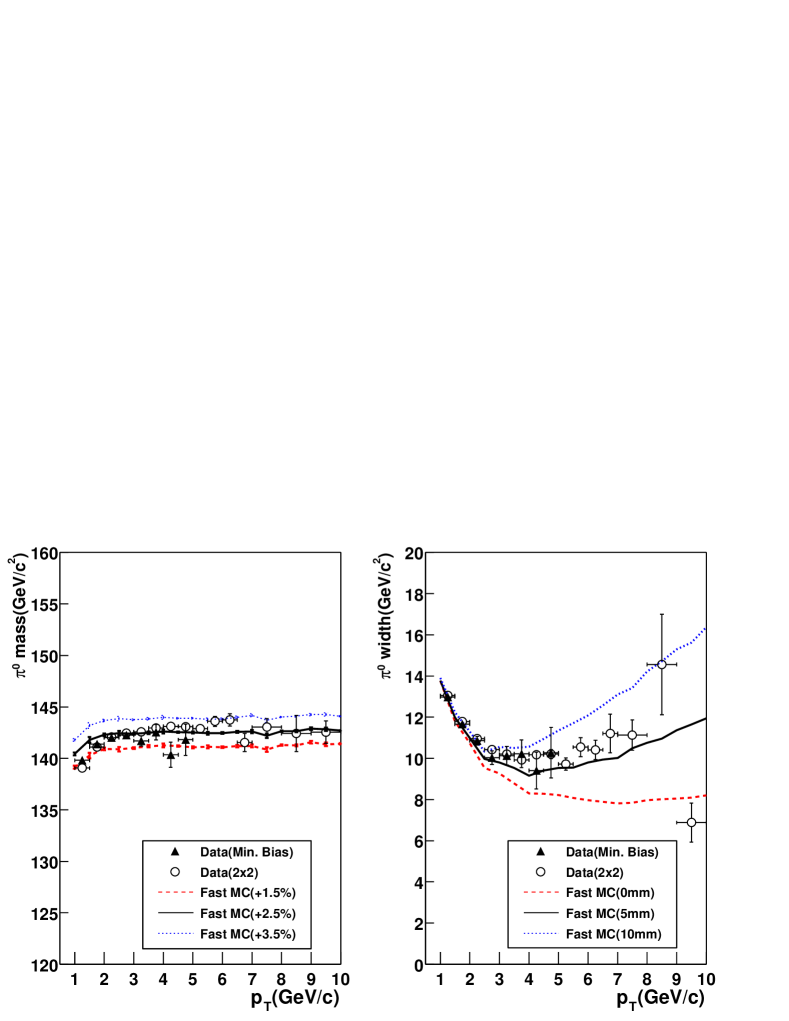
The acceptance, efficiency, and smearing correction [] was obtained by a Monte Carlo simulation which was tuned using results from the test beam measurements and the data itself. Figure 2 compares the measured mass and width against the Monte Carlo simulations with different parameter sets. The systematic error was estimated from the change in the correction factor when the parameters were varied within their errors.
Using the MB data, the efficiency of the 2x2 trigger [] was determined to plateau at 80% above a . A systematic error of 10% was assigned to this quantity by comparing it to the result from a Monte Carlo simulation which included the measured efficiencies for the tiles in the trigger. The bias for detection arising from the MB trigger condition [] was measured to be 75%, independent of up to a using the data sample collected with a 4x4 trigger which, unlike the 2x2 trigger, did not impose the MB requirement. This value was consistent with an estimate from a PYTHIA+GEANT simulation and thus also used to correct the data at higher . All of the systematic errors are summarized in Table 1.
The MB trigger efficiency [] of 51% was obtained from a PYTHIA+GEANT simulation. We assigned a normalization error of 30% based on the difference between the cross section measurement from a van der Meer/vernier scan and the total (elastic+inelastic) cross section.
4 Results and Discussion
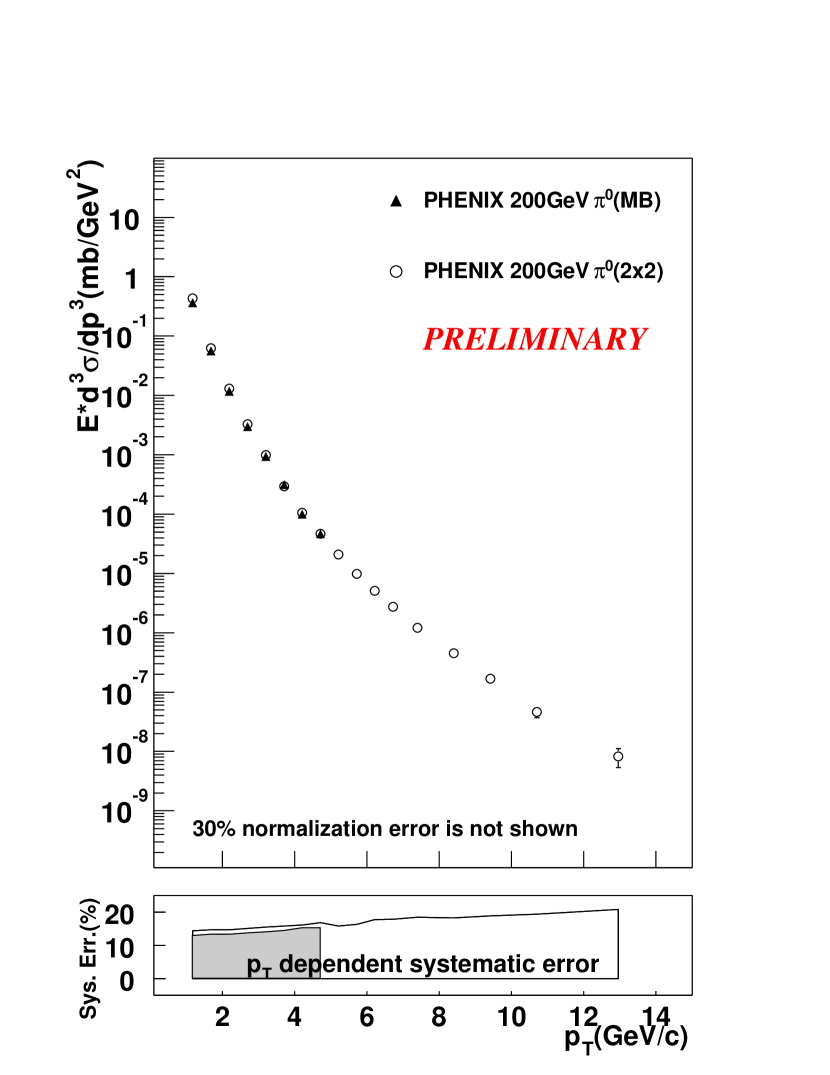
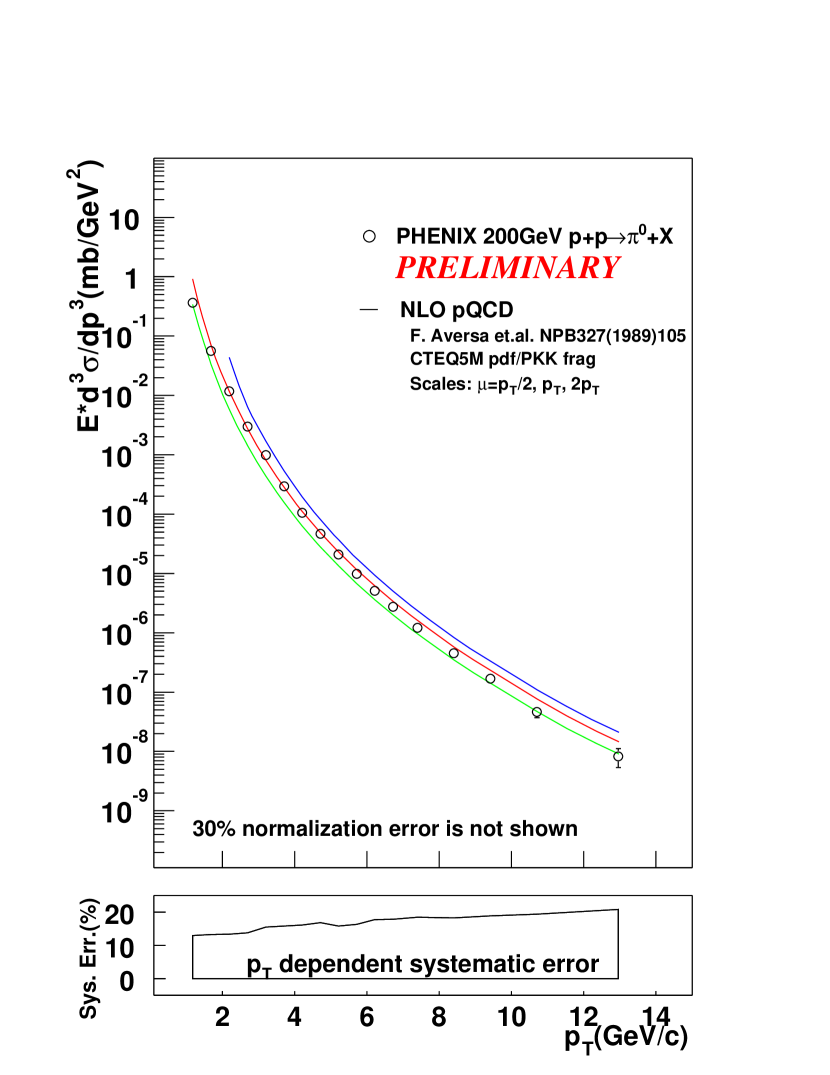
Figure 4 shows the measured cross sections for the MB and the 2x2 trigger samples along with the dependent systematic error. The results from the two samples are consistent within the error. The UA1 collaboration measured the production cross section in the collisions at in the rapidity range[3]. When scaled to our rapidity range and corrected for the particle composition using ISR results[4], our measurement is consistent with the UA1 measurement over their measured range of 1 to 6 GeV/c.
Figure 4 shows a comparison with an NLO pQCD calculation[5] using the formalism of F. Adversa et al.[6] with the CTEQ5M parton distribution functions[7] and the PKK fragmentation functions[8]. The data for the lower range is shown from the MB trigger samples to avoid the larger systematic error of the 2x2 trigger samples. Over the full range, this calculation is consistent with our measurement within the systematic errors.
5 Conclusion
The NLO pQCD calculation with a set of parton distribution and fragmentation function is consistent with our measurement over the full range of 1-13 GeV/c within the systematic error and the scale selection. This measurement provides a baseline for high heavy-ion physics[9].
References
- [1] D. P. Morrison et al., Nucl. Phys. A638 (1998) 565.
- [2] J. T. Mitchell et al., Nucl. Instrum. Meth. A482 (2002) 491.
- [3] C. Albajar et al., Nucl. Phys. B335 (1990) 261.
- [4] B. Alper et al., Nucl. Phys. B100 (1975) 237.
- [5] Private communication with W. Vogelsang.
- [6] F. Aversa, P. Chiappetta, M. Greco and J.-Ph. Guillet, Nucl. Phys. B327, (1989) 105.
- [7] (CTEQ5M) H. L. Lai et al., Eur. Phys. J. C12 (2000) 375.
- [8] B. A. Kniehl, G. Kramer and B. Potter, Nucl. Phys. B582 (2000) 514.
- [9] D. G d’Enterria et al. (PHENIX Coll.), these Proceedings.