Charge Particle Multiplicity and Transverse Energy Measurements in Au-Au collisions in PHENIX at RHIC
Abstract
We present results on charged particle () and transverse energy densities () measured at mid-rapidity in Au-Au collisions at =200 GeV. The mean transverse energy per charged particle is derived. The results are presented as a function of centrality, which is defined by the number of participating nucleons (), and compared to results obtained in Au-Au collisions at =130 GeV. A comparison with calculations from various theoretical models is performed.
1 INTRODUCTION
and are global variables which give excellent characterization of the high energy nucleus-nucleus collisions, thus providing information about the initial conditions [1]. They help to constrain the wide range of theoretical predictions and discriminate among various mechanisms of particle production. measurements also provide one with an opportunity to study high density QCD effects in relativistic nuclear collisions [2].
First results for and at mid-rapidity in Au-Au collisions at GeV measured with the PHENIX detector were published in [3, 4, 5]. The same experimental techniques were used to analyze data obtained at GeV. In order to make a more precise comparison of the results at the two beam energies, both data samples are processed through the same analysis procedure using a more restrictive event selection criteria. The trigger required the coincidence of two beam-beam counters and two zero degree calorimeters. The minimum bias trigger efficiency was found to be the same within 0.7% at GeV and 200 GeV, equal to %. The corrections for the measured and at both GeV and 200 GeV related to particle composition and mean transverse momentum are performed based on PHENIX results obtained at GeV [6, 7], instead of HIJING [8] used in [3, 4, 5].
The part of the PbSc electromagnetic calorimeter used for the measurements covers the pseudorapidity range with an azimuthal aperture of in GeV data and in GeV data. The pad chambers used for measurements have a fiducial aperture of and and in the two data sets respectively.
The results at GeV presented in this paper and published earlier in [3, 4, 5] are consistent within systematic errors (excluding the 4% scale shift in due to its new definition222 In our previous publications [4, 5], was defined using the kinetic energy for nucleons and the total energy for all other particles. This approach does not take into account the mass of nucleons resulting from pair production. In this paper, was defined with for baryons, for antibaryons, and for all other particles, where is the total energy of the particle and is the nucleon mass. The revised definition of increases its value by about 4%, independent of centrality.).
2 RESULTS
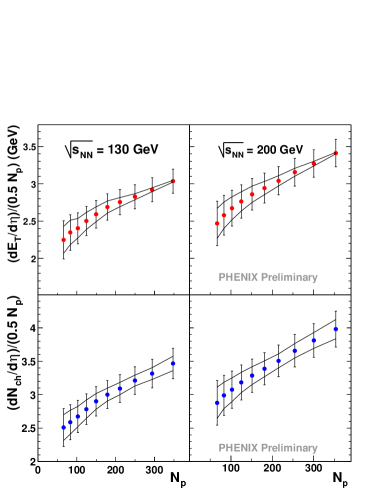
Fig. 1 shows the centrality dependence of and per participant pair measured at GeV and 200 GeV. Both values show a steady rise with .
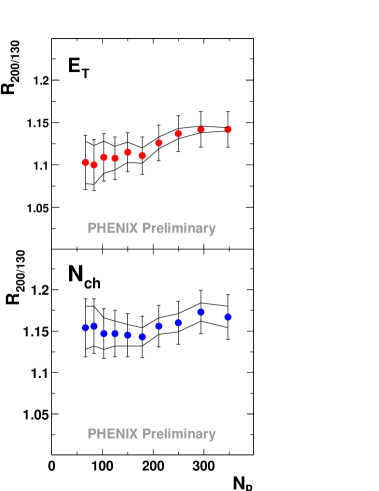
The ratio of the pseudorapidity densities measured at GeV and 200 GeV () for each centrality bin, corresponding to 5% of the nuclear interaction cross section, is shown in Fig. 2. For the most central bin the transverse energy increases by % and the charged particle multiplicity increases by %. The centrality dependence of the ratios is consistent with a constant.
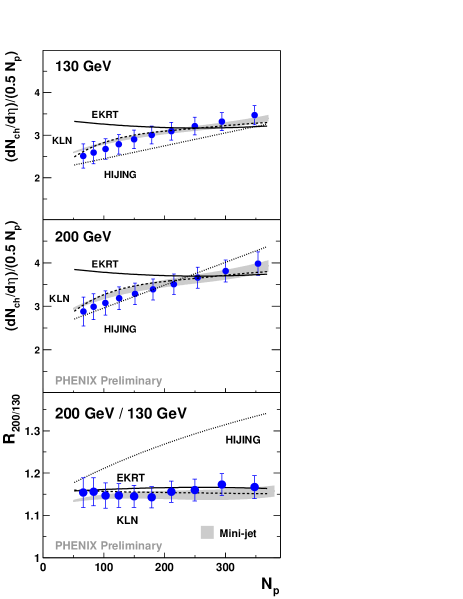
Fig. 3 shows the comparison of our results to different model predictions. A powerful test for theoretical models is the comparison to the measured ratios , since many systematic errors in experimental measurements cancel out. The increase of with centrality is in contrast to the predictions of the EKRT model [9]. HIJING [10] is in qualitative agreement with this scenario, however the strong centrality dependence of the ratio predicted by HIJING is excluded by the data. Our experimental results are well described by high energy QCD gluon saturation [2] and two-component mini-jet model [11] calculations.
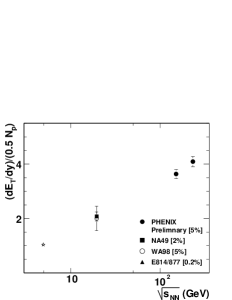
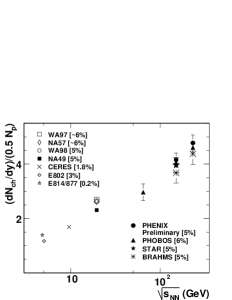
Rapidity densities per pair of participants obtained in different experiments are shown in Fig. 4. The data are measured in the center-of-mass system for the RHIC experiments (BRAHMS, PHENIX, PHOBOS and STAR) or the laboratory system for all other experiments. It is assumed that in the laboratory system ( stands for or ), and a factor of derived from the HIJING generator was applied to account for the transformation in the center-of-mass system. All RHIC results are in good agreement. The data points for and are consistent with a logarithmic rise with over a broad range of collision energies.
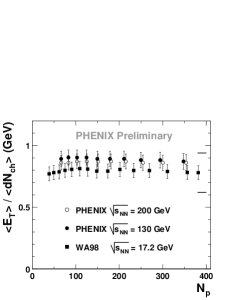
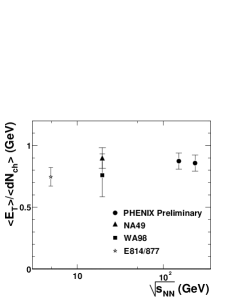
and behave in a very similar manner such that the mean per charged particle remains unchanged over a broad range of centralities (see Fig. 5, left). The same behaviour of with centrality was observed by the WA98 Collaboration at GeV [16]. The ratio stays almost unchanged also as a function of (see Fig. 5, right).
References
- [1] S.A. Bass et al., Nucl. Phys. A661, 205 (1999).
- [2] D. Kharzeev and M. Nardi, Phys. Lett. B507, 121 (2001); D. Kharzeev and E. Levin, Phys. Lett. B523, 79 (2001).
- [3] K. Adcox et al., Phys. Rev. Lett. 86, 3500 (2001).
- [4] K. Adcox et al., Phys. Rev. Lett. 87, 052301 (2001).
- [5] A. Milov, Nucl. Phys. A698, 171 (2002).
- [6] K. Adcox et al., Phys. Rev. Lett. 88, 242301 (2002).
- [7] K. Adcox et al., Phys. Rev. Lett. 89, 092302 (2002).
- [8] X.N. Wang and M.Gyulassy, Phys. Rev. D44, 3501 (1991). We used version 1.35 with default parameters.
- [9] K.J. Eskola et al., Nucl. Phys. B570, 379 (2000); Phys. Lett. B497, 39 (2001).
- [10] X.N. Wang and M.Gyulassy, Phys. Rev. Lett. 86, 3498 (2001).
- [11] S. Lee and X.N. Wang, Phys. Lett. B527, 85 (2002).
- [12] B.B. Back et al., Phys. Rev. Lett. 85, 3100 (2000); Phys. Rev. C65, 061901 (2002).
- [13] I.G. Bearden et al., Phys. Lett. B523, 227 (2001); Phys. Rev. Lett. 88, 202301 (2002).
- [14] C. Adler et al., Phys. Rev. Lett. 87, 112303 (2001).
- [15] F. Antinori et al., Nucl. Phys. A661 357 (1999).
- [16] M.M. Aggarval et al., Eur. Phys. J. C18, 651 (2001).
- [17] J. Bächler et al., Nucl. Phys. A661, 45 (1999); T. Alber et al., Phys. Rev. Lett. 75, 3814 (1995).
- [18] D. Miskowiec, Proc. of the 30th Int. Workshop on Gross Properties of Nuclei and Nuclear Excitation: Ultrarelativistic Heavy Ion Collisions, GSI, Darmstadt, 2002, pp 238-247.
- [19] L. Ahle et al., Phys. Rev. C59, 2173 (1999).
- [20] J. Barrette et al., Phys. Rev. C51, 3309 (1995); Phys. Rev. Lett. 70, 2996 (1993).