Results on Correlations and Fluctuations from NA49
Abstract
The large acceptance and high momentum resolution as well as the significant particle identification capabilities of the NA49 experiment[1] at the CERN SPS allow for a broad study of fluctuations and correlations in hadronic interactions.
In the first part recent results on event-by-event charge and fluctuations are presented. Charge fluctuations in central Pb+Pb reactions are investigated at three different beam energies (40, 80, and 158 GeV), while for the fluctuations the focus is put on the system size dependence at 158 GeV.
In the second part recent results on Bose Einstein correlations of pairs in minimum bias Pb+Pb reactions at 40 and 158 GeV, as well as of K+K+ and K-K- pairs in central Pb+Pb collisions at 158 GeV are shown. Additionally, other types of two particle correlations, namely p, p, and correlations, have been measured by the NA49 experiment. Finally, results on the energy and system size dependence of deuteron coalescence are discussed.
1 Fluctuations
1.1 Charge fluctuations
It has been suggested that charge fluctuations might be sensitive to the presence of a quark qluon plasma phase [2, 3]. A suitable observable, however, must take into account the effect of impact parameter fluctuations, acceptance effects, the total net charge of the reaction system, and charge conservation. For this purpose a generalized measure [4] can be employed:
| (1) |
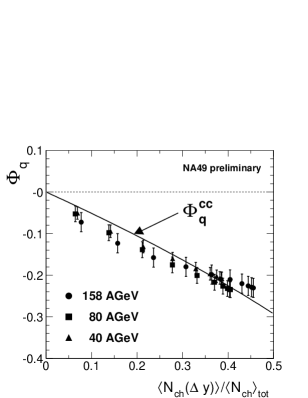
Here is the event multiplicity, while is the quantity to be studied. The overline denotes the average over a single particle inclusive distribution, whereas means the average over all events. In the case of charge fluctuations, is chosen as the electric charge of a particle [5]. can vary between two extreme cases: For independent particle emission is equal to 0, while local charge conservation would imply . Figure 2 shows the measured values in central Pb+Pb reactions11140 and 80 GeV: 7% most central, 158 GeV: 10% most central at 40, 80, and 158 GeV beam energy. depends strongly on the ratio of accepted charged particles to the total number of charged particles , which is varied by changing the accepted rapidity window . However, it is approximately independent of the beam energy. The solid line in Fig. 2 labelled represents the expectation for a system with total net charge zero, in which the only correlations are due to global charge conservation.
| (2) |
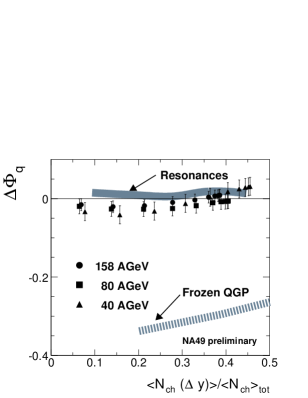
In order to enlarge any deviations from this trivial effect, the difference is displayed in Fig. 2. It is found that is close to zero.
To study the sensitivity of the measure a model, describing a quark gluon plasma, was investigated [5]. This model assumes an ideal gas of massless quarks and gluons in equilibrium with zero baryonic chemical potential (). The requirement of entropy and local charge conservation during hadronization allows to extract predictions for in different scenarios. Fig. 2 includes two extreme cases: The one labelled “Frozen QGP” assumes hadronization only into pions and no diffusion of the net charge in rapidity space, so that the initial QGP-like fluctuations are conserved. In fact, this results in values clearly below zero. In the other scenario (“Resonances”) hadronization is happening entirely into -mesons. It turns out that in this case the initial fluctuations are completely obscured by the subsequent decay of the resonances, which cause a smearing of the original QGP fluctuations in rapidity space.
1.2 fluctuations
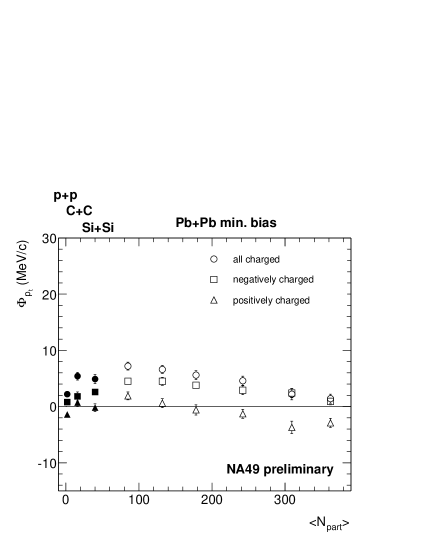
For the study of event-by-event fluctuations again the observable, defined in Eq. 1, is used. This time, however, is replaced by the of a given particle. Independent particle emission will again result in . The values, shown in Fig. 3, are all corrected for the effects of the two track resolution of the detector. Generally, it is found that is small for all investigated reaction systems: . A weak centrality dependence is observable, with a maximum in for very peripheral Pb+Pb collisions. Also, is clearly charge dependent: is always larger for negatively charged particles than for positively charged. This may be a reflection of the fact that the positively charged particles contain a larger fraction of baryons, which are subject to Fermi-Dirac statistics, while the negatively charged particles are dominated by bosons [6]. However, for all charged particles is still higher than for the negatively charged ones, indicating that there are additional correlations present.

Since is a global observable, a small value of does not neccessarily imply the absence of any strong correlation. It is also possible that contributions of two effects just cancel out each other. Looking at two particle correlations provides a more differential way of studying fluctuations [7]. In the procedure employed here, first the of a given particle is transformed into a cumulative variable [8]:
| (3) |
Then two particle correlation plots are generated by plotting versus for all particle pairs inside one event. Figure 4 shows the result for different reactions systems at 158 GeV. While there is a clear structure visible in p+p reactions, reflecting the long range correlations present in this case, these structures get more and more diluted when going to larger systems. On one side this is naturally due to the effect of the increased combinatorics between the growing number of particle pairs, an effect that is removed by the measure. On the other side differences in the reaction dynamics between elementary p+p and nucleus-nucleus collisions will show up in the two particle correlations. The relation between and the two particle correlations is still under study.
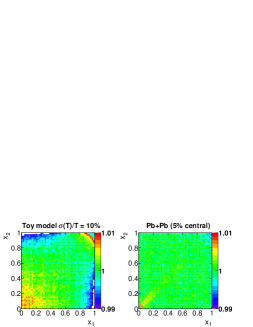
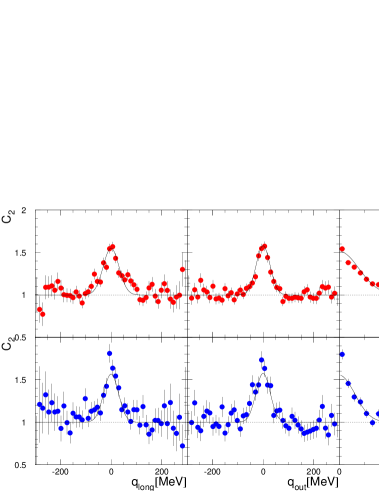
To see how dynamical fluctuations affect the two particle correlations, a model study is performed. In this model the only source of fluctuations are the event-by-event fluctuations of the slope parameter of the transverse momentum spectra. As can be seen on the left panel of Fig. 5, fluctuations of the order of 10% already result in a very prominent structure in the two particle correlation. A structure on this level is clearly absent in the central Pb+Pb data (right panel of Fig. 5). Here only short range correlations (e.g. Bose Einstein correlations) are visible as an enhancement close to the diagonal. A comparison of the measured in the 5% most central Pb+Pb reactions at 158 GeV to a prediction for small fluctuations [9] actually suggests that is smaller than 1%.
2 Correlations
2.1 Centrality dependence of h-h- Bose Einstein correlations
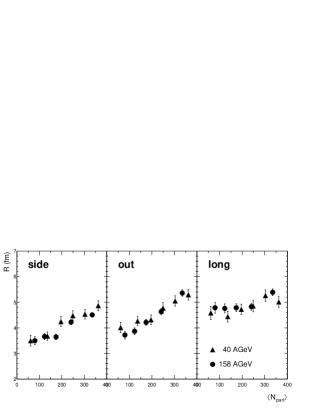
The radius parameters shown in Fig. 6 are derived from the fit of the Bertsch-Pratt parametrization in the LCMS222Longitudinally Co-Moving System.
| (4) |
to the h-h- correlation function (c.f.). The Coulomb correction is included in the fit procedure, and is applied only to the fraction of real pairs in the c.f. For both beam energies the pairs are in the c.m. rapidity region with . The radius parameters in side and out direction show a significant increase with the system size. , however, shows no clear evidence for a variation with , except perhaps for very central reactions. The results at 40 and 158 GeV are very similar.
2.2 Kaon Bose Einstein correlations in central Pb+Pb reactions
| K+ (NA49) | K- (NA49) | K+ (NA44) [10] | |
|---|---|---|---|
| (GeV) | 0.62 | 0.61 | 0.51 |
| (fm) | |||
| (fm) | |||
| (fm) |
Figure 7 shows the c.f. of charged kaons together with the applied fit of the Bertsch Pratt parametrization. The data points are corrected for the Coulomb interaction and the momentum resolution.
The table summarizes the values of the radius parameters together with statistical and systematical errors. Also included are published results from the NA44 collaboration [10] on K+ correlations that agree quite well with our measurement.
2.3 Other two particle correlations
Apart from the effect of quantum statistics, the c.f. reflects also the influence of the final state interaction. This can be exploited to gain useful information from correlations between non identical particles. Results on p correlations allow to study relative space time asymmetries [11], and p correlation give access to the source size [12]. Additionally, one can use the c.f. as a tool to learn about the two particle interaction in cases where it is unknown, like in the case [13]. The above correlations are studied in the variable:
| with | (5) |
2.3.1 p correlations
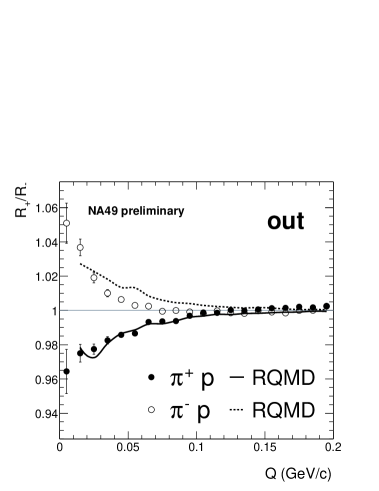
Since the relative wave function of pairs of non identical particles contains odd terms in , where are the emission points in the pair c.m., relative space time asymmetries should become visible in the ratio . Here, is the c.f. containing all pairs with , while consists of pairs with , where the out-direction is defined in the LCMS. As can be seen from Fig. 8 a clear asymmetry is observed in the data, which goes into opposite directions for p and p pairs. This mirror symmetry is caused by the fact that the aymmetry in is effected mainly by the Coulomb interaction, which introduces a dependence on the charge sign. Additionally, Fig. 8 includes the result from a RQMD simulation. Due to its long range character the Coulomb interaction is very sensitive to the tails in the spatial distribution of the source. The simulated emission points have been scaled by a factor of 0.8 in accordance with the analysis of and p correlation functions.
2.3.2 p correlations
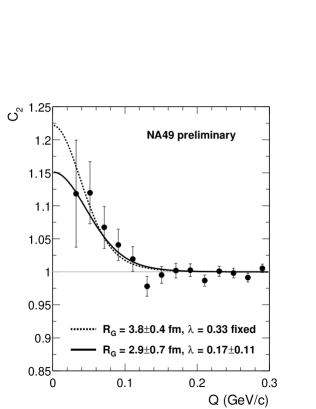
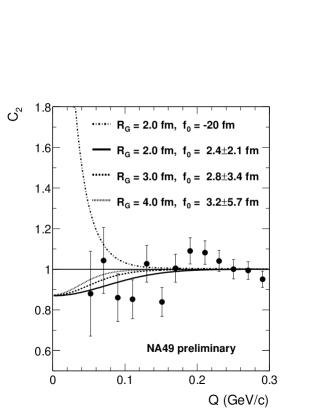
Figure 10 shows the measured c.f., containing 60k pairs with , together with theoretical c.f. fitted to the data. The calculation is based on an effective range approximation, using a s-wave scattering length of -2.3 fm (singlet) / -1.8 fm (triplet) [14]. The Gaussian source is assumed to be spherically symmetric and static, and is defined by the parameter . Figure 10 includes two different fits. In the first and the parameter can vary freely. In the second is fixed to a value that is estimated from the background of particle misidentification and the contribution from feed down. Both fits suggest a Gaussian source size of = 3 - 4 fm, which is compatible with the NA49 result on pp correlations () [15].
2.3.3 correlations
The significance of the measured c.f., shown in Fig. 10, is unfortunately limited by low statistics (3500 pairs with ) and does not show any clear structure. Nevertheless, it is worthwhile to do a comparison to theoretical expectations, in an attempt to limit the range of possible parameter values. Therefore, a fit is performed where and are now fixed and the scattering length , describing the strengh of the interaction, is varied. The result indicates that the c.f. would favour a relatively small , quite independent from the assumed source size. As a comparison a calculation with = -20 fm is also shown, which would correspond to the scattering length in the nucleon-nucleon case, and which looks rathers unlikely, although is is not totally ruled out.
2.4 Deuteron coalescence
From the measurement of proton and deuteron spectra (all at mid-rapidity for central reactions33340 and 80 GeV: 7% most central, 158 GeV: 5% most central), a deuteron coalescence factor can be derived:
| (6) |
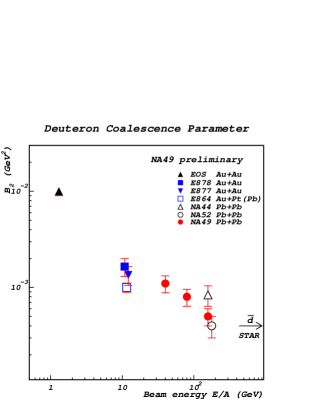
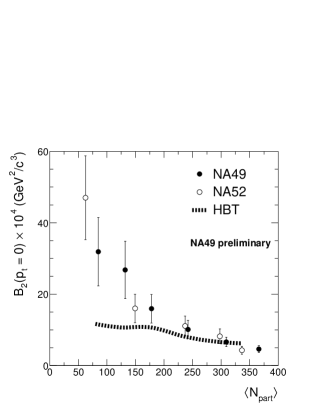
Figure 12 displays the extracted for different beam energies, also including data from the AGS and other CERN SPS experiments. decreases significantly with increasing beam energy. Even in the SPS energy range, taken alone, there is a change by a factor of 2. is also strongly dependent on the system size, as is illustrated in Fig. 12. Going from very peripheral to central reactions, it decreases by a factor of almost 10. This is in contrast to the centrality dependence of the radii from Bose Einstein correlations (see Fig. 6), which can be related to via [16]:
| with | (7) |
As is demonstrated in Fig. 12 the derived from the HBT volume changes much less with the centrality than the measured deuteron coalescence parameter.
Acknowledgements: This work was supported by the Director, Office of Energy Research, Division of Nuclear Physics of the Office of High Energy and Nuclear Physics of the US Department of Energy (DE-ACO3-76SFOOO98 and DE-FG02-91ER40609), the US National Science Foundation, the Bundesministerium fur Bildung und Forschung, Germany, the Alexander von Humboldt Foundation, the UK Engineering and Physical Sciences Research Council, the Polish State Committee for Scientific Research (2 P03B 130 23 and 2 P03B 02418), the Hungarian Scientific Research Foundation (T14920 and T32293), Hungarian National Science Foundation, OTKA, (F034707), the EC Marie Curie Foundation, and the Polish-German Foundation.
References
- [1] S. Afanasiev et al., Nucl. Instrum. Meth. A430 (1999), 210.
- [2] M. Asakawa, U. Heinz, and B. Müller, Phys. Rev. Lett. 85 (2000), 2072.
- [3] S. Jeon and V. Koch, Phys. Rev. Lett. 85 (2000), 2076.
-
[4]
M. Gaździcki and S. Mrówczyński, Z. Phys. C54 (1992), 127.
M. Gaździcki, Eur. Phys. J. C8 (1999), 131. - [5] J. Zaranek, hep-ph/0111228, to appear in Phys. Rev. C.
- [6] S. Mrówczyński, Phys. Lett. B439 (1998), 6.
- [7] T. Trainor, hep-ph/0001148.
- [8] A. Białas, M. Gaździcki, Phys. Lett. B252 (1990), 483.
- [9] R. Korus, S. Mrówczyński, M. Rybczyński, and Z. Włodarczyk, Phys. Rev. C64 (2001), 054908.
- [10] I. G. Bearden et al., Phys. Rev. Lett. 87 (2001), 112301.
- [11] R. Lednický, V. L. Lyuboshitz, B. Erazmus, and D. Nouais, Phys. Lett. B373 (1996), 30.
- [12] F. Wang and S. Pratt, Phys. Rev. Lett. 83 (1999), 3138.
- [13] C. Greiner and B. Müller, Phys. Lett. B219 (1989), 199.
- [14] R. Lednický and V. L. Lyuboshitz, Sov. J. Nucl. Phys. 35 (1982), 770.
- [15] H. Appelshäuser et al., Phys. Lett. B467 (1999), 21.
- [16] W. Llope et al., Phys. Rev. C52 (1995), 2004.