Azimuthal anisotropy of and production at mid-rapidity from Au+Au collisions at GeV
Abstract
We report STAR results on the azimuthal anisotropy parameter for strange particles and at mid-rapidity in Au+Au collisions at GeV at RHIC. The value of as a function of transverse momentum and collision centrality is presented for both particles and compared with model calculations. A strong dependence in is observed up to GeV/c where begins to saturate.
1 Introduction
Measurements of azimuthal anisotropies in the transverse momentum distributions of particles probe early stages of ultra-relativistic heavy-ion collisions Sorge (1999, 1997); Ollitrault (1992). After an initial geometric anisotropy is established in an off-center or non-central collision, rescattering in the overlapping region of the colliding nuclei amongst collision participants transfers the spatial anisotropy into an anisotropy in momentum space. The extent of the transformation depends on the initial conditions and the dynamical evolution of the collision. As a result, anisotropy measurements for nucleus-nucleus collisions at RHIC energies may increase our understanding of the processes governing the evolution of the collision system and in particular, may provide information about an early partonic stage in the evolution of the system Sorge (1999); Zhang et al. (1999); Huovinen et al. (2001); Gyulassy et al. (2001); Teaney et al. (2001); Lin and Ko (2002).
For the purpose of studying azimuthal anisotropies it is advantageous to write the triple differential distribution of particles in the form of a Fourier series
| (1) |
where is the transverse momentum of the particle, is its rapadity and denotes its azimuthal angle of emmision with respect to the true reaction plane angle111The reaction plane is the plane defined by the beam line and the line connecting the centers of the colliding nuclei. Voloshin and Zhang (1996); Poskanzer and Voloshin (1998). The harmonic coefficients are anisotropy parameters and the second coefficient is called the elliptic flow parameter. Recent experimental results from RHIC Ackermann et al. (2001); Adler et al. (2001a); Lacey (2002); Park et al. (2002) include measurements of as a function of collision centrality and for charged particles up to a of about 2.0 GeV/c, and for identified , and up to a of about 0.8 GeV/c.
We report on the first measurement of the azimuthal anisotropy parameter , as a function of and collision centrality, for the strange particles and from minimum bias Au + Au collisions at GeV. Our measurements of for identified particles using the Solenoidal Tracker At RHIC (STAR) are the first to extend beyond the range where particles are identified by their specific energy loss (dE/dx) in the gas of the Time Projection Chamber (TPC), and up to GeV/c. Previously in this higher range had only been measured for unidentified charged particles Snellings (2002).
2 Analysis
The STAR detector Ackermann et al. (1999), due to its azimuthal symmetry and large acceptance, is ideally suited for measuring elliptic flow. For collisions in its center, the STAR TPC measures the tracks of charged particles in the pseudo-rapidity range with azimuthal coverage. A scintillator barrel, the Central Trigger Barrel (CTB), surrounding the TPC that measures the charged particle multiplicity within was used for a central trigger. Two Zero-Degree Calorimeters Adler et al. (2001b) at both ends of the TPC in coincidence provided a minimum bias trigger.
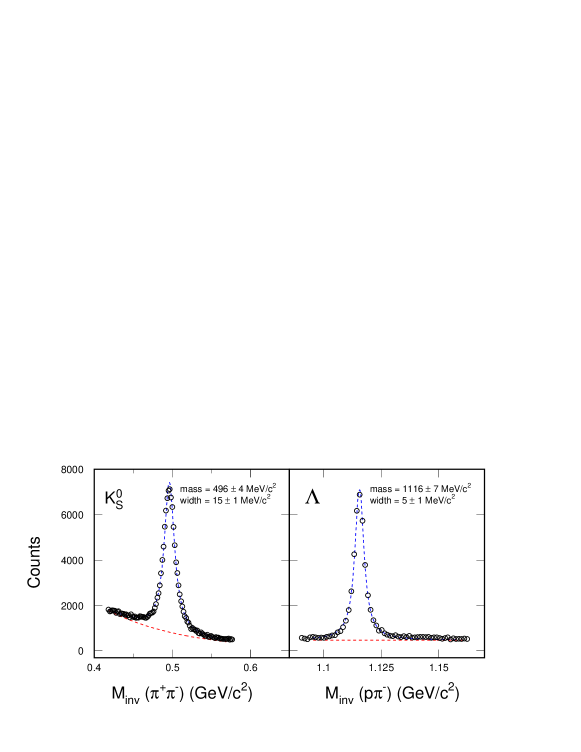
The masses and kinematic properties of both and , are reconstructed via their decay topologies in the TPC Wieman et al. (1997); Betts et al. (1997); Klein et al. (1996). Figure 1 shows the invariant mass distributions for a mass hypothesis and a hypothesis. The background is dominated by combinatoric counts and the observed masses, MeV/ and MeV/, are consistent with values listed in the PDG Groom et al. (2000) for and respectively. The and particles used in the analysis are from the kinematic region of GeV/c and . To compensate for limited statistics, and are summed together. To reduce the combinatoric background, for , pion-like tracks are required to have a distance of closest approach dca cm, while for , the pion-like tracks have a dca cm and the proton-like tracks have a dca cm. Tracks are determined to be either proton-like or pion-like based on their energy loss (dE/dx) in the TPC gas. The yield from the enhancement in the invariant mass peaks in each , bin is used to evaluate as a function of . This method enables us to measure identified particle flow beyond the range where dE/dx particle identification fails.
The event plane, an experimental estimator of the true reaction plane Poskanzer and Voloshin (1998), is calculated from the azimuthal distribution of tracks using cuts similar to those used in reference Ackermann et al. (2001). To avoid auto-correlations, only tracks excluded from the neutral vertex reconstruction are used in the event plane calculation. The observed is corrected to account for the imperfect event plane resolution estimated using the method of subevents described previously Poskanzer and Voloshin (1998). The maximum resolution correction factor for the and analysis is found to be and respectively and is reached in the centrality corresponding to 25 – 35% of the measured cross section, where the relative multiplicity distribution is used to estimate the event centrality as in reference Ackermann et al. (2001).
For this analysis, three sources contribute to systematic errors in the measured anisotropy parameters: (1) particle identification; (2) background subtraction; (3) non-reaction plane related correlations contributing to such as resonance decays or Coulomb and Bose-Einstein correlations Dinh et al. (2000); Borghini et al. (2000). The first two sources are estimated by examining the variation in after changing several track, event and neutral vertex cuts and are found to contribute an error of less than 0.005 to . A previous study used the correlation of event plane angles from subevents to estimate the magnitude of non-reaction plane related correlations Adler et al. (2001a). That analysis showed that these effects which always act to increase the measured value of above its true value typically contribute a systematic error to of -0.005, but that the magnitude is larger in the more peripheral events where the error increases to about -0.035 for the centrality corresponding to 58 – 85% of the measured cross section.
3 Results
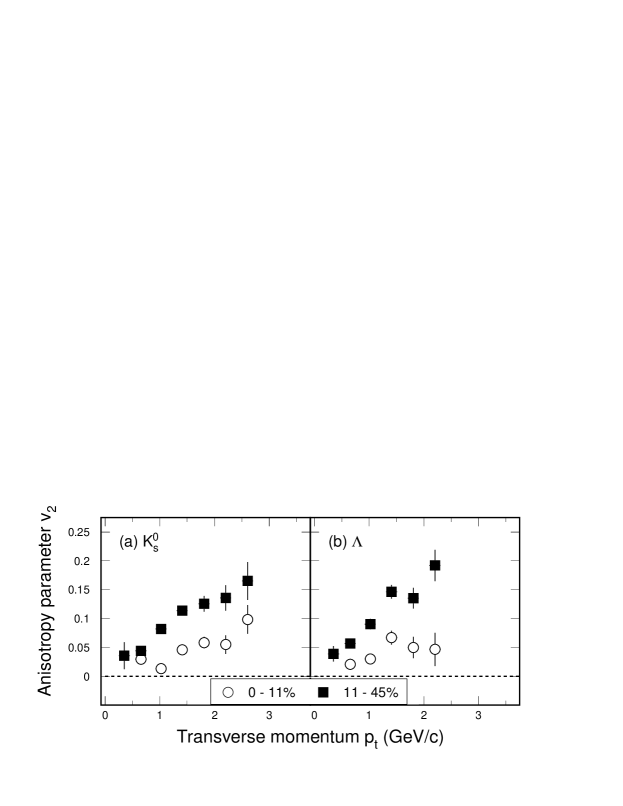
The centrality dependence of as a function of transverse momentum calculated from 201 thousand minimum bias and 180 thousand central events is shown in figure 2. The two particles show a similar dependence in the respective centralities with more flow in the more peripheral collisions. This is similar to observations made previously at the same energy Adler et al. (2001a) where the agreement with hydrodynamic calculations in the lower region was interpreted as evidence for early local thermal equilibrium in all but the most peripheral events (45 – 85% of the measured cross section).
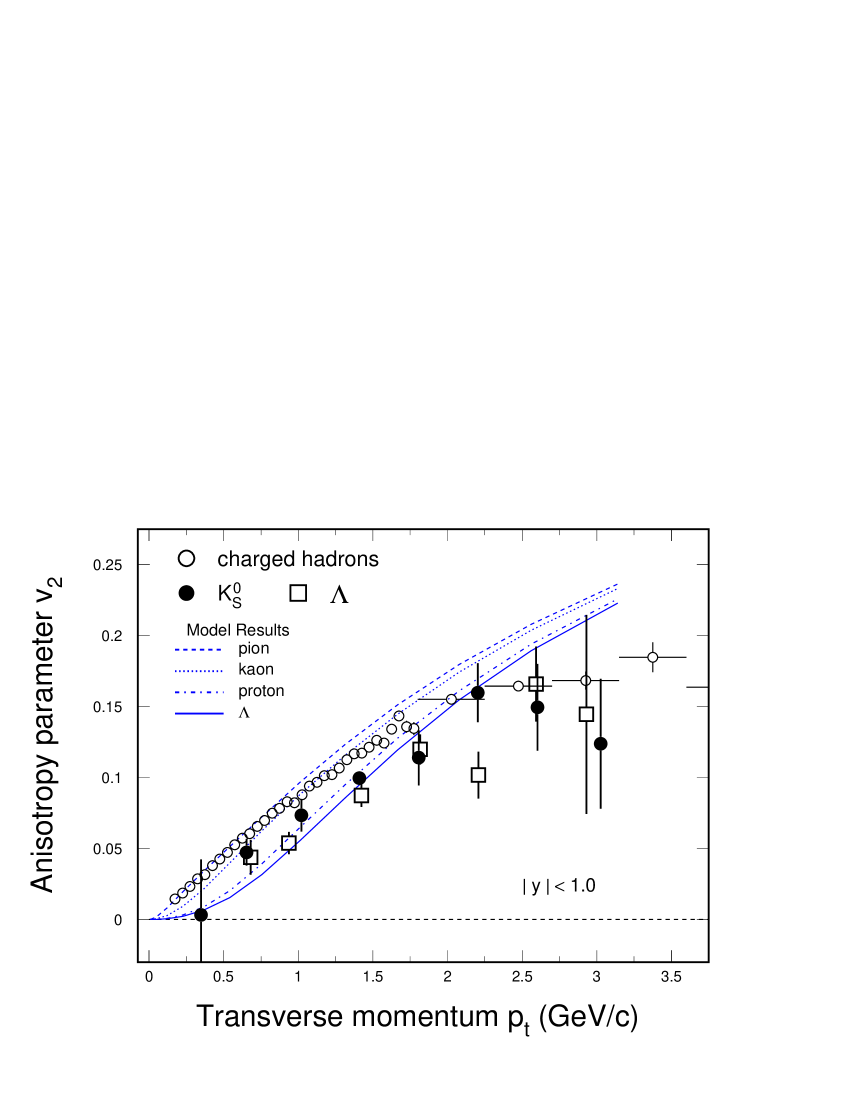
In figure 3 (left) we plot for and from minimum bias collisions with results from hydrodynamic model calculations Huovinen et al. (2001) and for negatively charged particles Snellings (2002). The results are in agreement with the for in the range they share ( MeV/c) Adler et al. (2001a). We observe that for both strange particles increases as a function of similar to the hydrodynamic model prediction, up to about 1.5 GeV/c. In the higher region however ( GeV/c), the values of seem to be saturated. It has been suggested Gyulassy et al. (2001) that the shape and height of above 2 – 3 GeV/c is related to energy loss in an early, high parton-density stage of the evolution.
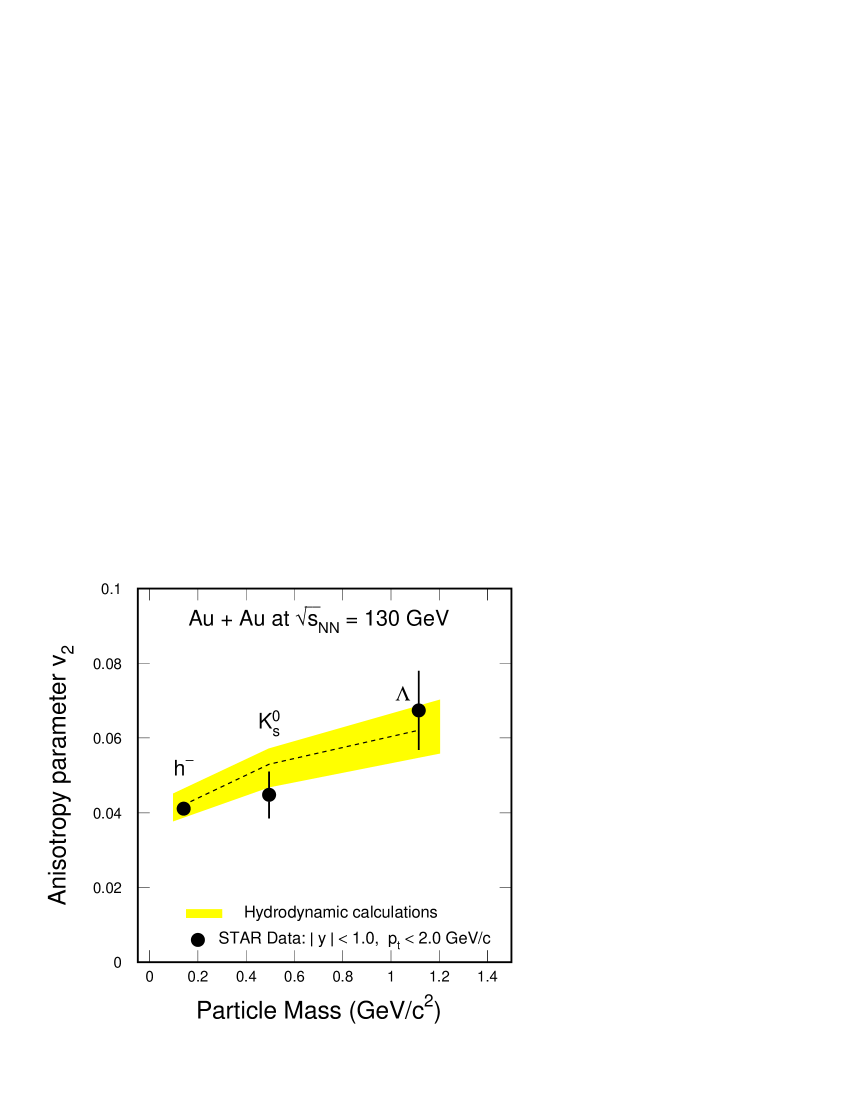
The integrated from minimum bias collisions for , and negatively charged particles are shown in figure 3 (right). The integrated values of are calculated by parameterizing the yield with the inverse slope parameter of exponential fits to the or transverse mass distributions and are dominated by the region near the particles mean . The relatively larger of reflects the higher mean of the compared to the . Hydrodynamic model calculations Huovinen et al. (2001), shown as a gray-band and central line, are, within errors, in agreement with this result. The width of the gray-band indicates the uncertainty of the model calculation, mostly due to the choice of the freeze-out conditions. The increase of with particle mass in figure 3 points to a significant commonality in velocities between particles of different masses that is perhaps, established early in the collision. The nature of the particles during this process however, whether parton or hadron, and the degree of thermalization remains unclear.
4 Summary
We have reported the first measurement of for and from Au + Au collisions at GeV and the first measurement, at this energy, of above GeV/c for any identified particle. For both particles more flow is seen in mid-central than in central collisions. The integrated values of show a mass dependence consistent with the development of a common velocity, a feature of hydrodynamic models, where local thermalization is assumed. In however, we see a strong dependence only up to 2.0 GeV/c where seems to saturate, suggesting that the hydrodynamic picture is incomplete for particle production above 1.5 – 2.0 GeV/c.
References
- Sorge (1999) Sorge, H., Phys. Rev. Lett., 82, 2048–2051 (1999).
- Sorge (1997) Sorge, H., Phys. Lett., B82, 251–256 (1997).
- Ollitrault (1992) Ollitrault, J.-Y., Phys. Rev., D46, 229–245 (1992).
- Zhang et al. (1999) Zhang, B., Gyulassy, M., and Ko, C. M., Phys. Lett., B455, 45–48 (1999).
- Huovinen et al. (2001) Huovinen, P., Kolb, P. F., Heinz, U. W., Ruuskanen, P., and Voloshin, S. A., Phys. Lett., B503, 58–64 (2001).
- Gyulassy et al. (2001) Gyulassy, M., Vitev, I., and Wang, X. N., Phys. Rev. Lett., 86, 2537–2540 (2001).
- Teaney et al. (2001) Teaney, D., Lauret, J., and Shuryak, E. V., Phys. Rev. Lett., 86, 4783–4786 (2001).
- Lin and Ko (2002) Lin, Z.-w., and Ko, C. M., Phys. Rev., C65, 034904 (2002).
- Voloshin and Zhang (1996) Voloshin, S., and Zhang, Y., Z. Phys., C70, 665–672 (1996).
- Poskanzer and Voloshin (1998) Poskanzer, A. M., and Voloshin, S. A., Phys. Rev., C58, 1671–1678 (1998).
- Ackermann et al. (2001) Ackermann, K. H., et al., Phys. Rev. Lett., 86, 402–407 (2001).
- Adler et al. (2001a) Adler, C., et al., Phys. Rev. Lett., 87, 182301 (2001a).
- Lacey (2002) Lacey, R. A., Nucl. Phys., A698, 559–563 (2002).
- Park et al. (2002) Park, I. C., et al., Nucl. Phys., A698, 564–567 (2002).
- Snellings (2002) Snellings, R. J. M., Nucl. Phys., A698, 193–198 (2002).
- Ackermann et al. (1999) Ackermann, K. H., et al., Nucl. Phys., A661, 681–685 (1999).
- Adler et al. (2001b) Adler, C., et al., Nucl. Instrum. Meth., A461, 337–340 (2001b).
- Wieman et al. (1997) Wieman, H., et al., IEEE Trans. Nucl. Sci., 44, 671–678 (1997).
- Betts et al. (1997) Betts, W., et al., IEEE Trans. Nucl. Sci., 44, 592–597 (1997).
- Klein et al. (1996) Klein, S. R., et al., IEEE Trans. Nucl. Sci., 43, 1768–1772 (1996).
- Groom et al. (2000) Groom, D. E., et al., Eur. Phys. J., C15, 1–878 (2000).
- Dinh et al. (2000) Dinh, P. M., Borghini, N., and Ollitrault, J.-Y., Phys. Lett., B477, 51–58 (2000).
- Borghini et al. (2000) Borghini, N., Dinh, P. M., and Ollitrault, J.-Y., Phys. Rev., C62, 034902 (2000).