CHARGED PARTICLE MULTIPLICITY AND LIMITING FRAGMENTATION IN Au+Au COLLISIONS AT RHIC ENERGIES USING THE PHOBOS DETECTOR
The first measurements of charged particle pseudorapidity distributions obtained from collisions at the maximum RHIC energy ( GeV) using the PHOBOS detector are presented. A comparison of the pseudorapidity distributions at energies 130 and 200 GeV for different centrality bins is made, including an estimate of the total number of charged particles. Away from the mid-rapidity region, a comparison between at SPS energy 17.3 GeV and at RHIC energy 130 GeV indicates that the extent of the limiting fragmentation region grows by about 1.5 units of over this energy range. We also observe that the extent of the limiting fragmentation region is independent of centrality at the same energy, but that the particle production per participant in the limiting fragmentation region grows at high for more peripheral collisions. In combination with results from lower energies and from collisions, these data permit a systematic analysis of particle production mechanisms in nucleus-nucleus collisions.
1 Introduction
Quantum Chromodynamics (QCD) is believed to be the fundamental theory for strong interactions. According to this theory, hadronic matter under extreme dense and hot conditions must go through a phase transition to form a Quark Gluon Plasma (QGP) in which quarks and gluons are no longer confined to the size of a hadron. Lattice gauge studies of QCD at finite temperatures have indeed found such a phase transition, though the exact nature of the transition has not yet been determined . The study of the QGP and of the phase transition is important for understanding the early evolution of our universe. It has been proposed that collisions between highly relativistic nuclei can be used to recreate conditions of the early universe in the laboratory. During the past decade, such experiments have been performed at the BNL AGS and the CERN SPS at maximum energies 4.8 GeV () and 17.3 GeV (), respectively. The results from those experiments have demonstrated rich physics which cannot be explained by a trivial extrapolation of results. At the present time there is, however, no unambiguous evidence for the existence of a quark-gluon plasma over a significantly large space-time region. While the analysis of AGS and SPS data continues, the new Relativistic Heavy Ion Collider (RHIC) at BNL delivered the first collisions of gold nuclei in June 2000 at center of mass energies several times larger than those previously available. The goal of the RHIC heavy ion program is to study the behavior of strongly interacting matter under conditions of extreme temperatures and energy densities which are the prerequisites predicted for the creation of the QGP. To study this behavior, the PHOBOS experiment is designed to combine measurements of global properties, such as the charged particle multiplicity, with detailed studies aimed at characterizing the microscopic aspects of the collisions. In this paper we present an overview of recent results from the PHOBOS experiment which provide a coherent picture of the initial state parton density, which will be reflected by the charged particle multiplicities for Au+Au collisions at different energies. Away from the mid-rapidity region, PHOBOS measurements confirm the hypothesis of limiting fragmentation in collisions as function of centrality. In combination with results from lower energies and from collisions, these data permit a systematic analysis of particle production mechanisms in nucleus-nucleus collisions.
2 Experimental Setup
The PHOBOS experiment consists of five detector subsystems. These include a large solid-angle multiplicity array, vertex finding detectors, two multiparticle tracking spectrometers, a set of plastic scintillator time-of-flight (TOF) walls, and trigger detectors. The multiplicity arrays are divided into an octagonal barrel of silicon pad detectors surrounding the beam pipe in the central rapidity region, and six ring counters of silicon pad detectors. Together, these arrays cover 5.4. The vertex detectors consist of two sets of silicon pad detectors above and below the beam line around the interaction region covering near mid-rapidity. The spectrometers are positioned on either side of the beam partially within a 2T magnet field which provides momentum measurement and particle identification near mid-rapidity. The technical details of the silicon detectors are described in Ref . Finally, trigger counters consisting of two rings of 16 erenkov radiators and two sets of plastic scintillator counters, are arranged around the beam pipe. They serve as the primary event trigger, and detect charged particles in the range 4.4 5.2 and 3 4.5, respectively. The scintillator counters are also used for offline event selection and determination of the collision centrality. Details of this procedure can be found in Ref .
3 Initial State Parton Density
One of the important observables in heavy-ion interactions is the number of charged particles produced in a collision and the pseudorapidity density . This number () is believed to be proportional to the entropy density at freeze-out and, since entropy cannot be destroyed (even in non-equilibrium systems) the pseudorapidity density provides a constraint on the initial state parton density and any further entropy produced during the subsequent evolution. The charged particle multiplicity at mid-rapidity was obtained by three different analysis procedures : 1) Counting of “tracklets”, i.e. hits in two consecutive Si-detector planes of the vertex or spectrometer detectors in the field-free region close to the vertex position. 2) Counting of hit pads in the single layer octagon detector, correcting for multiple hits by assuming Poisson counting statistics. 3) Relating the energy deposition in the single-layer octagon detector to the charged-particle multiplicity. Results from these methods were corrected for non-vertex background and weak-decay feed-down using a Geant/HIJING based simulation. The measured scaled pseudorapidity densities at mid-rapidity for central collisions are shown in Fig. 1(a) as function of . In order to compare to data, is divided by the number of participant pairs . A comparison to collisions in the overlapping energy region shows a 55 higher production rate in central collisions, indicating that the is not a simple superposition of . When compared with results from lower energies for , we observe that for the most central events increases logarithmically with energy up to the maximum RHIC energy, GeV, as indicated by the solid line fit .
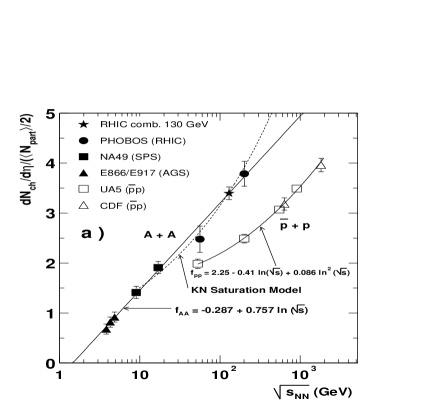
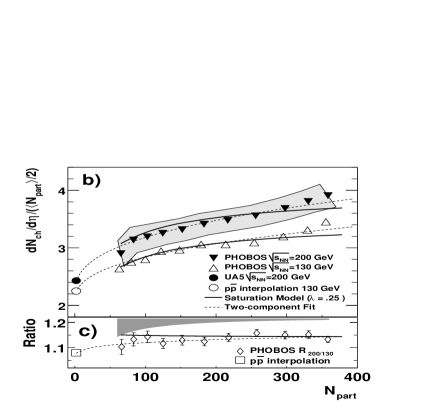
To put these results in context, we also show the prediction of the parton saturation model (PSM) as a function of energy, indicated by the dashed line in Fig. 1(a). The good agreement of the PSM with the data suggest that the initial conditions of the model may be correct for particle production at the RHIC energies and that these may already be appropriate at the highest SPS energy. It is also interesting to extrapolate the prediction of the PSM and the fit () to the LHC energy GeV for the most central collision of . Assuming that the , the pseudorapidity density will be and . These correspond to factors of 2.8 (PSM) and 1.7 () increases in multiplicity normalized to the number of participants relative to the RHIC energy of GeV. In Fig. 1(b), we analyze the particle density as a function of centrality, expressed as the number of participating nucleons (). Such an analysis may shed light on the relative importance of soft versus hard processes of particle production and test the assumption of gluon saturation expected at RHIC .
We present the results for vs for = 200 and 130 GeV. For both energies, we observe a continuous rise of particle density with increasing centrality. The errors for 200 GeV data are shown as a gray band and they include both statistical and systematic errors (90 C.L.). In order to put these results in context, we compare the predictions of PSM, indicated by solid lines and calculations involving fits to the data using the two-component parametrization proposed in Ref (dashed line), , where is the fraction of production of charged particles from hard scattering processes. The energy dependence of has been derived from deep-inelastic scattering data. The HERA data have been found to scale as with 0.25 and the is the number of particles produced in single collisions where and . The number of hard scattering collisions is found to be based on Ref . We have performed fits using the measured values for and find that and . According to the assumptions of this parametrization, the increase in the multiplicity of charged particles produced from 130 to 200 GeV in at mid-rapidity region from hard processes can be obtained by using the values of and which leads to :
| (1) |
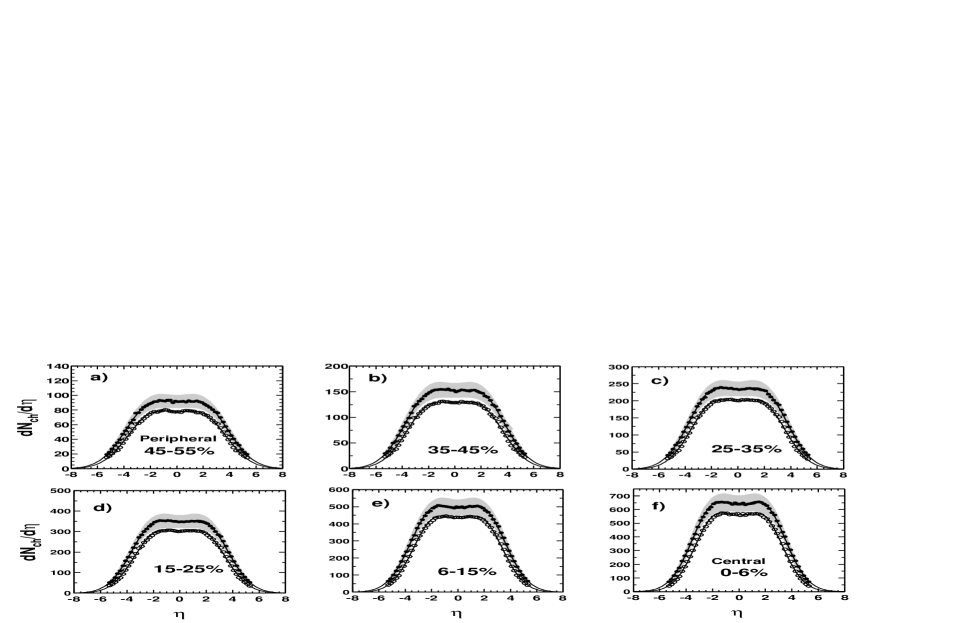
If this description is correct, the increase of 34 indicates that the hard processes start to play an significant role at RHIC energies. We have also measured over the range 5.4 for collisions at and 200 GeV, which are shown for six centrality bins in Fig. 2. The gray bands represent the systematic errors (90 C.L.). The errors at 130 GeV are not shown, but are a similar in magnitude to those at 200 GeV. A general feature of these distributions at both energies and all centrality bins is a flat region extending over about units of pseudorapidity around mid-rapidity. Outside this region we observe a fall-off towards large . In Table 1, we present the total charged particle multiplicity for each centrality bin obtained from the integration of the data points () and also using a fit (continuous line in Fig. 2) () which is based on the stochastic approach . The contribution to the total from the tails of the distributions outside the measured region is estimated from the fit to be 2 for the most central and 4 for the most peripheral collisions. The comparison of at 130 and 200 GeV for all centrality bins shows that additional particle production occurs dominantly in the mid-rapidity plateau region and also that the width of the distributions is increased at higher energy.
4 Limiting Fragmentation
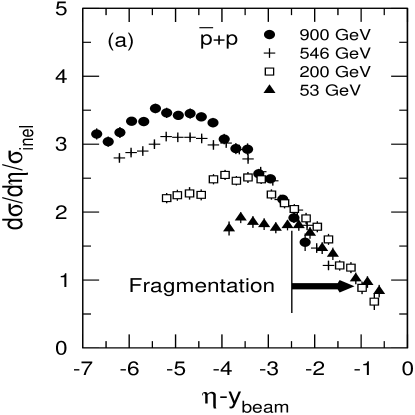
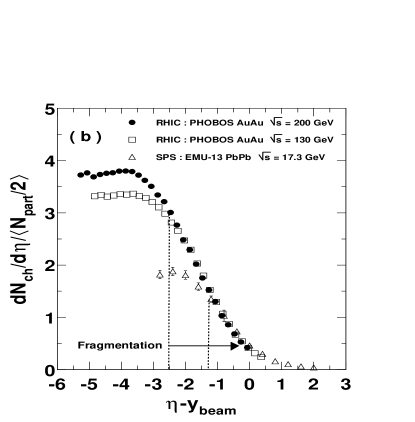
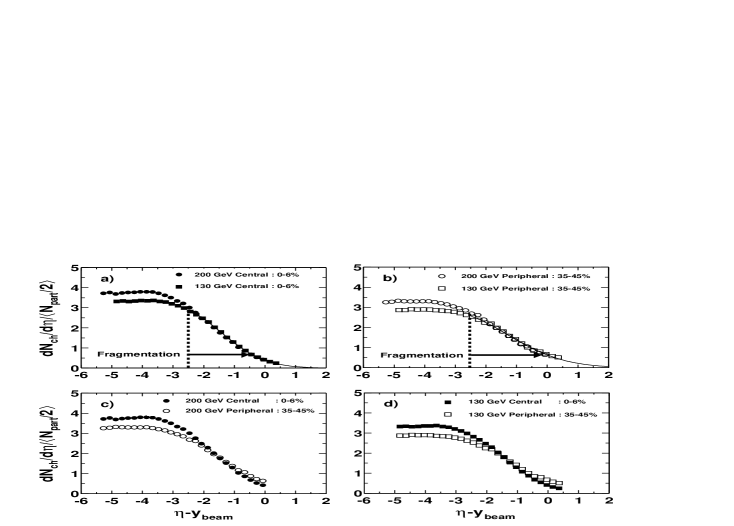
In order to understand the relation between particle production and collision mechanisms, we consider particle production away from mid-rapidity in the target (or projectile) rest frame. The distribution of charged particles from collisions shown in Fig. 3(a) follows a simple scaling relation as predicted by “limiting fragmentation” when plotted versus , where is the beam rapidity. In Fig. 3(b), we observe that the distribution for collisions at 130 and 200 GeV agree for . This indicates that at 130 GeV also follows limiting fragmentation scaling down to . The comparison between at 130 and 200 GeV and at 17.3 GeV shows that the extent of the limiting fragmentation increases by about 1.5 units of pseudorapidity from the maximum SPS energy to 130 GeV at RHIC. In Figs. 4(a) and (b) we show vs. for at 130 and 200 GeV for the most central (6) and for peripheral () collisions. This analysis has also been performed for all other centralities between . We observe that the extent of the limiting fragmentation region () is independent of centrality. In Figs. 4(c) and (d) we show vs. indicating that the particle production per participant in the limiting fragmentation region () increases from the most central to the most peripheral at the same energy. This increase in particle production near due to the target remnants has been previously observed in physics and for lower energy collisions . The distribution may also narrow in central collisions due to dynamical effects, such as baryon stopping, or kinematic effects, such as a shift in due to the particle mix ( ratio) changing with centrality.
In summary, the first measurements of the pseudorapidity distributions from collisions at maximum RHIC energy = 200 GeV have been presented and compared to the results from the new analysis of data at 130 GeV. The pseudorapidity distributions have been measured as a function of collision centrality and energy over an extended range of pseudorapidity , which allows for an accurate estimate of the total charged particle yield. For the most central collisions () at 130 GeV about 4160 charged particles are produced reaching about 5050 at the maximum RHIC energy of 200 GeV. The pseudorapidity distributions at 130 and 200 GeV, for all centrality bins, show evidence that additional particle production occurs in the mid-rapidity plateau region and that the width of the distribution increases with energy. Away from mid-rapidity, a detailed study of the distribution as a function of collision centrality and energy has been made in order to study limiting fragmentation behavior in collisions at RHIC energies. A comparison between Au Au data at 130 GeV and at SPS energy 17.3 GeV indicates that the extent of the limiting fragmentation region grows with energy by about 1.5 units of . We observe also that the extent of limiting fragmentation is independent of centrality at the same energy but the particle production per participant in the limiting fragmentation region increases at high for more peripheral collisions. This indicates that the number of charged particles produced grows faster than the number of participating target nucleons, suggesting that the “spectator” matter also contributes to particle production in the target fragmentation region.
| 200 GeV | 130 GeV | |||||
|---|---|---|---|---|---|---|
| Bin(%) | / | / | ||||
| 0 - 6 | 4960250 | 5050 | 1.02 | 4100210 | 4160 | 1.01 |
| 6 - 15 | 3860190 | 3960 | 1.02 | 3230160 | 3280 | 1.01 |
| 15 - 25 | 2750140 | 2820 | 1.03 | 2270110 | 2310 | 1.02 |
| 25 - 35 | 1870 90 | 1930 | 1.03 | 1540 80 | 1580 | 1.02 |
| 35 - 45 | 1230 60 | 1270 | 1.04 | 1000 50 | 1030 | 1.03 |
| 45 - 55 | 750 40 | 780 | 1.04 | 620 30 | 640 | 1.03 |
Acknowledgments
This work was partially supported by U.S. DOE grants DE-AC02-98CH10886, DE-FG02-93ER40802, DE-FC02-94ER40818, DE-FG02-94ER40865, DE-FG02-99ER41099, and W-31-109-ENG-38, NSF grants 9603486, 9722606 and 0072204, (Poland) KBN grant 2 PO3B 04916, (Taiwan) NSC 89-2112-M-008-024.
References
References
- [1] S. Shuryak, Phys. Rep. 61, 71 (1980), L. McLerran, Rev. Mod. Phys. 58, 1021 (1986).
- [2] Y. Iwasaki et al, Phys. Rev. Lett. 67, 3343 (1991);
- [3] C. A. Ogilvie, Nucl. Phys. A698, 3c (2002); Carlos Lourenço, Nucl. Phys. A698, 13c (2002); T. Susa et al., Nucl. Phys. A698, 491c (2002).
- [4] R. Nouicer et al., Nucl. Inst. and Meth. A461, 143 (2001).
- [5] J. M. Katzy et al., Nucl. Phys. A698, 555c (2002).
- [6] B. B. Back et al., Phys. Rev. Lett. 88, 22302 (2002);
- [7] D. Kharzeev and E. Levin, Phys. Lett. B523, 79 (2001).
- [8] G. J. Alner et al., Z. Phys. C33, 1 (1986).
- [9] F. Abe et al., Phys. Rev. D41, 2330 (1990).
- [10] B. B. Back et al., Phys. Rev. C65, 061901R (2002).
- [11] X. N. Wang and M. Gyulassy, Phys. Rev. Lett. 86, 3496 (2001).
- [12] K. J. Eskola et al., Nucl. Phys. B570, 379 (2000).
- [13] D Kharzeev and M. Nardi, Phys. Lett. B507, 121 (2001).
- [14] M. Biyajima et al., hep-ph/ 0110305, v1 (2001); N. G. van Kampen, “Stochastic Processes in Physics and Chemistry”, North-Holland Publ. Amsterdam , (1981); N. S. Goel and N. Richter-Dyn, “Stochastic Models in Biology” Academic Press, New York , (1974).
- [15] J. Benecke et al., Phys. Rev. 188, 2159 (1969).
- [16] C. deMarzo et al., Phys. Rev. D26, 1019 (1982).
- [17] L. Ahle et al., Phys. Lett. B476, 1 (2000); L. Ahle et al., Phys. Lett. B490, 53 (2000).
- [18] J. Bachler et al., Nucl. Phys. A661, 45 (1999); S.V. Afanasiev et al., Nucl. Phys. A698, 104 (2002).
- [19] P. Deines-Jones et al., Phys. Rev. C62, 014903 (2000).