Centrality Dependence of the High Charged Hadron Suppression in Au+Au Collisions at GeV
Abstract
PHENIX has measured the centrality dependence of charged hadron spectra from Au+Au collisions at GeV. The truncated mean decreases with centrality for GeV/c, indicating an apparent reduction of the contribution from hard scattering to high hadron production. For central collisions the yield at high is shown to be suppressed compared to binary nucleon-nucleon collision scaling of p+p data. This suppression is monotonically increasing with centrality, but most of the change occurs below 30% centrality, i.e. for collisions with less than 140 participating nucleons. The observed and centrality dependence is consistent with the particle production predicted by models including hard scattering and subsequent energy loss of the scattered partons in the dense matter created in the collisions.
1 Introduction
Particle production at large transverse momentum () provides a new tool to study hot and dense nuclear matter created in high energy nuclear collisions. In nucleon-nucleon collisions, hadrons with GeV/c are believed to originate mostly from the jet fragmentation of constituent partons, quarks and gluons, that were scattered with large momentum transfer [2]. In nuclear collision these hard scattering processes between constituent partons occur early compared to the lifetime of the strongly interacting matter. Thus the hard scattered partons may traverse the highest energy density matter produced. Theoretical studies of the propagation of partons in high density matter suggest that they lose a significant fraction of their energy through gluon bremsstrahlung [3] and that the energy lost reflects the density of color charges in the matter through which they pass [4]. The energy loss reduces the momenta of the partons, which results in a corresponding reduction of the momenta of the fragmentation products [5], observable as a reduced yield of high hadrons.
The first measurements of hadron spectra at the Brookhaven National Laboratory Relativistic Heavy Ion Collider (RHIC) facility indicate a suppression of high- hadron production in central Au+Au collisions relative to a binary collision scaling of p+p and +p data [6, 7]. No suppression is found for peripheral Au+Au collisions. So far no unique explanation of this apparent absence of the expected jet contribution to the spectrum above 2 GeV/c has been identified.
Models of parton energy loss can reproduce the observed suppression in central Au+Au collisions [8, 9, 10]. Other final state effects such as re-scattering of hadrons originally produced via the jet fragmentation have been proposed to explain the suppression [11]. It should be noted that models invoking thermal hadron production combined with collective transverse expansion of the reaction volume successfully describe the transverse momentum distributions of identified hadrons up to 3 GeV/c [12, 13]. However, the mechanism of equilibration, which requires a reduction of the high particle yield, is not specified in these models.
Alternatively, the initial state may be modified such that the number of hard scatterings is reduced. It is well known that nuclear modifications of the parton distributions exist [14]. These modifications cannot explain the suppression, since in the kinematic range of the measurements anti-shadowing enhances the parton distributions in nuclei [15, 16, 17]. However, models using a classical QCD picture of a highly relativistic nucleus [18, 19] suggest that gluon distributions are saturated for momenta below a scale and thus reduced compared to expectations based on perturbative QCD [20]. As a consequence, a considerable suppression of hadron production might be expected even well above [21].
In this letter we present the centrality dependence of the suppression of the high- hadron yield to provide new experimental constraints on theoretical descriptions. These data are complementary to the previous study of the absolute yields [6] and have different systematic errors.
2 Experimental setup and data analysis
The results are obtained from minimum bias Au+Au collisions at =130 GeV recorded by the PHENIX experiment during the Run-1 operation of RHIC (August - September 2000). Details on the PHENIX detector and its configuration in Run-1 operation can be found in [6, 22].
In PHENIX semi-inclusive charged hadron spectra are measured over the range GeV/c in the east central arm spectrometer using data from a drift chamber (DC) and two segmented cathode pad chambers (PC1 and PC3), located outside of an axial magnetic field at a radial distance of 2.2, 2.5 and 5 m from the beam axis. The detectors cover an azimuthal acceptance of and a pseudo-rapidity range of . In this analysis an additional fiducial cut is applied to guarantee homogeneous track acceptance for collisions within cm of the nominal interaction point. About 25% of the azimuthal acceptance is covered by a time-of-flight system which allows proton identification out to 3.5 GeV/c, where the measurement is limited by statistics [23].
A pair of beam-beam counters provides the vertex position along the beam direction (z). Each charged track is reconstructed from the DC measurements of its projection into the bend plane of the magnetic field and two space points provided by PC1 and PC3. The unphysical background, resulting from false associations of drift chamber projections with pad chamber points, is estimated and subtracted by forming artificial events with the locations of pad chamber points inverted around the symmetry axis of the spectrometer. Physical background from decays in flight and photon conversions close to the DC, which only partially traverse the field and thus mimic high momentum tracks, are removed by requiring the track to point back to the event vertex within cm. The remaining background level is negligible below 4 GeV/c and less than 40% at 5 GeV/c; this upper estimate is included in the systematic errors.
Corrections of the data are determined by tracing individual particles through a full GEANT simulation, simulating the detector response, then merging this response with that of all particles from a real event and passing the composite event through the PHENIX reconstruction software. The average track reconstruction efficiency in the active detector area is larger than 98% in peripheral collisions and decreases to 686% for central collisions. The corresponding correction is shown on the upper left hand side of Fig. 1. The full correction also depends on . It is plotted for peripheral collision on the upper right hand side of the figure. Between 0.8 and 2.5 GeV/c the correction factor varies slowly with . Its value of corrects for geometrical acceptance (; ), dead areas of the detectors ( 45% DC, 5% PC’s), and losses due to track matching cuts. At lower the correction increases reflecting the gradual loss of acceptance. At higher the observed particle yield is artificially increased because of the finite momentum resolution () and therefore the correction function decreases. Since this correction depends on the spectral shape of the true distribution it was determined iteratively. At 5 GeV/c the correction is reduced by a factor of 2. The systematic uncertainties are indicate by the dashed lines; they are also tabulated in Table 1. As shown in the lower part of Fig. 1 correction factorizes into functions of centrality (i.e. detector occupancy) and within 2% systematic uncertainty in the range from 2 to 5 GeV/c.
Events are selected according to centrality following the procedure described in [6]. Six exclusive centrality bins are established using the energy measured in two zero-degree calorimeters and the number of charged-particles detected in the two beam-beam counters. A Monte-Carlo simulation using measured nucleon density distributions calculated in the Glauber eikonal approximation was used to estimate the average number of binary nucleon-nucleon collisions () and the corresponding average number of participating nucleons () for each bin. The results are quoted in Table 2.
3 Results
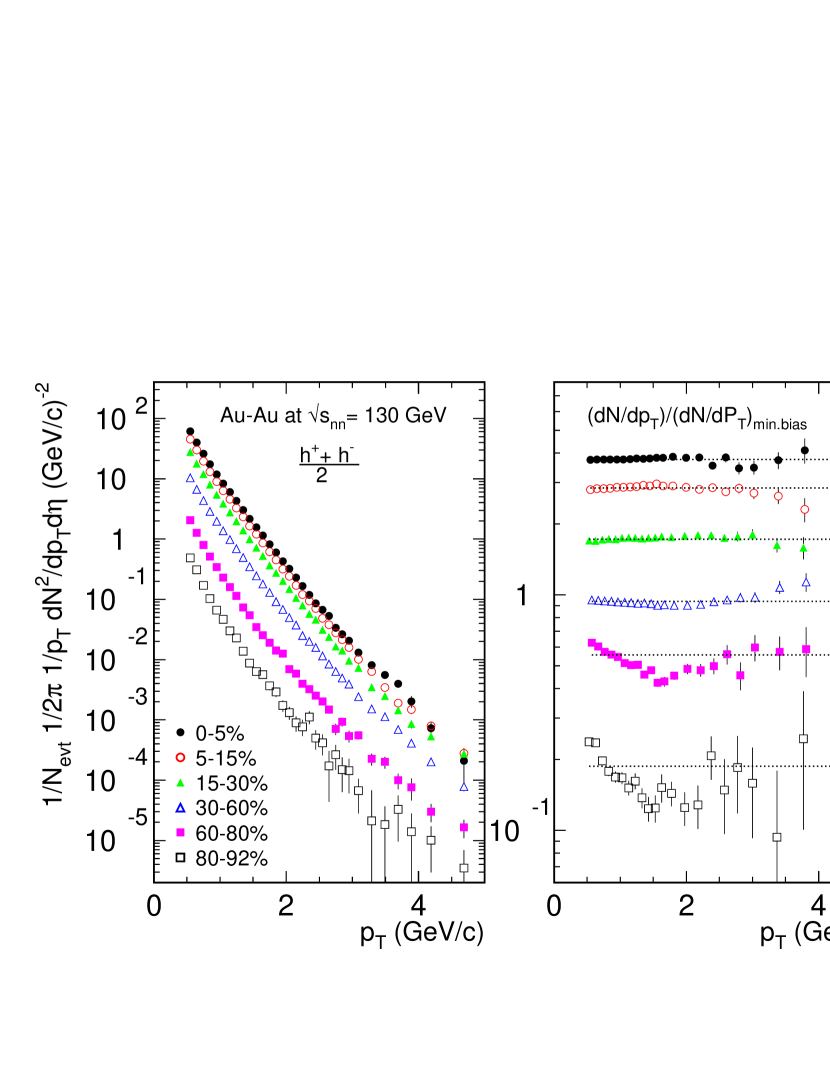
Fig. 2 presents charged hadron spectra for the six centrality bins. For peripheral collisions the spectra are more concave than those for central collisions. This shape difference is seen more clearly by taking the ratio of the spectrum for each centrality bin to the minimum-bias spectrum, as shown on the right hand side of Fig. 2. In these ratios most systematic errors cancel or affect the overall scale only. The ratios for the central bins are almost independent of since central collisions dominate the minimum bias yields. The peripheral bins show a decreasing ratio between 0.5 and 1.5 GeV/c thus in peripheral collisions the yield in this region decreases more rapidly with increasing than in central collisions. For above 1.5 GeV/c this trend is inverted.
Before analyzing the centrality dependence in more detail we demonstrate that the observed suppression of the yield at high does not result from a reduced yield of protons and anti-protons [23]. To evaluate the effect of the (anti-)protons, we plot in the top panel of Fig. 3 the dependence of , the ratio of proton plus anti-proton yields to the total charged hadron yield for minimum bias collisions, which increases steadily. Above 1.5 GeV/c the ratio seem to saturate reaching a value of arround 3 GeV/c. In the bottom panel of Fig. 3 we show for above 1.8 GeV/c as a function of centrality. Since there is clearly no significant decrease of the ratio with either centrality or , the observed hadron suppression is not due to a larger suppression of the (anti-)proton component than that of the mesons. On the contrary, within the range of the presented measurement the apparent slight increase in with could indicate a larger suppression of the meson component relative to all charged hadrons.
To evaluate the change of the hadron spectra more quantitatively we calculate the truncated average :
| (1) |
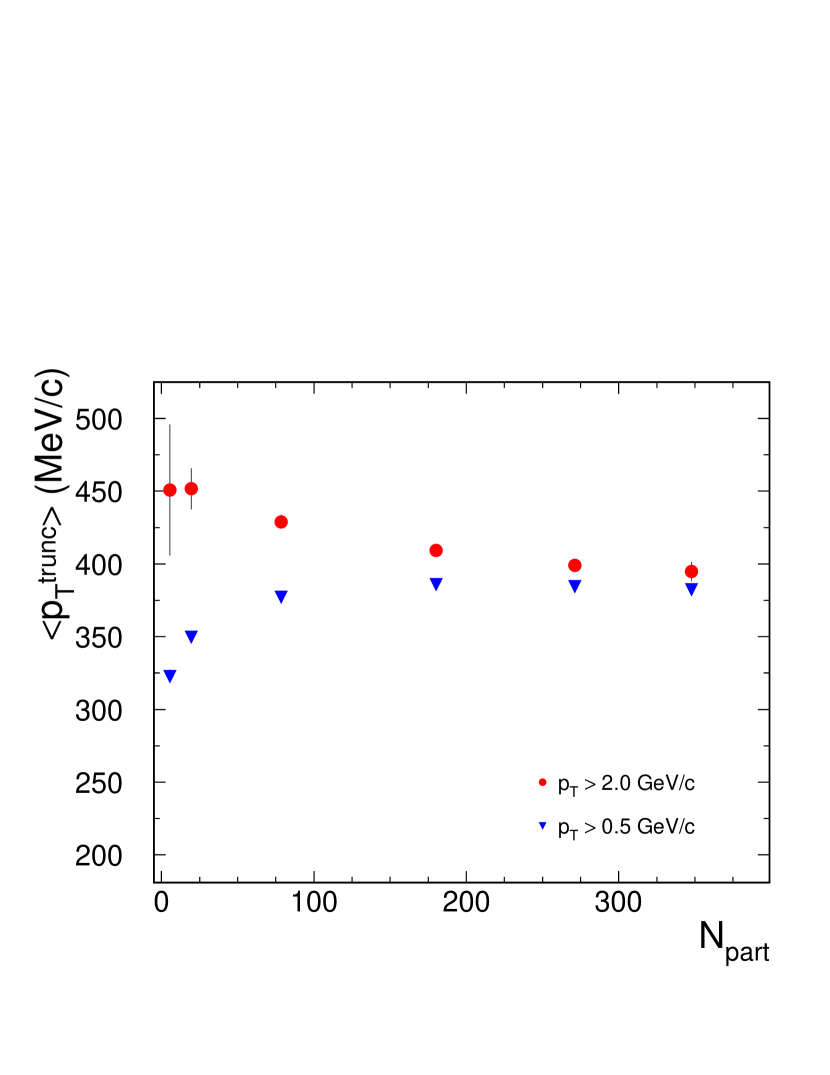
for GeV/c and for GeV/c for each centrality selection 111The value of is closely related to the local inverse slope which is slightly smaller. The conversion to local slope depends on the spectral shape and also on . For an exponential spectrum with an inverse slope of 350 MeV/c the conversion is approximately MeV/c for GeV/c.. In Fig. 4 is plotted as a function of . The value of is insensitive to the normalization of the spectra. Systematic uncertainties of 20(50) MeV/c for GeV/c result from an 1-2% uncertainty on the momentum scale and the dependent uncertainties on the correction function. Since the centrality and dependence of the correction factorize the error on is independent of centrality to better than 2 MeV/c.
The for GeV/c increases with similar to the average of identified charged hadrons [23]. For higher GeV/c the drops by 60 MeV/c with , distinctly different from the expected increased role of hard particle production in the more central collisions. Absent any collective effects, the hard scattering contribution should increase relative to soft production by the factor which grows from 1.5 to from peripheral to central collisions. Since the relative contribution of the hard component to the spectrum increases with , this should lead to a rise of for sufficiently large . The drop of therefore indicates the suppression of the high relative to the low hadron yield independent of systematic errors associated with the absolute normalization of the spectra or any nucleon-nucleon reference distribution.
Changes of the hadron spectra at high are often presented in terms of the nuclear modification factor . This measure relies on the absolute normalization and a reference and therefore has intrinsically larger systematic uncertainties, but it allows to quantify the suppression. We have calculated for each centrality bin as:
| (2) |
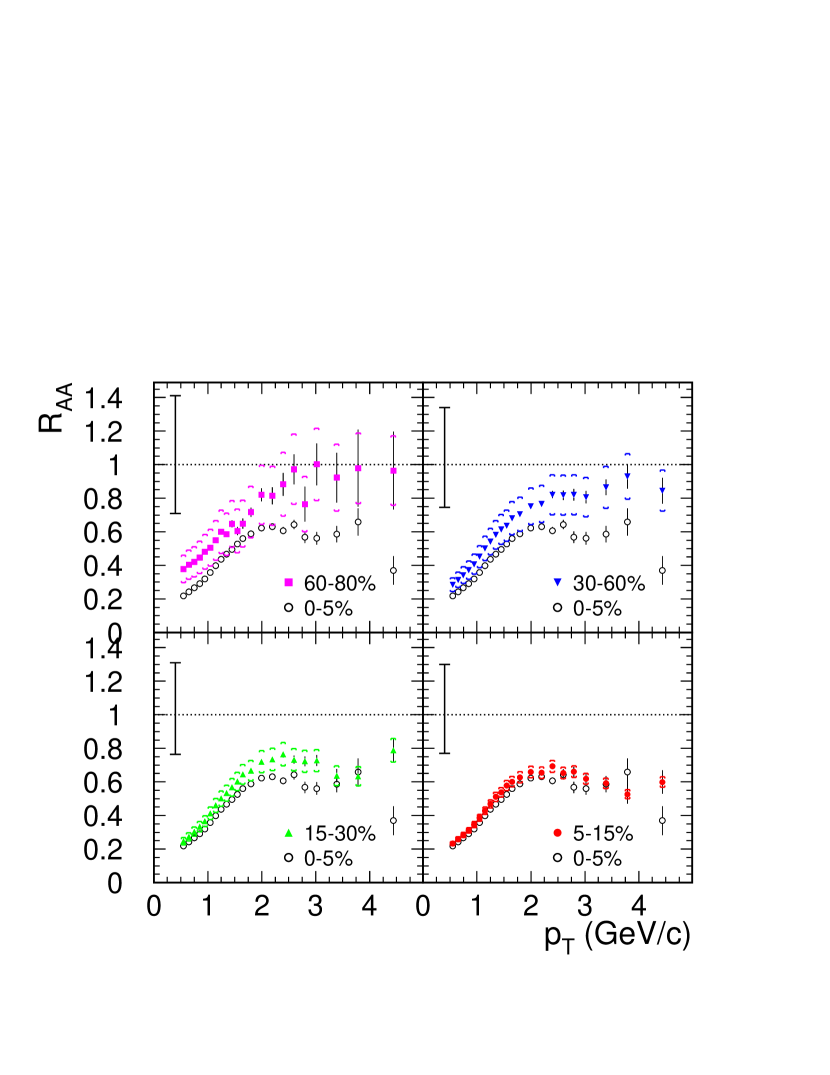
For the N+N charged hadron cross section we use a power-law parameterization , with 330 mb/(GeV/c)2, , and . The parameters were obtained by interpolating p+p and +p data to GeV as described in [6]. In Fig. 5 the values for all centrality bins excluding the most peripheral one are compared to the central (0-5%) bin. The systematic uncertainties in the normalization of the data, in , and in the N+N reference (20%) result in overall systematic errors of about 41%, 34%, 31%, 31% and 30% for centrality bins 2-6, respectively. The errors are quoted for the range from 1 to 3.5 GeV/c; they increase somewhat towards higher . Comparing for a given centrality bin to the most central bin, the systematic errors reduce to for bin 5 (5-15%) and nearly 27% for bin 2(60-80%). They are dominated the uncertainty in listed in Table 2.
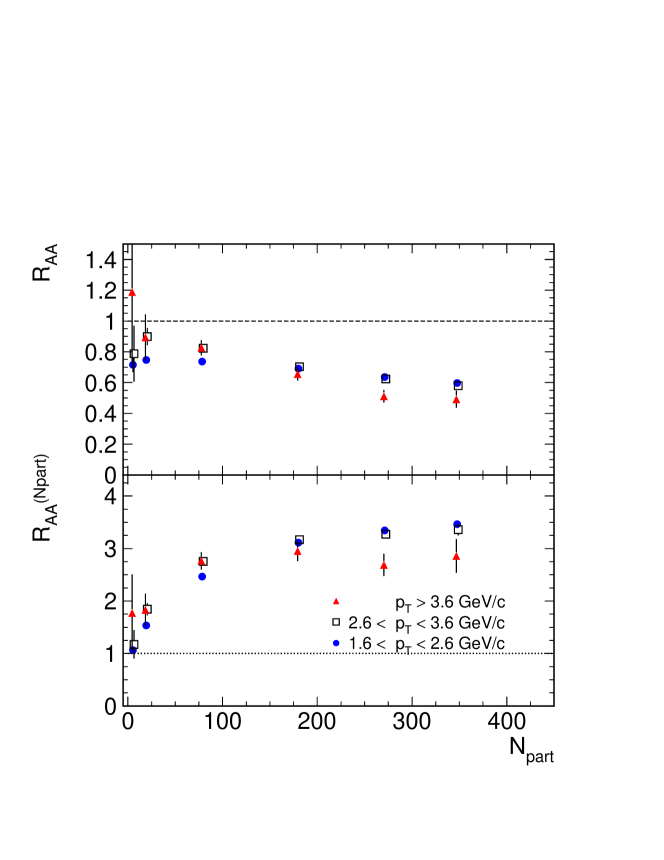
For the 60-80% centrality bin, increases with and reaches unity at high . In comparison to the 60-80% bin, the values for the most central bin remain significantly below unity at a value of 0.55 for GeV/c. At high approximately constant values are detected in all centrality bins. The high values decrease monotonically with centrality, clearly indicating that the magnitude of the suppression of high hadrons increases with centrality. This is shown clearly in the upper part of Fig. 6, which presents obtained for the three bins 1.6 to 2.6 GeV/c, 2.6 to 3.6 GeV/c, and above GeV/c as a function of centrality. For central collisions we observe a suppression of about a factor of compared to binary collision scaling. Relative to peripheral collisions the suppression factor in central collisions increases with from to to for the three bins, respectively.
We note that for peripheral collisions the data do not indicate a significant increase of above unity, unlike data at lower energies [24]. However, such an increase, attributed to initial state scattering, the Cronin effect [25], may well be consistent with the peripheral data due to the large systematic uncertainty of the scale. While the relative difference between the peripheral and central spectra increases with , the roughly constant nuclear modification factor at large suggests an approximately independent suppression of hard scattering contributions over the range GeV/c.
The physics that controls the production of high- particles or the suppression of the hard scattering yields in the measured range may not depend directly on . Thus, we have calculated a different ratio, , defined similarly to but with replaced by the number of participant pairs, . If particle production increases proportional to the number of participants, .
The obtained values are shown in Fig. 6 (bottom) for the three bins used above. The values of are larger than by a factor equal to the average number of nucleon-nucleon collisions suffered by each participant. For all bins the yield per participant is consistent with unity for peripheral collisions as expected since peripheral collisions should closely resemble N+N collisions. For central collisions increases to approximately three. Most of this change occurs in the range of from 40 to 140. For larger the yield in the highest bin is approximately constant while in both lower bins it increases by 20 to 30%.
4 Concluding discussion
In this paper we have presented the centrality dependence of charged hadron spectra focusing on the behavior of the spectra at high . A striking change of the spectral shape is observed when comparing spectra from different centrality selections. For peripheral collisions the spectrum exhibits a pronounced concave shape which is modified towards a more exponential spectrum as the centrality increases. The observed lack of variation with centrality in the proton to charged ratio at large transverse momenta indicates that the modification is not due to a change in the relative yields of protons.
We observe a decrease of for GeV/c with increasing centrality, which is distinctly different from the increase of and demonstrates the suppression of the high hadron yield independent of systematic errors associated with the absolute normalization of the spectra. The data are not consistent with binary collision scaling of hard scattering processes, which would results in an increase of . If the spectra above 2 GeV/c are strongly affected by collective motion of matter before freeze-out, we would also expect an increase since the corresponding flow velocities should increase in more central collisions [26]. Similarly, if gluon saturation is important for particle production in the range above 2 GeV/c, should increase with increasing due to the predicted logarithmic increase of [27]. In contrast, the data are consistent with models assuming energy loss of hard scattered partons, which results in an increasing reduction of the hard scattering contribution to the hadron spectrum with increasing centrality of the collisions [8, 9, 10]. It remains to be seen whether this explanation is unique.
Comparing the measured differential yields in five centrality bins to an scaling of the N+N reference yields we see a suppression of the yields in central collisions at high , consistent with the results in [6, 7]. In the 0-30% centrality range (bins 1-3) the suppression is approximately independent of for GeV/c at a value of 0.6 and simultaneously nearly independent within 20% of centrality. The suppression sets in gradually with the largest change occurring over the 30-60% centrality range. This centrality bin covers a broad range of collision geometries. Whether the change is continuous or exhibits a threshold behavior, as predicted in [28], cannot be judged from the present data. The observed suppression is consistent with parton energy loss scenarios. In these models, the value of and its dependence are very sensitive to the actual energy loss prescription. Due to the large systematic errors on the scale, the contribution from the protons and the limited reach of the data presented here, we can not distinguish between the different energy loss prescriptions on the basis of .
In summary, a detailed analysis of the centrality dependence of charged particle data from Au-Au collisions at GeV measured by PHENIX reveals interesting features of the observed high hadron suppression. The decrease of the average with increasing centrality seems to favor models of particle production that consider energy loss effects, rather than saturation- or hydrodynamics-based approaches for this range. The suppression sets in gradually with the largest changes occurring for peripheral collisions with less than about 140 participating nucleons. From there on it does not change substantially towards more central collisions.
Note Added in Proof
After submission of our manuscript, data from Au-Au collisions at GeV were presented by the PHOBOS collaboration[29, 30], with an emphasis on the lack of variation in the scaled yields with for . Keeping in mind that results from different energies are not directly comparable, we note that the broader range in presented here shows that this effect does not apply over the entire range of centralities, and that when normalized with the appropriate p-p yields, is simply an aspect of the smooth variation of visible in Fig. 6.
References
- [1]
- [*] Deceased
- [†] Not a participating Institution.
- [2] H.Jöstlein et al., Phys. Rev. D20 (1979) 53.
- [3] M. Gyulassy and M. Plümer, Phys. Lett. B243 (1990) 432; X.N. Wang and M. Gyulassy, Phys. Rev. Lett. 68 (1992) 1480.
- [4] X.N. Wang, M. Gyulassy and M. Plümer, Phys. Rev. D51 (1995) 3436; R. Baier et al., Phys. Lett. B345 (1995) 277; R. Baier, D. Schiff and B.G. Zakharov, Ann. Rev. Nucl. Part. Sci. 50 (2000) 37-69.
- [5] M. Gyulassy and X.N. Wang, Nucl. Phys. B420 (1994) 583; X.N. Wang, Phys. Rev. C58 (1998) 2321.
- [6] PHENIX Collaboration: K. Adcox et al., Phys. Rev. Lett. 88 (2002) 22301.
- [7] STAR Collaboration: C.Adler et al., Phys. Rev. Lett. 89 (2002) 202301.
- [8] X.N. Wang Phys. Rev. C61 (2000) 64910.
- [9] M. Gyulassy, P. Levai and I. Vitev, Phys. Rev. Lett. 85 (2000) 5535.
- [10] P. Levai et al., Nucl. Phys. A698 (2002) 631.
- [11] K. Gallmeister, C. Greiner, and Z. Xu, nucl-th/0202051.
- [12] P. Kolb et al., Nucl. Phys. A696 (2001) 197.
- [13] D. Teaney, J. Lauret and E.V. Shuryak, nucl-th/0110037.
- [14] J.J. Aubert et al., Phys. Lett. B123, (1983) 275.
- [15] L.V. Gribov, E.M. Levin and M.G. Ryskin, Phys. Repts. 100 (1983) .
- [16] Z. Huang, H. J. Lu and I. Sarcevic, Nucl. Phys. A637 (1998) 79.
- [17] K.J. Eskola, V.J. Kolhinen and C.A. Salgado, Eur.Phys.J. C9 (1999) 61.
- [18] L. D. McLerran and R. Venugopalan, Phys. Rev. D49 (1994) 2233.
- [19] A. Kovner, L. D. McLerran and H. Weigert, Phys. Rev. D52 (1995) 6231.
- [20] A. Krasnitz, Y. Nara and R. Venugopalan, Phys. Rev. Lett. 87 (2001) 192302.
- [21] D. Kharzeev, E. Levin and L. D. McLerran, hep-ph/0210332.
- [22] PHENIX Collaboration: K. Adcox et al., Phys. Rev. Lett. 86 (2001) 3500 and Phys. Rev. Lett. 87 (2001) 052301.
- [23] PHENIX Collaboration: K. Adcox et al., Phys. Rev. Lett. 88 (2002) 242301.
- [24] E. Wang and X. N. Wang, nucl-th/0104031 and references therein.
- [25] D. Antreasyan et al., Phys. Rev. D19 (1979) 764.
- [26] E. Shuryak private communication.
- [27] D. Kharzeev and E. Levin, nucl-th/0108006, J. Schaffner-Bielich et al., nucl-th/0108048.
- [28] X.N. Wang, Phys. Rev. C63 (2001) 54902.
- [29] PHOBOS Collaboration: C. Roland et al., arXiv:hep-ex/0212006.
- [30] PHOBOS Collaboration: B. B. Back et al., arXiv:nucl-ex/0302015, submitted to Phys. Lett. B.


| (GeV/c) | (%) | (%) | (%) | (%) | total |
|---|---|---|---|---|---|
| 1 | 13.5 | + 10 | 0 | 0 | -13.5 +16.4 |
| 2 | 13.5 | + 5 | 1 | 0 | -13.7 +14.4 |
| 3 | 13.5 | + 2.5 | 4 | -1.6 | -14.2 +14.2 |
| 4 | 13.5 | + 1.25 | 9 | -11.5 | -20 +16 |
| 5 | 13.5 | + 0.6 | 15 | -40 | -45 +20 |
| bin | relative fraction | ||||
|---|---|---|---|---|---|
| 1 | 80-92% | 5.5 2.6 | 4.11.7 | 24698 | 1.50.5 |
| 2 | 60-80% | 19.5 3.5 | 20 6 | 50.413 | 2.10.5 |
| 3 | 30-60% | 79 4.6 | 13123 | 7.681.1 | 3.40.6 |
| 4 | 15-30% | 180 6.6 | 40646 | 2.490.13 | 4.50.5 |
| 5 | 5-15% | 271 9 | 71272 | 1.410.03 | 5.20.6 |
| 6 | 0-5% | 34810 | 1009101 | 1 | 5.80.6 |