Beam Energy and Centrality Dependence of Two-Pion Bose-Einstein Correlations at SPS Energies
Abstract
Results are presented of a two-pion interferometry (HBT) analysis in Pb+Au collisions at 40, 80, and 158 AGeV. A detailed study of the Bertsch-Pratt HBT radius parameters has been performed as function of the mean pair transverse momentum and in bins of the centrality of the collision. From these results we extract model dependent information about the space-time evolution of the reaction. An investigation of the effective volume of the pion emitting system provides an important tool to study the properties of thermal pion freeze-out.
keywords:
Two-pion correlations , HBT interferometry , source size and lifetime , transverse expansion , beam energy dependence of radius parametersPACS:
25.75.-q,25.75.Gz,25.75.Ld, , , , , , , , , , , , , , , , , , , , , , , , , , , , , , , , , , , , , , , , , , , , , , , , , , , , , , , ,
(CERES Collaboration)
1 INTRODUCTION
Lattice QCD calculations predict a transition from confined hadronic matter to a state of deconfined quarks and gluons at a critical energy density around 0.6 GeV/fm3 [1]. Such energy densities are believed to be reached at CERN SPS energies and indeed evidence for a new state of matter created in Pb-induced reactions at the SPS has been announced recently [2]. It is expected that the reaction dynamics could differ considerably if energy densities close to or above are reached, and that the existence of a phase transition could manifest itself in the space-time evolution of the system [3, 4, 5, 6, 7, 8, 9]. In particular, the beam energy dependence of quantities characterizing the space-time evolution may give hints to the onset of deconfinement in heavy ion collisions. In addition, the beam energy range available at the SPS provides an important link between the nucleon dominated domain at the AGS and the pionic regime at collider energies, leading to a better understanding of the mechanisms relevant for thermal freeze-out.
While single particle momentum distributions are also determined by the space-time evolution, the lifetime and the spatial extent of the system as well as the existence of collective velocity fields at the time of thermal freeze-out can be disentangled by the study of Bose-Einstein (BE) momentum correlations of identical pions via Hanbury-Brown and Twiss interferometry (HBT). The width of the correlation peak at vanishing relative momenta reflects the so-called length of homogeneity of the pion emitting source. Only in static sources can the length of homogeneity, in the following also called ‘source radius’, be interpreted as the true geometrical size of the system. In a dynamic system, the occurence of space-momentum correlations of the emitted particles due to collective expansion generally leads to a reduction of the observed source radii. The degree of reduction depends on the gradients of the collective expansion velocity and the thermal velocity of the pions at thermal freeze-out. A differential analysis of the HBT correlations in bins of the pair transverse momentum thus provides valuable information not only on the spatial extent but also on the properties of the collective expansion of the system [10, 11, 12, 13].
2 EXPERIMENT
The CERES/NA45 spectrometer at the CERN SPS is optimized for the measurement of low-mass electron pairs in the pseudorapidity range 2.1. It consists of two Silicon Drift Detectors (SDDs), located about 12 cm downstream of the segmented Au-target, and two Ring Imaging Cherenkov counters for electron identification. To improve the mass resolution, the experimental setup was upgraded in 1998 by the addition of a cylindrical Time Projection Chamber (TPC) with radial electric drift field [14]. The TPC is located behind the existing spectrometer, 3.8 m downstream of the target. It is operated inside the field of a new magnet system. Analysis of the track curvature leads to a determination of the momentum of charged particles. The measurement of up to 20 space points per charged particle track allows the determination of the specific energy loss d/d with a precision of 10.5%, thereby supplementing the particle identification capability of the spectrometer. In addition to improving the invariant mass resolution of electron pairs, the TPC also adds sensitivity to hadronic observables close to midrapidity [15, 16].
3 DATA ANALYSIS
In this paper we present the results of a two-pion interferometry analysis in 40, 80, and 158 AGeV Pb+Au collisions [17]. The data were taken during the 1999 (40 AGeV) and 2000 (80 and 158 AGeV) Pb-beam periods. In 1999, the segmented Au-target consisted of 8 subtargets, separated by 3.1 mm in beam direction, and a thickness of 25 each, adding to a total hadronic interaction length of 0.82%. For the 2000 Pb-beam period, the target system was replaced by 13 subtargets of the same thickness and 2 mm spacing, with a total interaction length of 1.33%. An online centrality selection of approximately the upper 30% of the total geometric cross section was applied, using the pulse height deposited by charged particles in the SDDs (in 1999) or in a Scintillator Multiplicity Counter (in 2000). The same detector information is used for an offline characterization of the centrality of the events measured in the 2000 run period, while for the 1999 data set the number of reconstructed charged particle tracks in the SDDs is used. Contributions from non-target interactions are found to be negligible. The data are presented in four bins of centrality, and the corresponding average numbers of participants are derived from a geometric nuclear overlap model [19] with =30 mb, resulting in a total cross section of =6.94 barn. Information about the four centrality bins is collected in Table 1.
| Centrality bin | |||
|---|---|---|---|
| 1 | 15% | 5.8-6.5 | 202 |
| 2 | 10-15% | 4.7-5.8 | 236 |
| 3 | 5-10% | 3.3-4.7 | 287 |
| 4 | 5% | 3.3 | 347 |
For the determination of the correlation function we combine like-sign pairs of charged particles detected in the TPC. A momentum dependent cut on the specific energy loss d/d in the TPC cleans the track sample from soft electrons and protons (see Fig. 1). Kaons are removed only for momenta below 0.5 GeV/c. Requiring a match of the TPC track to the SDD system suppresses the contribution from secondary decay products and results in an increase of the correlation strength but does not alter the extracted source radii.

Similarly, taking the direction of the track from the SDDs rather than from the TPC, which reduces the effect of multiple scattering, leaves the extracted source radii unchanged. Since SDD information is not available for the full data sample we used SDD information only for the tests just mentioned. For the results presented later we restricted the analysis to TPC information only. At the present stage of the spectrometer calibration the momentum resolution is =3-5% in the momentum range of interest, 0.253 GeV/c, consistent with the observed widths of reconstructed neutral strange hadrons and [17].
For each particle pair we calculate the mean transverse momentum
| (1) |
and the pair rapidity
| (2) |
The rapidity (midrapidity) of the c.m. system of the collision changes as function of the beam energy from =2.23 at 40 AGeV to =2.91 at 158 AGeV, while the acceptance of the spectrometer is fixed. For the determination of the correlation functions we restrict the analysis to pairs with GeV/c and -0.25-0.25 (40 AGeV), -0.5-0 (80 AGeV), and -1--0.5 (158 AGeV). We split the three-momentum difference vector of two like-sign particles into components, =, to obtain detailed information about the space-time evolution. Following Bertsch and Pratt [4, 5], is the momentum difference along the beam direction, calculated in the longitudinal rest frame (LCMS) of the pair, is parallel to the pair transverse momentum vector and is perpendicular to and . Note that the pion mass is assumed for the calculation of the LCMS.
The correlation function is defined as the ratio = where the ‘signal’ is the probability to find a pair with momentum difference in a given event and the ‘background’ is the corresponding mixed-event distribution. For the construction of , only tracks from events of the same centrality bin are combined. The number of pairs in was chosen to be about ten times larger than in to keep the statistical error of the background negligible. The normalization is part of the fitting procedure (see below).
A separate analysis of positive and negative like-sign pairs gave within statistical errors the same results for the extracted source radii. To improve statistics, we have thus combined the results of positive and negative like-sign pairs by adding the signal and the background distributions, respectively, before the construction of . This procedure is appropriate if the normalization constants of the positive and negative pair samples are identical, which has been verified.

Due to the correlation between the momentum difference of a pair and its spatial distance in the detector, the finite two track separation power of the TPC can lead to a systematic bias of the correlation function. Fig. 2 shows the opening angle distribution of like-sign particle pairs divided by the corresponding mixed-event distribution. The resulting pair reconstruction efficiency has been normalized to unity at large opening angles. The pair efficiency is independent of the opening angle except for very small . We omitted pairs with opening angles 8 mrad both in the construction of and to avoid a distortion of the correlation function due to the finite two-track separation power. This opening angle corresponds to a spatial distance of about 3 cm at the entrance of the TPC. Our studies have shown that the extracted source radii change only within their statistical errors if the two-track separation cut is varied between 6 and 10 mrad.
Correlations in momentum space are caused not only by quantum statistics but also by final state interactions, the most important one being the mutual Coulomb repulsion. Since this is a two-body process, it depends only on the relative momentum of the pair in its rest frame =. To account for this, we parametrized the -dependent Coulomb correlation function derived by integration of the Coulomb wave functions over a Gaussian source of 5 fm size [20]. In the next step, the impact of the finite detector resolution of =5-10 MeV/c (see below) on was evaluated using a Monte-Carlo simulation. The resulting Coulomb correlation functions before and after momentum smearing are shown in Fig. 3.

In most of the previous HBT analyses the Coulomb correction was carried out by applying -dependent weights to each pair in the background distribution . Afterwards, the Coulomb-corrected correlation function = was normalized in the region of large and fit by a Gaussian parametrization, which then should describe the pure BE correlation peak. This approach assumes that all particle pairs in the signal distribution are subject to the Coulomb correlation, which is in general not true under realistic physical and experimental conditions. In the following, we argue that physics and detector related effects lead to a reduction of the observed BE correlation strength, usually expressed in terms of the parameter , and that the same effects also lead to a similar reduction of the Coulomb repulsion. Therefore, the strength of the Coulomb correction applied to the data should be linked to the experimentally observed parameter.
A reduction of the observed BE correlation from its theoretical value of two at vanishing relative momentum can be caused by coherent pion production, pions from long-lived resonances and weak decays, particle misidentification, and finite momentum resolution. We assume that the contribution from coherent pion production is negligible because the observed pion phase space densities at SPS energies [21] are too low to expect a significant degree of coherence of pion production. Pions from long-lived resonances such as the (782) add a tail to the density distribution of the pion source, which then results in a narrow spike of the correlation function at very small relative momentum. Due to the finite momentum resolution of the detector the spike cannot be resolved. This leads to a reduction of the observed parameter. Since the effective source size of pions emerging from these resonances is large, their mutual Coulomb interaction can be assumed to be negligible. The same arguments apply for pions from weak decays of e.g. and . A contamination of the track sample by particles other than pions leads to pairs of like-sign non-identical particles. They obviously do not contribute to the BE correlation, but they experience Coulomb repulsion. However, due to their different masses, the strongest Coulomb correlation for those pairs does in general not occur at =0 in the LCMS, which is calculated assuming the pion mass, but at finite away from the pion BE peak. We have evaluated this for the CERES acceptance and and pairs. In any case, we conclude that the contribution to Coulomb correlation of non-identical pairs is weak, since the measured correlation functions are flat around the corresponding . Note that pairs containing electrons or positrons do not contribute to Coulomb correlations because most of them stem from decays or conversions far away from the interaction region. Pairs of identical particles which are not pions can give rise to BE and Coulomb correlations. However, a detailed comparison of the correlation functions of positive and negative like-sign pairs showed no significant difference of the extracted source radii and of the shape of the correlation functions at large , although the level of contamination by non-pion pairs is very different in the positive and negative pair sample (see Fig. 1). Therefore we conclude that the contribution of non-pion pairs to Coulomb repulsion and BE correlation is negligible.
In essence, we argue that only those pairs which contribute to the measured BE correlation strength also contribute to Coulomb repulsion. Therefore, the applied Coulomb correction should be scaled according to the observed parameter. Since the value of the parameter is a priori unknown, we construct the correlation function from the signal and background distributions without Coulomb correction, and include the effect of Coulomb repulsion into the fit function:
| (3) |
with
| (4) | |||||
| (5) |
The fit function contains the usual Gaussian parametrization , with the Gaussian source radii , , and , and the cross-term which appears as a consequence of space-time correlations in non-boost-invariant systems [22]. The normalization takes into account the different statistics used for the construction of and . The Coulomb term contains the two-pion Coulomb correlation function which was derived as described before. Its application requires supplementary information about the average in each of the 10 MeV/c -bins, which was stored in separate arrays of the same bin size. Following the above argumentation, the strength of the Coulomb correction needs to be adjusted to the parameter. At this point, an additional complication arises due to the finite momentum resolution, which leads to a dependent reduction of by 13% to 45%, i.e. =. The dependent correction factors were determined by a Monte Carlo simulation and range from 1.15 in the lowest -bin to 1.82 in the highest -bin. The inclusion of into the Coulomb term accounts for the apparent depletion of due to the finite momentum resolution and assures the appropriate scaling of the Coulomb correction. We note that Eq. (3) is identical to the parametrization proposed in [23] for perfect resolution, e.g. =1.

In Fig. 4 are shown the parameters and = for and correlations at 158 AGeV (30%). The parameter for negative pions increases with as expected from a decreasing contribution from electrons and pions from resonance decays. In contrast, for positive pions the parameter decreases with because of an increasing contamination by protons. This behaviour is in quantitative agreement with the contribution from misidentified particles and pions from resonance decays as seen in Monte-Carlo simulations.
In Fig. 5 we present examples of one-dimensional projections of the correlation function, integrated over the range 30 MeV/c in the other two components. Also shown are the corresponding projections of the fit function Eq. (3).


We want to emphasize that the depletion of the correlation function due to Coulomb repulsion is not only visible at the smallest but also in the region outside the BE correlation peak. For kinematical reasons this effect is most pronounced in and increases with . An incorrect treatment of the Coulomb repulsion strength therefore affects and in a different way, in particular leading to a -dependent bias of the / ratio. This is demonstrated in Fig. 6, where the source radii and the ratio / obtained for different Coulomb strengths from central 158 AGeV events are shown. We compare the results assuming full Coulomb strength (open triangles), where all background pairs were corrected by , with different implementations of the Coulomb term in Eq. (3). We considered the cases =1, corresponding to no Coulomb correction (open squares), = (open circles) as proposed in [23], and finally =-1)+1, as given in Eq. (5) (full circles). The parameters and depend very little on the assumed strength of the Coulomb repulsion, however, the results for and correspondingly / are very sensitive to the procedure employed 111Analysis of the RHIC HBT data [24] using the procedure described above should lead to an increase of and / [25]. Whether this can explain part or all of the RHIC HBT ‘puzzle’ remains to be investigated.. We also note that the inclusion of has only little effect on the extracted source radii. In this context it should be mentioned that our fit function Eqs. (3)-(5) describes very well not only the Gaussian BE correlation peak but also the observed undershoot of the baseline at large (see Fig. 5, right panel).

The finite angular and momentum resolution of the TPC cause a systematic reduction of the extracted source radii. Corrections were determined by a Monte-Carlo simulation and depend on as well as on the extracted source radii themselves. The resolution in the components of is shown in Fig. 7. Since and are 3-7 MeV/c only, the corrections to be applied to and are below 2%. This is demonstrated in Fig. 8 where the source radii from central 158 AGeV events before and after correction for the finite momentum resolution are shown. However, deteriorates significantly as function of , which implies corrections up to 60% at high and consequently larger systematic uncertainties in at these momenta.

We conclude that the main sources of systematic errors are the remaining uncertainties in the treatment of the Coulomb repulsion and the corrections for the finite momentum resolution. Varying the Coulomb strength and the momentum resolution within realistic limits, we estimated the systematic errors in and to be 4%. In , the systematic error is larger and depends on . We estimated that the systematic error in is 5% in the lowest and 20% in the highest -bin. In the following we present the results with only statistical errors at the data points. The systematic errors are indicated by shaded bands in the figures.
4 RESULTS

We present, in Fig. 9, the results for the longitudinal source radius as function of and in different bins of centrality for all three beam energies. At all beam energies and centralities under investigation the values exhibit a very pronounced -dependence. This is characteristic for the case of a strong longitudinal expansion, where the length of homogeneity is entirely saturated by the thermal velocity scale [11, 12]. For the limiting case of a boost-invariant expansion in longitudinal direction the following relation was given by Sinyukov [12], which allows to extract the duration of the expansion (the ‘lifetime’) of the system:
| (6) |
In real sources boost-invariance is violated by the finite extension of the system in longitudinal direction. Sophisticated model analyses which consider more realistic density profiles do, however, extract lifetimes which are quite similar to those obtained from Eq. (6) (see e.g. [26]). Fitting expression (6) to the data and assuming a constant thermal freeze-out temperature =120 MeV results in a smooth increase of both with centrality and beam energy from about 6 to 8 fm/c as shown in the left panel of Fig. 10 and Table 2. The choice of =120 MeV is motivated by previous analyses of AGS and SPS data [27, 28], which lead to a good description of single particle spectra and HBT correlations. Since the temperature enters only to the power , unrealistically large changes in are required to significantly affect . We note that the increase of with centrality and beam energy could alternatively be explained by a constant duration of expansion , if increases by 25% with centrality and by 50% from the lowest to the highest beam energy.

The results for are shown in Fig. 11. They exhibit a weaker but still significant -dependence, indicating collective expansion also in transverse direction. As expected from collision geometry, slightly increases with centrality. Comparing different beam energies, we observe that, at 40 AGeV, at small is larger and the -dependence is systematically steeper than at the higher energies, while the results at 80 and 158 AGeV are very similar to each other. All measured parameters at small are larger by almost a factor of two compared to the geometrical size of the initial overlap region of the two colliding nuclei.

Hydrodynamically inspired model calculations predict an interplay between geometrical and thermal length scales. Near midrapidity, can be approximated by [29, 30, 31]:
| (7) |
This expression can be used to determine the ‘true’ geometric transverse size of the source at freeze-out. We estimate from a model dependent analysis of the fit parameter the average transverse flow velocity. This fit parameter contains the thermal freeze-out temperature and the transverse flow rapidity , which characterizes the strength of transverse flow for a given flow profile and transverse density distribution. We applied a fit of this expression to the data, as indicated by the dashed lines in Fig. 11. The fits describe the data very well at all centralities and energies. However, we achieve reasonable results and errors for the fit parameters only at 80 and 158 AGeV, as shown in Table 2. A closer inspection of the -contours of the fits, shown in Fig. 12, shows that the parameters and are highly correlated and that the -contours are very flat and without discernible minimum for the 40 AGeV data. However, the values indicate that the 40 AGeV data are also consistent with fit parameters similar to those obtained for the higher energies, at in fact the same level of confidence as at the higher energies. We conclude that a separation between source geometry and flow dynamics using expression Eq. (7) is not possible because of the steepness of at 40 AGeV.

The results obtained at 80 and 158 AGeV are very similar to each other: We observe a smooth increase of with centrality from about 5.5 to 7 fm, as shown in the middle panel of Fig. 10. Assuming a thermal freeze-out temperature of =120 MeV and a box-shaped density distribution, the average transverse flow velocity can be derived from the fit parameter [32, 26], as shown in the right panel of Fig. 10. For the most central events at 80 and 158 AGeV we obtain and very little centrality dependence. A variation of the assumed freeze-out temperature by 20 MeV alters the extracted flow velocities only within their statistical errors, as demonstrated for the 158 AGeV results by the dashed band in Fig. 10 (right panel). These findings are similar to results from previous analyses [28, 26, 33].
| Cent. bin | (fm/c) | (fm) | (GeV-1) | / | |
|---|---|---|---|---|---|
| 1 | 5.950.14 | - | |||
| 2 | 6.340.13 | - | |||
| 3 | 6.490.11 | - | |||
| 40 AGeV | 4 | 6.630.10 | - | ||
| 1 | 6.490.18 | ||||
| 2 | 6.980.10 | ||||
| 3 | 7.290.09 | ||||
| 80 AGeV | 4 | 7.300.09 | |||
| 1 | 7.340.09 | ||||
| 2 | 7.460.08 | ||||
| 3 | 7.870.06 | ||||
| 158 AGeV | 4 | 8.230.05 |
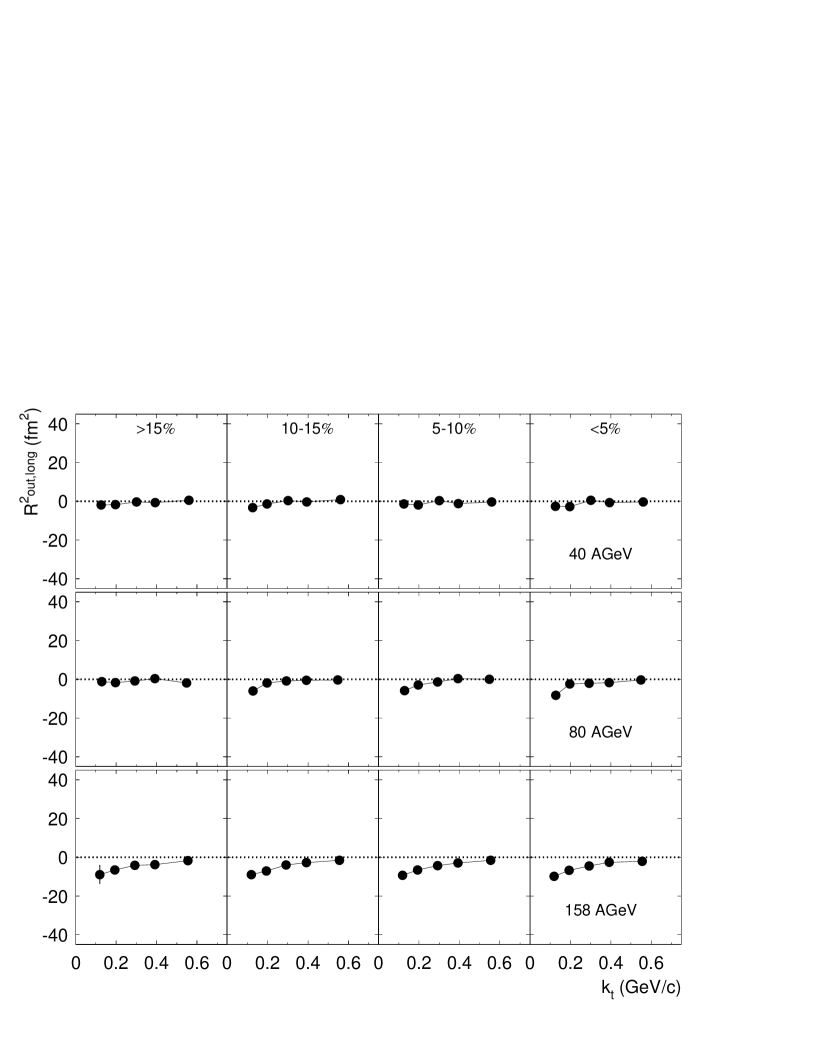
It has been proposed that the existence of a strong first order phase transistion and an accordingly long lived mixed phase would be observable by a large outward radius compared to , indicating a long duration of pion emission [4, 5, 6, 7, 8, 9]:
| (8) |
where is the average transverse velocity of the pion pair in the LCMS (0). The dependence of the parameter on is shown in Fig. 13. For comparison, is also shown by the solid lines. We observe a smooth increase of with centrality and beam energy. At 158 AGeV, the ratio / is larger than unity at small . While /1 was observed at large recently at RHIC, we see at the highest beam energy a ratio consistent with one, within the systematic uncertainties which are mainly imposed by the large corrections to .

The data do not support the scenario of a long-lived source at SPS: All observed radii are similar to at all beam energies and centralities. At the lowest beam energy is even slightly larger than . We note that was suggested as an indication for sources with surface dominated emission [34], such as emission from an expanding shell. At 158 AGeV, the data are consistent with a short but finite emission duration of about 2-3 fm/c, in agreement with results reported by NA49 previously [28].
The existence of a non-vanishing cross term would indicate space-time correlations of the pion emission points [22]. Such correlations occur if the longitudinal flow velocity of the source element with highest emissivity does not coincide with the average longitudinal velocity of the pions. For symmetry reasons, is expected to vanish at midrapidity and in sources with longitudinal boost-invariant expansion. Our results for the cross term are shown in Fig. 14. While is consistent with zero at 40 AGeV, we observe a smooth increase of its absolute value with beam energy at small . The small but non-zero results at the higher beam energies may be caused by a slight shift of the rapidity acceptance of the spectrometer away from midrapidity as the beam energy increases.

Pion interferometry data published by experiments at AGS and RHIC together with the data presented here can be combined to perform a systematic study of the source parameters over a wide range of beam energies. In Fig. 15 are shown the -dependences of , , and in central Pb(Au)+Pb(Au) collisions near midrapidity [35, 24]. No dramatic variation of the source parameters can be observed. However, a closer inspection reveals interesting features. The parameter is approximately constant from AGS to the lower SPS energies, but starts to increase significantly within the SPS regime and towards RHIC, indicating a smooth increase of the lifetime. is gradually decreasing at small up to top SPS energy, connected with a continuous flattening of the -dependence. At RHIC, is again larger than at the SPS while the shape is not yet well measured. In fact, the sample indicates further flattening. Naively, the flattening would indicate a decrease of the radial flow velocity as function of beam energy. This is in contradiction to the present interpretation of single particle transverse mass spectra, which indicate an increase of radial flow with beam energy [36]. The parameter shows a rather weak energy dependence and a slight minimum around the lowest SPS energy, where we find /1.
An investigation of the freeze-out conditions can be performed by relating the measured source parameters to an effective freeze-out volume:
| (9) |
computed for Gaussian density distributions in all three spatial dimensions. In the presence of collective expansion, does not comprise the total volume of the pion source at freeze-out but rather reflects a volume of homogeneity. If thermal freeze-out would occur at constant density [37], a linear scaling of with the charged particle multiplicity would be expected. Fig. 16 shows

, computed at 0.150.25 GeV/c, as function of the number of participants at 40, 80, and 158 AGeV. An approximately linear scaling with is indeed observed at all three energies. Since the number of charged particles was found to scale close to linear with at SPS [38, 39, 40], this is consistent with the assumption of a constant freeze-out density at a given beam energy. However, the observed beam energy dependence is at first glance surprising: the increase of pion multiplicity at midrapidity by about 70% from 40 AGeV to 158 AGeV [41] is not reflected in a corresponding increase of . Obviously, the freeze-out volume scales with multiplicity as long as multiplicity is controlled via centrality, but it does not scale accordingly as multiplicity changes with beam energy. We note that, according to experimental results, the ratios of particle species change very little with centrality for not too peripheral collisions, whereas they change significantly with beam energy. In a separate publication [42] we show that thermal pion freeze-out in general does not occur at constant density /, if relative abundancies of hadrons change. This is due to the different cross sections of pions with e.g. pions and protons, which explains that freeze-out occurs rather at constant mean free path =, where is the effective cross-section of the system with pions, averaged over all particle species in the final state: =1/.
5 SUMMARY AND CONCLUSIONS
We have presented a systematic study of two-pion interferometry data at SPS energies. We observe a smooth centrality and beam energy dependence of all HBT parameters; no indications for drastic changes of the space-time evolution have been found. The data at all centralities and beam energies under investigation suggest the existence of a pion source which rapidly expands in longitudinal and transverse direction. Assuming longitudinal boost-invariance, a duration of expansion of about 6-8 fm/c can be determined from the pair transverse momentum dependence of the longitudinal radius parameter , smoothly increasing with centrality and beam energy. The expansion is followed by a rather sudden freeze-out with a short duration of pion emission. At the time of freeze-out, the transverse r.m.s. radius of the system has increased by about a factor two compared to the dimension of the initial overlap region of the two colliding nuclei. This implies that the transverse area of the reaction has quadrupled. The transverse momentum dependence of the parameter indicates a high degree of collectivity and a radial flow velocity of about 0.55 in the most central collisions.
Studying the beam energy dependence of , there is a monotonic increase from top AGS energies to RHIC. Over the same range of beam energies there is a subtle but systematic flattening of the -dependence of . More studies are needed to understand the origin of this effect. The centrality dependence of the effective freeze-out volume is consistent with the assumption of pion freeze-out at constant particle density. However, this simple picture breaks down if different beam energies are compared. The key to understand this effect is in the consideration of the cross sections of different particle species with pions, as the relative abundances change with beam energy.
Acknowledgements
The CERES collaboration acknowledges the good performance of the CERN PS and SPS accelerators as well as the support from the EST division. We are grateful for excellent support for the central data recording from the IT division. For guidance in the design of the TPC we thank V. Eckardt, W. Klempt, E. Rosso, and B. Goret as well as G. Augustinski, A. Przybyla, and R. Ziegler for technical help. The new TPC readout in 2000 was only made possible through the strong support of F. Formenti, M. Jost, and G. Thomas. We wish to thank P. Filip, U. Heinz, P. Seyboth, and B. Tomášik for valuable discussions. This work was supported by the German BMBF, the U.S. DoE, the Israeli Science Foundation, and the MINERVA Foundation.
References
- [1] F. Karsch, E. Laermann, and A. Peikert, Nucl. Phys. B605 (2001) 579.
- [2] http://cern.web.cern.ch/CERN/Announcements/2000/NewStateMatter; U. Heinz and M. Jacob, nucl-th/0002042.
- [3] C. Hung and E. Shuryak, Phys. Rev. Lett. 75 (1995) 4003.
- [4] G. Bertsch, Nucl. Phys. A498, (1989) 173c.
- [5] S. Pratt, Phys. Rev. D33 (1986) 1314.
- [6] G. Bertsch, M. Gong, and M. Tohyama, Phys. Rev. C37 (1988) 1896.
- [7] G. Bertsch and G.E. Brown, Phys. Rev. C40 (1989) 1830.
- [8] D. Rischke, Nucl. Phys. A610 (1996) 88.
- [9] D. Rischke and M. Gyulassy, Nucl. Phys. A608 (1996) 479.
- [10] S. Pratt, Phys. Rev. Lett. 53 (1984) 1219.
- [11] A.N. Makhlin and Yu.M. Sinyukov, Z. Phys. C39 (1988) 69.
- [12] Yu.M. Sinyukov, Nucl. Phys. A498 (1989) 151c.
- [13] S. Pratt, T. Csörgő, and J. Zimanyi, Phys. Rev. C42 (1990) 2646.
- [14] CERES Collaboration, A. Marín et al., Nucl. Phys. A661 (1999) 673c.
- [15] CERES Collaboration, H. Appelshäuser et al., Nucl. Phys. A698 (2002) 253c.
- [16] CERES Collaboration, W. Schmitz et al., nucl-ex/0201002, J. Phys. G, in print.
- [17] H. Tilsner, PhD Thesis, University of Heidelberg (2002).
- [18] L. Dietrich, Diploma Thesis, University of Heidelberg (2001).
- [19] K. J. Eskola, K. Kajantie, and J. Lindfors, Nucl. Phys. B323 (1989) 37, for implementation see http://www.gsi.de/~misko/overlap
- [20] G. Baym and P. Braun-Munzinger, Nucl. Phys. A610 (1996) 286c.
- [21] D. Ferenc, U. Heinz, B. Tomášik, U. Wiedemann, and J.G. Cramer, Phys. Lett. B457 (1999) 347.
- [22] S. Chapman, P. Scotto, and U. Heinz, Phys. Rev. Lett. 74 (1995) 4400.
- [23] Yu.M. Sinyukov, R. Lednecky, S.V. Akkelin, J. Pluta, and B. Erazmus, Phys. Lett. B432 (1998) 249.
- [24] STAR Collaboration, C. Adler et al., Phys. Rev. Lett. 87 (2001) 082301.
- [25] STAR Collaboration, F. Laue et al., Nucl. Phys. A698 (2002) 177c.
- [26] B. Tomášik, U. Wiedemann, and U. Heinz, nucl-th/9907096.
- [27] P. Braun-Munzinger and J. Stachel, Nucl. Phys. A638 (1998) 3c.
- [28] NA49 Collaboration, H. Appelshäuser et al., Eur. Phys. J. C2 (1998) 661.
- [29] S. Chapman, J.R. Nix, and U. Heinz, Phys. Rev. C52 (1995) 2694.
- [30] T. Csörgő and B. Lörstad, Phys. Rev. C54 (1996) 1390.
- [31] R. Scheibl and U. Heinz, Phys. Rev. C59 (1999) 1585.
- [32] U. Wiedemann, Nucl. Phys. A661 (1999) 65c.
- [33] WA97 Collaboration, F. Antinori et al., J. Phys. G27 (2001) 2325.
- [34] H. Heiselberg and A.P. Vischer, Eur. Phys. J. C1 (1998) 593.
- [35] E895 Collaboration, M.A. Lisa et al., Phys. Rev. Lett. 84 (2000) 2798.
- [36] N. Xu and M. Kaneta, Nucl. Phys. A698 (2002) 306c.
- [37] I. Pomeranchuk, Dokl. Akad. Nauk SSSR 78 (1951) 884.
- [38] WA98 Collaboration, M.M. Aggarwal et al., Eur. Phys. J. C18 (2001) 651.
- [39] CERES Collaboration, D. Miśkowiec et al., Proceedings of the International Workshop XXX on Gross Properties of Nuclei and Nuclear Excitations, Hirschegg, Austria, January 13-19, 2002
- [40] WA97 Collaboration, E. Andersen et al., Phys. Lett. B449 (1999) 401.
- [41] NA49 Collaboration, S.V. Afanasiev et al., accepted for publication in Phys. Rev. C, nucl-ex/0205002.
- [42] CERES Collaboration, D. Adamová et al., submitted to Phys. Rev. Lett., nucl-ex/0207008.