Centrality Dependence of Inclusive Identified Hadrons in PHENIX
Abstract
Results of identified charged hadrons produced in Au+Au collisions at GeV as a function of centrality are discussed. The of protons and antiprotons is significantly larger than in p–p collisions at the same center of mass energy. Its scaling with the number of participant nucleons, an increase of from peripheral to central, may be due to radial expansion. In a hydrodynamical picture a simultaneous fit of pions, kaons and protons is consistent with a radial flow velocity of and a temperature of MeV for the 5% most central collisions. Dominant proton yields at GeV/c and antiproton yields at GeV/c may be explained by a combination of suppression of pion yields at high and the boost of low protons to high from radial flow.
1 Introduction
It is predicted by theoretical calculations that highly excited and dense hadronic matter undergoes a phase transition from a hadronic gas to a deconfined state of quarks and gluons called a Quark Gluon Plasma (QGP) [1]. A few s after the Big Bang [2], before nuclei and atoms were formed, the very hot and baryon free early universe may have existed in such a state of deconfinement.
The objective of relativistic heavy-ion physics is to produce an energy density in the overlap region between two colliding ions that is high enough to probe the phase transition between hadronic matter and quark matter. The quarks and gluons coexisting in a QGP state cannot be measured directly. The experimental challenge is to study a suite of observables that are indirect probes of plasma formation. The one observable that is measured and discussed here are the transverse momentum () spectra of produced hadrons, namely: pions, kaons and (anti)protons. Unlike photons and dileptons, the hadrons decouple late in the reaction due to strong interactions; therefore, the momentum spectra are sensitive to the system at freezeout.
If the collision can be described as an expanding, relativistic fluid, then hydrodynamic models with various equations of state can be used to predict the hadron spectra [3]. If both hydrodynamic behavior and longitudinal boost invariance are assumed, then the amount of expansion generated in the collision can be extracted from the data at low momenta ( GeV/c) using a hydrodynamics-inspired parameterization. Previously, the expansion of matter in Pb+Pb collisions at CERN SPS energies was similarly obtained from hadron spectra and HBT data [4, 5]. In addition, the measured yield of high hadrons may reveal the amount of partonic energy loss when compared to calculations in perturbative Quantum Chromodynamics (pQCD) parton models [6, 7].
The hadrons from Au+Au collisions at a roughly ten times higher energy density are measured at the Relativistic Heavy Ion Collider (RHIC) at Brookhaven National Laboratory (BNL). The PHENIX experiment at RHIC is described briefly in Section 2.
In the first year of data taking, the identified charged hadrons produced in five different event centralities at the collision energy of 130 GeV in Au+Au collisions are measured:0–5%, 5–15%, 15–30%, 30–60% and 60–92% of the total inelastic cross section of 6.8 b. The data reduction, corrections, extrapolations, and systematic uncertainties are summarized in Section 3. The centrality selected spectra, yields, mean transverse momenta (), and total charged multiplicity are presented in Section 4. An interpretation of the data based on radial, hydrodynamic expansion is provided in Section 5. The implications of the results are discussed in Section 6.
2 Experiment
2.1 The PHENIX detector
The PHENIX [8, 9, 10] detector is designed for the measurement of e, , , and identified hadrons over a large momentum range for GeV/c. It is comprised of four spectrometer arms: two at mid-rapidity called the central arms (“east” and “west”) and two at more forward rapidities called the muon arms (“north” and “south”). The central arm acceptance is with each arm subtending in azimuthal angle (). In the first year of physics running in 2000 (Run-1), half of the central arm detectors were instrumented, as shown in Fig. 1.
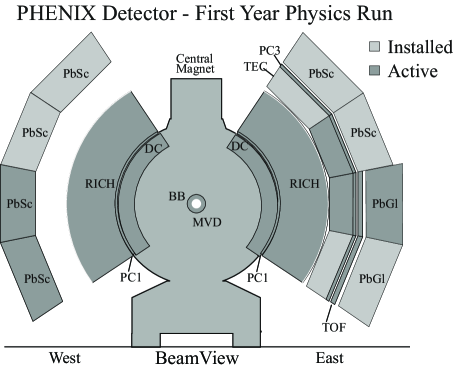
The two types of collision axis detectors, the Zero Degree Calorimeters (ZDC) and the Beam–Beam Counters (BBC) measure both the initial time and vertex position of each event. The ZDC resolution was % at the single neutron energy of GeV with an acceptance of . The BBC resolution was cm along the beam axis and ps in timing, with an acceptance of .
The time-of-flight detector (TOF) in the east arm subtends in and was used for the identification of , K±, and (anti)protons. The TOF measures the arrival time of charged hadrons at the TOF wall positioned 510 cm from the collision vertex. In Run-1, a timing resolution of 115 ps was obtained.
In Run-1, PHENIX had two layers of multi-wire proportional chambers with pad-readout (PC1, PC3) that measure a three-dimensional space point of a charged track. The points from PC1 are used in the global track reconstruction to determine the polar angle of the track. The PC3 positioned in the east arm is used to minimize the background contribution of albedo and non-vertex decay particles; it is used in the high- charged hadron analysis [7].
The drift chambers measure the track curvature between 202 and 246 cm radially, for which the particle momentum is determined. In Run-1, a resolution of was obtained. The absolute momentum scale was known better than 2%.
3 Data Reduction and Analysis
3.1 Event sample
A total of 5M minimum bias triggers were recorded at GeV in the PHENIX ZDC detectors. The event centrality was determined using a correlation measurement between the neutral energy deposited in the ZDCs and fast charged particles () recorded in the BBCs [11]. In order to minimize the amount of albedo from the central magnet pole faces, positioned at cm, only those events with a vertex distribution within cm were selected. Additional event criteria include the magnetic field setting and detector stability. The resulting event sample, minimum bias events, was % of the total inelastic cross section of 6.8 b [11]. The events were subdivided into five centrality classes: 0–5%, 5–15%, 15–30%, 30–60% and 60–92% of the total geometric cross section. In each centrality selection, the number of participating nucleons () and number of binary nucleon–nucleon collisions () were determined using a Monte Carlo Glauber model calculation [12].
3.2 Particle identification
Particle identification for charged hadrons was performed by combining the information from the tracking detectors with the timing information from the BBC and the TOF. Tracks at 1 GeV/c in momentum point to the TOF with a projected resolution of 5 mrad in azimuthal angle and 2 cm along the beam axis. Tracks that point to the TOF with less than 2.0 were selected.
The measured momentum (), path length (), and time of flight () in the spectrometer were used to calculate the particle mass, with in Eq. (1).
| (1) |
The width of the mass-squared distribution was calculated as a function of momentum, using the known detector resolutions and the relation in Eq. (2),
| (2) |
The constants are related to the measured drift chamber momentum resolution (, ) and combined flight path length and flight time errors (). Tracks that fell within 2 of a measured mass centroid were identified.
3.3 Corrections
The raw spectra include inefficiencies from detector acceptance, resolution, particle decays in flight and track reconstruction. Corrections for these effects were determined using a Monte Carlo simulation of the detector response. The baseline efficiencies were determined by simulating and reconstructing single hadrons. Multiplicity dependent effects were evaluated by embedding simulated single hadrons into real events, and measuring the degradation of the reconstruction efficiency. For each hadron, sufficient statistics were generated flat in azimuthal angle and rapidity for for every measured -bin such that the statistical error in the data dominates. The statistical errors from the correction factors were added in quadrature to the statistical errors in the data. Corrections for feed-down from weak decays were not applied, but an upper limit is estimated based on a MC simulation of particles within the PHENIX acceptance. More details on the corrections are reported elsewhere [13, 14].
3.4 Extrapolations
The yield integrated over transverse momentum, , and the integrated average transverse momentum, , were determined for each particle after fitting and integrating functions that describe the spectral shape. A power-law and exponential were fit to the pion data, while and exponentials were fit to each kaon and proton spectrum.
3.5 Systematic uncertainties
The overall uncertainty on is 13, 15 and 14 for pions, kaons and protons, respectively. Uncertainties on depend on the extrapolation and background uncertainties; the uncertainties are 7, 10 and 8 for pions, kaons and protons, respectively. An estimated 24% of the measured proton and anti-proton yields are due to weak decays, based on a Monte Carlo simulation.
4 Results
4.1 Transverse momentum distributions
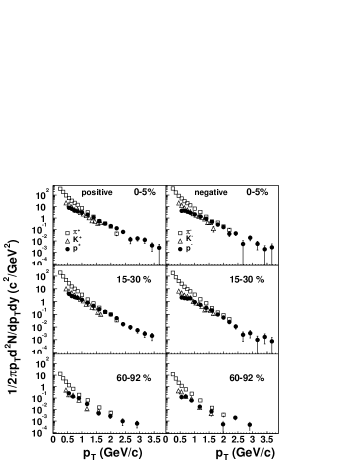
The , K±, p and invariant yields as a function of transverse momentum () for the most central, mid-central, and the most peripheral events are shown in Fig. 2. These data were reported previously [13].
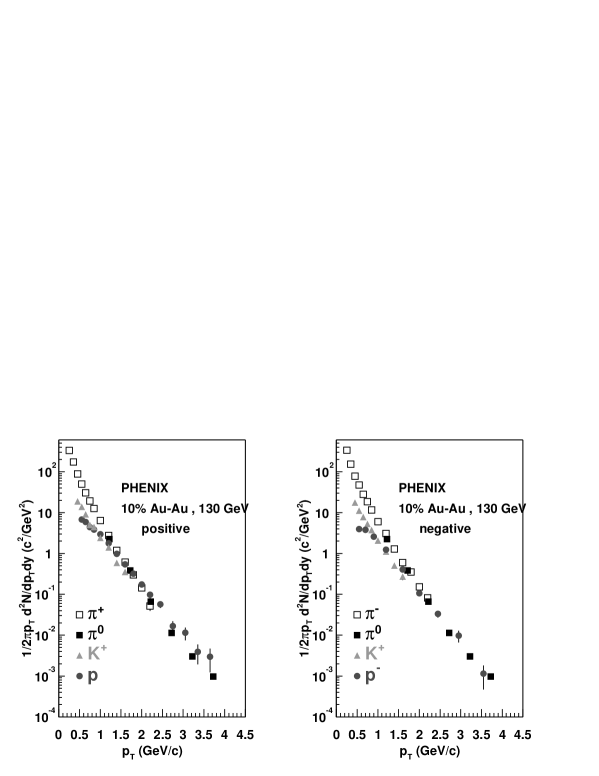
Transverse momentum spectra of non-identified charged hadrons and neutral pions were reported by PHENIX in the range GeV/c [7]. In Fig. 3, the data are shown with the charged pion data for the most central events. The comparison confirms the apparent baryon to meson dominance at GeV/c and GeV/c for positive and negative particles, respectively.
4.2 Yield and
The is normalized to pairs of participant nucleons for each centrality selection, as shown in Fig. 5. The dashed lines are the systematic uncertainties in the Glauber model calculation of the number of participant nucleons. The kaons and (anti)protons are scaled for clarity. The error bars include both statistical and systematic errors.
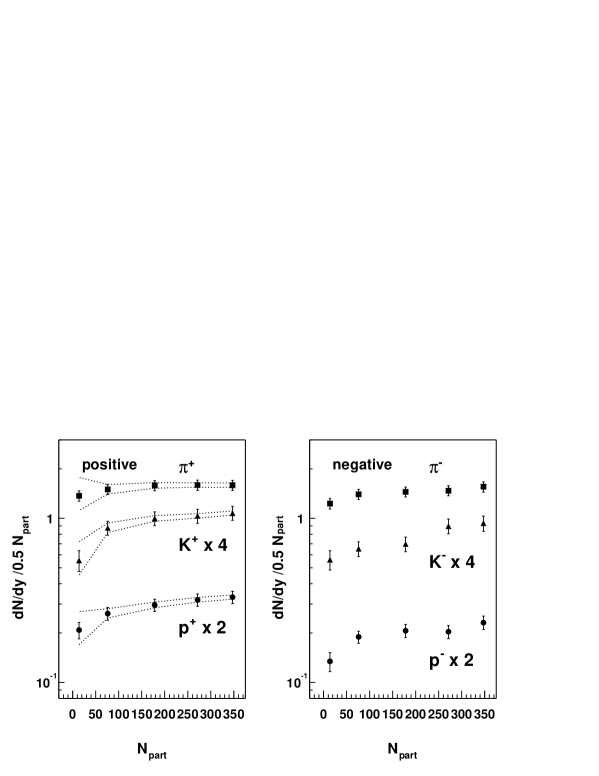
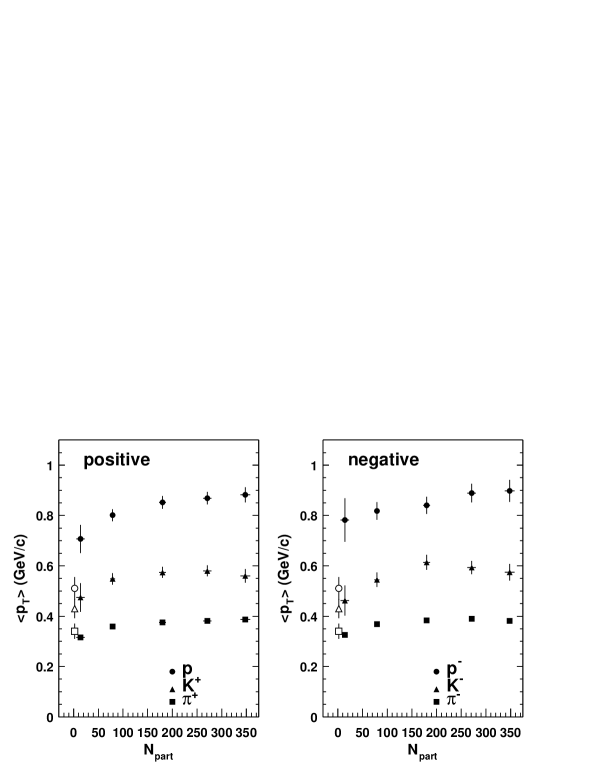
The mean transverse momentum increases with the number of participant nucleons by % for pions and protons, as shown in Fig. 5. The of particles produced in p–p and p– collisions, interpolated to RHIC energies, are consistent with the most peripheral pion and kaon data; however, the of protons produced in Au+Au collisions is significantly higher. This dependence on the number of participant nucleons may be due to radial expansion.
4.3 Charged particle multiplicity
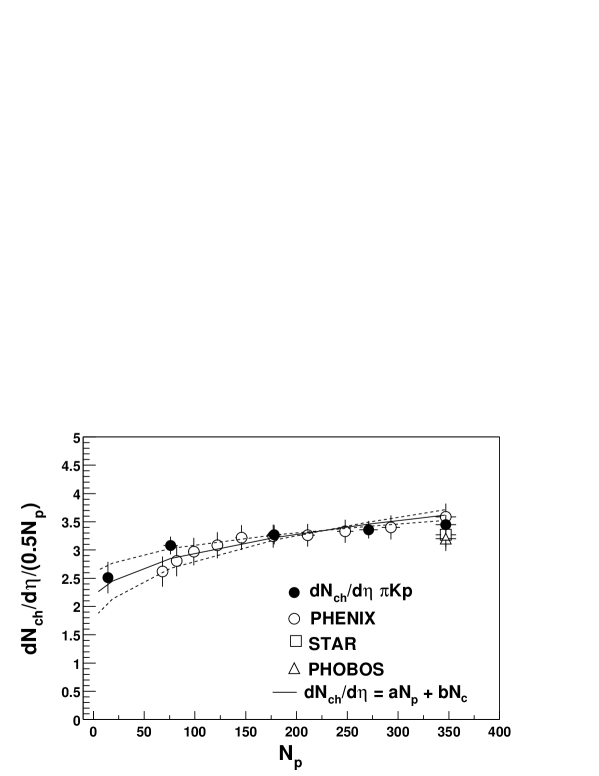
The measured for each hadron species is converted to , and the total is calculated after summation. In Fig. 6, the resulting per participant nucleon pair is within 5% when compared to the measurement made by PHENIX using the pad chambers alone [11]. The results from other RHIC experiments are also shown as a comparison.
5 Hydrodynamic Fits
5.1 Parameterization
Radial flow would impart a velocity boost to the hadrons. Heavy particles should be boosted to higher , depleting the cross section at lower , and resulting in a higher inverse slope in the spectrum. In order to measure the amount of radial expansion, a hydrodynamics inspired parameterization is used to fit all spectra simultaneously. The functional form used describes a boosted thermal source, and is based on relativistic hydrodynamics, see U. Heinz et al. in [15]. The particles are assumed to collectively expand with a velocity profile that is linear with the radial position. The particle density distribution is assumed to be a Gaussian in the radial position. In addition to longitudinal boost invariance, it is also assumed that all particles decouple kinematically on the freezeout hypersurface at the same freezeout temperature . The transverse velocity profile is parameterized as:
| (3) |
where , is the surface velocity, is the profile, and is the radius of the expanding source at freezeout ( in the case of a flat particle density distribution) [16]. Each fluid element is locally thermalized and is given a transverse rapidity boost that depends on the radial position as:
| (4) |
The dependence of the yield is calculated after integrating over the azimuthal, rapidity, and a final numerical integration over the radial components of the source
| (5) |
using the modified Bessel functions and . The parameters in Eq. (5) are the freezeout temperature , the normalization and the maximum surface velocity . A linear velocity profile () within the source is used. This choice was guided by the profile observed in a full hydrodynamical calculation by Kolb and Heinz.b
5.2 Simultaneous fits to data
The amount of radial expansion is determined by fitting all particle transverse momentum spectra simultaneously using Eq. (5) for GeV/c. We make a grid of combinations of temperature and velocity, and perform a chi-squared minimization to extract the normalization, , for each particle type. The fit is done simultaneously for all particles, with contours that show the anti-correlation of temperature and velocity. The resonance region in the pion spectra is excluded in the fit,b as was done in S+S collisions at the CERN SPS [20]. The resulting fits are plotted with the spectra for all centralities in Fig. 7.
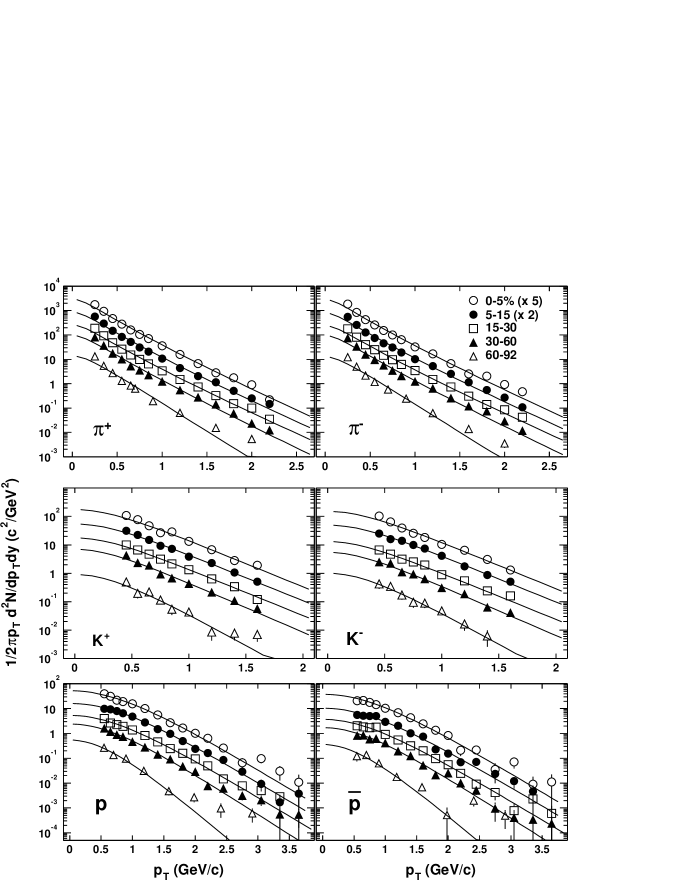
We find that the transverse momentum distributions are consistent with an expanding system with a surface velocity of which decouple at a common temperature of MeV. For the 5–15% centrality, the fit results are MeV and .
In [7], the hadron multiplicities at high are different for mesons and baryons. The suppression of pion yields at high and the boost of low protons to high from radial flow may explain the dominant proton and antiproton yields at GeV/c and GeV/c, respectively.
5.3 Systematic uncertainties
We find that Eq. (5) is consistent with a full hydrodynamic calculation when a linear velocity profile is used [14]. Nevertheless, a parabolic profile results in an increase of 13% in and 5% in . A constant particle density distribution used with a linear velocity profile decreases by 2% with a negligible difference in the temperature . As a test of the assumption that all the particles freezeout at a common temperature, the simultaneous fits were repeated for pions and protons only. The difference in is negligible within the measured uncertainties. The effect of including the pion resonance region in the simultaneous fit decreases by 20 MeV.
6 Conclusions
Identified charged hadrons produced in Au+Au collisions at 130 GeV in five different centrality selections have been measured. Proton and antiproton yields at high dominate over pion yields in central collisions when compared to the PHENIX measured data up to GeV/c. A combination of suppression of pion yields at high and the boost of low protons to high from radial flow may be an explanation.
Acknowledgements
This work was performed under the auspices of the U.S. Department of Energy by the University of California, Lawrence Livermore National Laboratory under Contract No.W-7405-Eng-48.
Notes
-
a.
E-mail: janebh@llnl.gov
-
b.
The resonance region affects the spectral shape at GeV/c based on model calculations by Peter Kolb and Ulrich Heinz (private communication).
References
- [1] E.V. Shuryak, Phys. Rep. 61 (1980) 71.
- [2] J.D. Bjorken, Phys. Rev. D 27, No. 1 (1983).
- [3] C.M. Hung and E. Shuryak, Phys. Rev. C 57 (1998) 1891.
- [4] I. Bearden et al., Phys. Rev. Lett. 78 (1997) 2080.
- [5] A. Appelshauser et al., Eur. Phys. J. C 2 (1998) 661.
- [6] X.N. Wang, Phys. Rep. 280 (1997) 287.
- [7] K. Adcox et al., Phys. Rev. Lett. 88 (2002) 022301.
- [8] D. Morrison et al., Nucl. Phys. A 638 (1998) 565.
- [9] W. A. Zajc, Nucl. Phys. A 698 (2002) 39.
- [10] K. Adcox et al., to be submitted to Nucl. Instr. Meth. A (2002).
- [11] K. Adcox et al., Phys. Rev. Lett. 86 (2001) 3500.
- [12] K. Adcox et al., Phys. Rev. Lett. 88 (2002) 022301.
- [13] K. Adcox et al., submitted to Phys. Rev. Lett. (2001) [nucl-ex/0112006].
- [14] K. Adcox et al., to be submitted to Phys. Rev. C (2002).
- [15] E. Schnedermann, J. Sollfrank and U. Heinz, Phys. Rev. C 48 (1993) 2462.
- [16] S. Esumi, S. Chapman, H. van Hecke and N. Xu, Phys. Rev. C 55 (1997) R2163.
- [17] K. Adcox et al., Phys. Rev. Lett. 86 (2001) 3500.
- [18] C. Adler et al., Phys. Rev. Lett. 87 (2001) 112303.
- [19] B.B. Back et al., Phys. Rev. Lett. 85 (2000) 3100.
- [20] J. Sollfrank, P. Koch and U. Heinz, Phys. Lett. B 252 (1990) 256.
- [21] J.T. Mitchell et al., Nucl. Inst. Meth. A 482 (2002) 498.