Ratios of charged antiparticles to particles near midrapidity in Au+Au
collisions at 200 GeV
Abstract
The ratios of charged antiparticles to particles have been obtained for pions, kaons, and protons near midrapidity in central Au+Au collisions at GeV. Ratios of , , and have been observed. The and ratios are consistent with a baryochemical potential of 27 MeV, roughly a factor of 2 smaller than in GeV collisions. The data are compared to results from lower energies and model calculations. Our accurate measurements of the particle ratios impose stringent constraints on current and future models dealing with baryon production and transport.
PACS numbers: 25.75.-q
In this paper, the ratios of antiparticles to particles for primary charged pions, kaons, and protons in central Au+Au collisions at GeV were determined using data from the PHOBOS detector. The data were taken during the 2001 run of the Relativistic Heavy-Ion Collider (RHIC) at Brookhaven National Laboratory. The experiments at the RHIC aim at understanding the behavior of strongly interacting matter at high temperature and density, testing predictions of quantum chromodynamics (QCD).
Earlier studies showed that the ratio increases from 0.1 observed in fixed-target experiments at GeV[1, 2] at the SPS to a value of observed in PHOBOS at GeV[3] which is in agreement with the values observed by the other RHIC experiments[4, 5, 6]. Nucleus + nucleus (A+A) collisions at the RHIC have reached a regime where the fraction of baryons at midrapidity is not dominated by baryon transport alone. Therefore, these collisions are approaching the net baryon-free regime for which experimental results can be directly compared to first-principle QCD calculations. The particle ratios at 130 GeV were shown to be consistent with statistical models of particle production [7], assuming chemical equilibrium. These models gave a very good description of the particle ratios with an assumed hadronization temperature of 175 MeV and a baryochemical potential MeV. However, it proved difficult to explain the results in terms of microscopic descriptions of the evolution of the particle source using hadronic transport models [3, 8, 9].
The data in this paper allow further tests of models of baryon production and baryon number transport in nuclear collisions, using a study of the energy dependence of particle ratios between GeV and GeV. The results were obtained using the PHOBOS two-arm magnetic spectrometer. Details of the setup have been previously described[10, 11, 12]. Each arm has a total of 16 layers of silicon sensors (corresponding to 50000 pixels), providing tracking both outside and inside the 2-T field of the PHOBOS magnet. For this analysis, only the central region of each arm was used, covering around the axis of the experiment in the horizontal plane. As three silicon layers do not extend into this geometrical acceptance region, particles within this acceptance region typically traversed 13 silicon layers. A two layer silicon detector (VTX) covering and 25% of the azimuthal angle provided additional information on the position of the primary collision vertex. The two arms and frequent magnetic field polarity reversals allowed for many independent checks in the determination of particle ratios. The use of highly segmented silicon detectors, beginning at 10 cm from the interaction point, result in systematic errors in the correction to the ratios from secondaries and hyperon decays of 2% or less.
The primary event trigger was provided by two sets of 16 scintillator paddle counters, which covered a pseudorapidity range . Additional information for event selection was obtained from two zero-degree calorimeters which measured spectator neutrons[13]. Details of the event selection and centrality determination can be found elsewhere [14, 15]. Monte Carlo (MC) simulations of the apparatus were based on the HIJING event generator [8] and the GEANT 3.21 simulation package, folding in the signal response for scintillator counters and silicon sensors.
For this analysis, events with the 12% highest cross section were selected. A Glauber calculation was used to relate the fraction of the cross section to the number of participating nucleons, [14, 15]. The average number of participants for these events was estimated to be . The data used in this analysis was taken during the first two months of RHIC 2001 running and represents only 10% of the total data set.
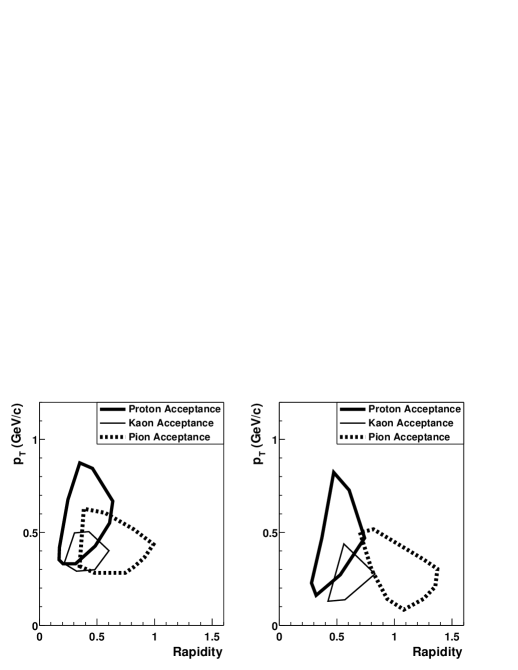
The geometrical layout of the PHOBOS detector led to an asymmetry in the acceptance and detection efficiency for positively and negatively charged particles, and , at a given magnet polarity, or (see Fig. 1). Particle and antiparticle yields obtained with opposite field polarities were used to calculate the , , and ratios as in Eqs. (1).
| (1) |
It is assumed in the analysis (and checks were performed to verify this) that the acceptance and efficiency for a specific particle type at is identical to the acceptance and reconstruction efficiency for the antiparticles of that type at , and vice versa. This measurement requires the further assumption that the dependence of the particle and antiparticle yields within our acceptance is similar.
The reproducibility of the absolute field strength was found to be better than 1%, based on Hall probe measurements for each polarity and the comparison of mass distributions for identified particles for the two polarities. The trigger event selection was checked using the number of reconstructed straight line tracks in the low magnetic field region. These numbers agreed to within 0.35% for the and data sets. An asymmetry in either the total field strength or the trigger selection would shift one of the measurements of each ratio in Eqs. (1) up while the other would shift down. Since each shift is equal (and small), this divergence between the two measurements for each particle type in Eqs. (1) cancels in the average.
Only events with a reconstructed primary vertex position between -6 cm 6 cm along the beam axis were included in this analysis. This vertex selection ensures that both particles and antiparticles can be tracked and identified in the spectrometer for both bending directions, and thus reduces vertex-position-dependent systematic effects. The vertex position was determined by two methods. One method combined information from both spectrometer arms and the vertex detector (“global vertex”) and the other only used information from the arm for which the ratios were being measured (“local vertex”). The global vertex is more precise, but can be affected by misalignments between the detectors while the local vertex is less precise, but insensitive to misalignment between the different detectors.
The steps of the track reconstruction algorithm have been previously described[3]. For the present analysis, an additional track fitting step was added, which takes into account the correlations between hit positions along the track. The final track selection was based on the probability of this fit, improving the rejection of tracks with incorrectly assigned hits and thereby improving momentum and particle identification resolution.
Particle identification was based on the truncated mean of the specific ionization observed in the silicon detectors. The identification cuts for pions, kaons, and protons are shown in Fig. 2. The corresponding acceptance regions for identified particles in transverse momentum and rapidity are shown in Fig. 1.
The accuracy of the ratio determination relies on the precise cancellation of acceptance, efficiency, and background effects between the two magnet polarity settings. To allow a detailed cross-check of this cancellation, the data were divided into statistically independent subsets (see Table I). The first division was necessitated by a significant transverse shift in the beam orbit (0.5 mm) at one point during data taking. Data before and after this shift were analyzed separately. The data from the two spectrometer arms were also analyzed separately. This resulted in four statistically independent subsets. These four subsets resulted in eight independent measurements of each ratio (each bending direction in the magnet gives a separate measurement). Each data set was analyzed using both the local and the global vertex position, resulting in a total of 16 measurements of each ratio.
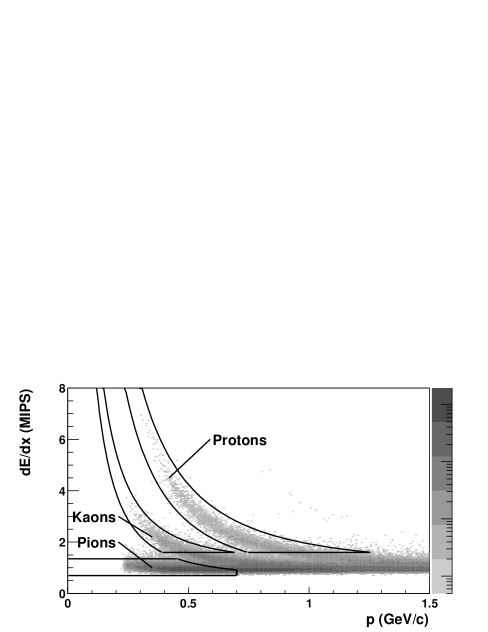
Table I gives the event and identified particle statistics for all combinations of magnet polarity, particle charge, particle species, spectrometer arm and beam orbit condition. The table contains the results using both the global vertex and the local vertex as the starting point for the track finding. The systematic uncertainty due to the vertex finding method was extracted from the distribution of half of the difference between the value found using the global vertex and the value using the local vertex. The rms of this distribution, used as an estimate of the systematic uncertainty, was found to be for , for , and for .
To perform consistency checks, Eqs. (1) were used to calculate , , and for each of the eight statistically independent data sets. To check if a systematic deviation exists between ratios calculated in separate spectrometer arms, a weighted average of the four ratios calculated in the positive spectrometer arm was compared against a weighted average of the four ratios calculated in the negative spectrometer arm. Half of this difference was taken as an estimate of the systematic error associated with ratios calculated in separate spectrometer arms. As the pion ratios have the smallest statistical error, they possess the best ability to resolve systematic deviations. Therefore, if this difference for kaons or protons does not exceed a one sigma statistical deviation, half the pion difference was used. This same method was performed to estimate systematic errors associated with the other two divisions of the data. The results of these checks showed that no deviation was evident beyond the statistical errors for kaons or protons so the pion ratio’s estimate of for the beam orbit division, for the arm division, and less than for the bending direction division was applied to the kaons and protons.
Table I also shows the average transverse momentum, , of identified particles, not corrected for acceptance and efficiency. For all particle species, the of accepted particles at one magnet polarity agree to within with the of the accepted antiparticles at the opposite polarity. Also, the average rapidity and the second moments of and distributions for accepted particles and antiparticles agree within errors. As a consequence, no acceptance corrections were made to the particle ratios.
| Beam orbit condition 1 | ||||||||
| :23725 events | :20965 events | |||||||
| Narm | ||||||||
| 8532 | (8286) | 12501 | (12935) | |||||
| 14298 | (14692) | 7643 | (7472) | |||||
| 200 | (195) | 241 | (255) | |||||
| 243 | (250) | 208 | (198) | |||||
| 458 | (472) | 396 | (405) | |||||
| 319 | (324) | 293 | (291) | |||||
| Parm | ||||||||
| 7139 | (7273) | 13172 | (13423) | |||||
| 14961 | (15344) | 6432 | (6569) | |||||
| 215 | (223) | 280 | (290) | |||||
| 308 | (310) | 179 | (182) | |||||
| 409 | (427) | 424 | (433) | |||||
| 327 | (346) | 267 | (264) | |||||
| Beam orbit condition 2 | ||||||||
| :28785 events | :13824 events | |||||||
| Narm | ||||||||
| 10471 | (10248) | 7407 | (7759) | |||||
| 16607 | (17267) | 5083 | (4990) | |||||
| 304 | (302) | 137 | (154) | |||||
| 278 | (305) | 135 | (124) | |||||
| 612 | (606) | 248 | (262) | |||||
| 398 | (407) | 195 | (193) | |||||
| Parm | ||||||||
| 8322 | (8574) | 8746 | (8946) | |||||
| 18680 | (19181) | 4229 | (4350) | |||||
| 238 | (249) | 202 | (193) | |||||
| 396 | (398) | 106 | (104) | |||||
| 542 | (565) | 289 | (298) | |||||
| 418 | (434) | 179 | (197) | |||||
After the systematic uncertainties of the raw particle ratios were determined, the weighted average and statistical error for each of the three ratios was obtained. The errors associated with vertex finding method and consistency checks were added in quadrature to give an estimate of the total systematic error. The result was , , and for pions, kaons, and protons, respectively.
Contamination of the proton and kaon samples by misidentified particles was checked by testing the stability of the particle ratios against variations of the particle-ID cuts shown in Fig. 2. Within the statistical error the ratios were stable against changes of these cuts. The effect of pion contamination on was estimated by modeling the pion’s truncated energy loss distribution as a function of momentum. A conservative estimate of the number of pions falling within the proton and antiproton cut region produced a correction of less than 0.8% to , which is reflected in its systematic error. This same correction for was estimated to be less than 0.1%. For pions, electron contamination to was estimated to be less than 0.2% based on studies carried out using GEANT simulations with HIJING events.
To represent the ratios of primary particles produced in the collision, the detected particle ratios have to be corrected for particles produced in secondary interactions, loss of particles due to absorption in detector material, and feeddown particles from weak decays. Secondary and feeddown corrections were described in detail in the GeV paper [3]. As in that analysis, these corrections were minimized by requiring tracks to point back to the vertex within 3.5 mm. The total effect of all corrections to the pion and kaon ratios was estimated to be less than 1%; this correction is reflected in the systematic error.
Corrections to are more significant. The secondary correction from the production of protons in the beampipe and detector material was found to be 0.7%. This correction is very small in the spectrometer for the following reasons. Secondary protons tend to be produced at low momentum. High multiple scattering at low momentum makes detection efficiency of such secondaries small. Particles are also required to pass through at least 11 silicon layers. Low momentum particles tend to bend out of the acceptance (as can be seen from Table I, where the of protons and antiprotons is above 450 MeV). The number of secondary particles produced scales with the number of primary particles produced, mostly pions. The correction is calculated using HIJING events and, therefore, depends on how well HIJING reproduces the measured ratio and their momentum distributions. Measurements of at 130 GeV[5] are consistent with the values from HIJING at the same energy. A systematic error of the size of the correction (1%) is conservatively assigned.
The absorption correction arises from an asymmetry in the loss of antiprotons versus protons interacting in the beampipe and planes of the spectrometer. A momentum dependent correction is used. Only GEANT’s ability to model interactions in material plays a role in this correction. The hadronic interaction packages Gheisha and Fluka were both tested. Gheisha produced a correction of 5.1% while Fluka produced a correction of 2.2% The correction was therefore estimated from the average as 3.7% with a systematic error contribution of 1.6% taking into account the errors on each individual package’s result and the difference between those results. This correction was found to be consistent with analytic calculations.
The feeddown correction is calculated from Eq. (2):
| (2) |
This accounts for the difference in the number of hyperons (primarily and ) decaying to protons versus antiprotons. is the fraction of protons from lambdas or antiprotons from antilambdas detected within our acceptance and is the branching ratio for or . equals 0.3 averaged over . The dependence of is weak due to two competing effects at high and low momentum. Higher momentum hyperons decay later due to time dilation. The decay particles from these hyperons have a reduced chance of being reconstructed because they are more likely to decay past the first planes of silicon in our spectrometer. Lower momentum hyperons have decay particles which deviate more from the original path of their parent and, therefore, have a lower chance of pointing back to the primary vertex. The derivation of Eq. (2) assumes that protons and antiprotons have the same momentum distribution within our acceptance as lambdas and antilambdas and that the decay proton or antiproton takes most of the momentum of the lambda or antilambda. The value of was estimated using a coalescence model to relate this value to , which is measured in this analysis. Values of , , and were consistent with coalescence at 130 GeV[3, 16]. A value of , based on the measured value at 130 GeV[16], was used for the correction. The indicated error in this value includes the statistical and systematic errors in the measurement at 130 GeV (0.09 and 0.22, respectively), and an uncertainty associated with the energy dependence of this ratio. The value of was allowed to vary between 0.9 and 1.0 (the total variance allowed by our measurement). This produced a 1.2% correction with a systematic error contribution of 2.2%.
After all corrections we find the following ratios within our acceptance:
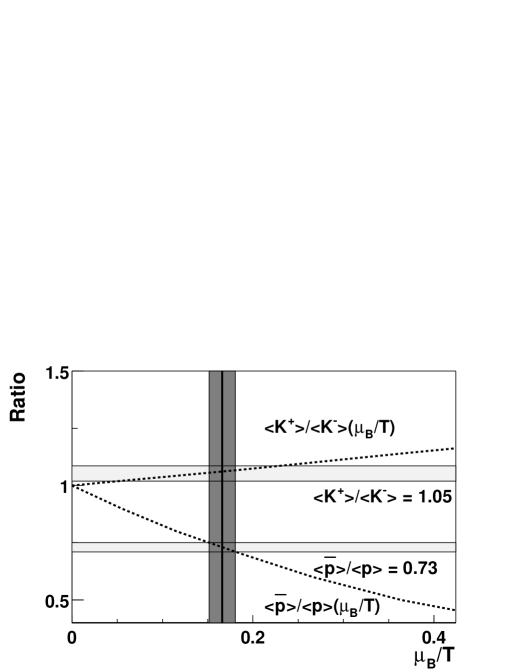
The measured value for agrees well with the predicted thermal model value of 0.75 at 200 GeV [17]. This model assumes baryon number, strangeness, and charge conservation and, as such, strictly applies to 4 integrated particle ratios. The prediction is based on a phenomenological fit to lower energy data, showing that the particle ratios at RHIC follow the trend observed at lower energies. Using the same statistical model calculation [18] as for our 130-GeV data[3], we estimate . This estimate is consistent with the value of extracted from as shown in Fig. 3. For a typical chemical freeze-out temperature of 165 MeV, this estimate corresponds to MeV, which is about half of the 130-GeV value of MeV [3].
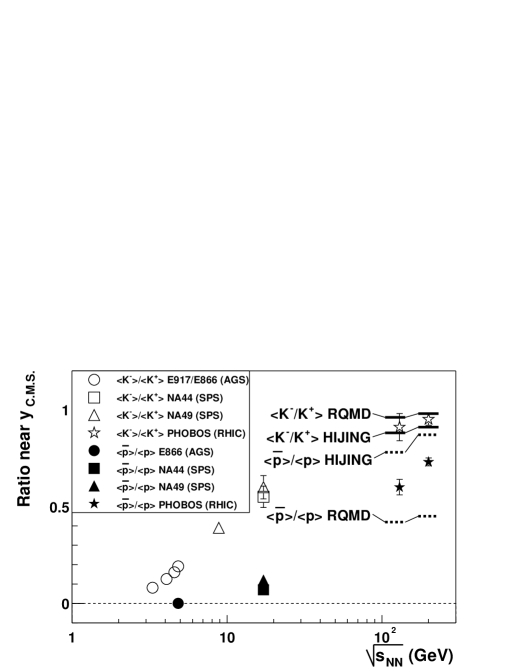
Our results are compared to lower energy data from fixed target experiments[1, 2, 19] and our 130-GeV measurement at the RHIC[3] in Fig. 4. Also shown are the results of calculations using HIJING[8] and RQMD[9] for 130 and 200 GeV. As was already observed at 130 GeV[3], both HIJING and RQMD do not agree with the observed value of .
In conclusion, the data shown in this paper provide the first information on the baryon density in central Au+Au collisions at the full RHIC energy. The observed ratios are in agreement with expectations of statistical equilibrium models. A comparison with two hadronic transport codes shows a significant disagreement with the ratios measured in this analysis. These ratios provide stringent constraints on current and future models dealing with baryon production and transport. Future analysis of p+p and d+Au collisions should provide information on the effect of multiparticle interactions on particle production.
This work was partially supported by U.S. DOE grants DE-AC02-98CH10886, DE-FG02-93ER40802, DE-FC02-94ER40818, DE-FG02-94ER40865, DE-FG02-99ER41099, and W-31-109-ENG-38 as well as NSF grants 9603486, 9722606 and 0072204. The Polish groups were partially supported by KBN grant 2-PO3B-10323. The NCU group was partially supported by NSC of Taiwan under contract NSC 89-2112-M-008-024.
REFERENCES
- [1] I. G. Bearden et al., Phys. Lett. B 388, 431 (1996).
- [2] J. Bächler et al., Nucl. Phys. A661, 45 (1999).
- [3] B. B. Back et al., Phys. Rev. Lett. 87, 102301 (2001).
- [4] I. G. Bearden et al., Phys. Rev. Lett. 87, 112305 (2001).
- [5] K. Adcox et al., preprint, nucl-ex/0112006 (unpublished).
- [6] C. Adler et al., Phys. Rev. Lett. 86, 4778 (2001).
- [7] D. Magestro, hep-ph/0112178 (unpublished).
- [8] M. Gyulassy and X. N. Wang, Comput. Phys. Commun. 83, 307 (1994). We used HIJING V1.35 with standard parameter settings.
- [9] H. Sorge, Phys. Rev. C 52, 3291 (1995). We used version 2.4, including rope formation.
- [10] B. Back et al., Nucl. Phys. A661, 690 (1999).
- [11] H. Pernegger et al., Nucl. Instrum. Methods Phys. Res. A 419, 549 (1998).
- [12] B. B. Back et al., Nucl. Phys. A698, 416 (2002).
- [13] C. Adler et al., Nucl. Instrum. Methods Phys. Res. A 461, 337 (2001).
- [14] B. B. Back et al., Phys. Rev. Lett. 85, 3100 (2000).
- [15] B. B. Back et al., Nucl. Phys. A698, 555 (2002).
- [16] K. Adcox et al., preprint, nucl-ex/0204007.
- [17] P. Braun-Munzinger, D. Magestro, K. Redlich, and J. Stachel, Phys. Lett. B 518, 41 (2001).
- [18] F. Becattini, J. Cleymans, A. Keränen, E. Suhonen, and K. Redlich, Phys. Rev. C 64, 024901 (2001).
-
[19]
L. Ahle et al., Phys. Lett. B 490, 53 (2000);
Phys. Rev. C 60, 064901 (1999);
Phys. Rev. Lett. 81, 2650 (1998).