Has Nucleonic Matter at the Critical Point Been Produced in Recent Multifragmentation Experiments?
Abstract
For nuclei in five different mass regions the critical temperatures, at which the surface tension vanishes, are derived from information on the liquid branch of the coexistence curve. These critical temperatures increase with increasing mass and, for higher masses are well above recently reported critical temperatures obtained from Fisher Droplet model and percolation model analyses. However, for the lowest mass region nuclei, with , this analysis indicates that nucleonic matter has been produced essentially at the critical point, characterized by Tc and .
pacs:
24.10.i,25.70.GhThe experimental and theoretical study of possible critical behavior in a nuclear fluid has occupied a considerable place in many contemporary studieschomaz02 ; dasgupta01 ; bonasera00 ; moretto02 ; elliott02_1 ; kleine02 ; elliott02_2 ; raduta01 . Given the complexity of nuclear collisions there is no a priori reason why collisional excitation of a nucleus, with its associated dynamic evolution should lead to a trajectory through the critical point of the nucleonic matter phase diagram and ascertaining whether the actual critical point has been reached can be very difficult. Nevertheless, several papers have presented evidence for the observation of critical behavior in data from reactions of 1 GeV/nucleon 197Au, 139La and 86Kr with 12C, taken by the EOS grouphauger98 ; hauger00 and data from reactions of high energy pionsbeaulieu00 and protonsbeaulieu01 with197Au taken by the ISiS group. A Fisher Droplet model analysisfisher67 ; fisher69 of multifragmentation data for 8 GeV/c + 197Au resulted in a critical temperature of MeV and elliott02_1 . In a percolation analysis of 10.2 GeV/c p + 197Au data critical temperature of MeV was determinedkleine02 . In a very recent paperelliott02_2 , results from a Fisher Droplet model analysis of the nuclear “vapor” have been combined with a very interesting analysis based upon the Principle of Corresponding States, first elucidated for behavior of various atomic and molecular gasesguggenheim45 ; guggenheim93 . In that work critical densities, = and critical temperatures of , , and MeV have been reported, respectively, for products of the reactions of 12C with 197Au, 139La and 86Kr nucleielliott02_2 .
In this letter we apply the corresponding states analysis to information derived from the liquid branch of the coexistence curve. We conclude that the critical temperatures of nuclei increase significantly with increasing nuclear mass. The values we derive are generally well above the reported critical temperatures, except in the lowest mass range analyzed. In that mass range, , it appears that nuclei have been produced at densities and temperatures which are at, or very close to, those of the critical point.
We have recently carried out analyses of existing caloric curve data obtained in a variety of nuclear reaction studiesnatowitz02 . These analyses provided evidence for mass dependent limiting temperatures and excitation energies for nuclei. These limiting temperatures, and excitation energies are presented in Table 1. The temperature values were found to be in good agreement with predicted Coulomb instability temperaturesbonche86 ; levit85 ; besprovany89 calculated with theoretical models employing modern microscopic nucleon nucleon interactionszhang96 ; zhang99 . This general agreement has been exploited to derive the critical temperature of symmetric nuclear matter, T MeV as well as other information on the nuclear equation of statenatowitz02_1 .
| Limiting and Critical Parameters (This work) | ||||
| Mass | Tlimnatowitz02 | T | E∗ | |
| 45 | ||||
| 80 | ||||
| 120 | ||||
| 160 | ||||
| 210 | ||||
| Critical Parameters (Earlier work) | ||||
| Mass | Tcrit | Reference | E | |
| 65 | elliott02_2, | |||
| 106 | elliott02_2, | |||
| 140 | elliott02_2, | |||
| 160 | elliott02_1, | |||
| 168 | kleine02, | |||
The critical temperatures and excitation energies derived in referenceselliott02_1 ; kleine02 ; elliott02_2 are also listed in Table 1 together with the masses of the disassembling nuclei actually sampled at those critical excitation energieshauger98 ; hauger00 ; beaulieu00 ; beaulieu01 . They are seen to be reasonably close to the limiting temperatures derived from the caloric curve measurements in the same mass rangenatowitz02 . Limiting temperatures resulting from Coulomb instabilities would normally be expected to fall below the critical temperatures of the corresponding nuclei as can be easily demonstrated in theoretical calculations by turning off the Coulomb interactionbonche86 . Thus the closeness of the temperatures at which apparent critical behavior is observed to the limiting temperatures seen in the caloric curves is somewhat surprising. In assessing the significance of the differences seen it should be noted that the excitation energies and the temperatures derived from the caloric curve analyses are those corresponding to the onset of the entry into a caloric curve plateaunatowitz02 while the excitation energies extracted from the percolation and Fisher droplet model analyses are those corresponding to the points where apparent critical behavior is observedelliott02_1 ; kleine02 ; elliott02_2 . In those works the temperatures are then derived from the excitation energies assuming a Fermi gas behavior and assigning a level density parameter. As a result these latter temperatures are not necessarily the same as the experimental values reported at those excitation energies. This by itself may be responsible for some of the temperature differences observed in Table 1 and suggests that a comparison of the excitation energies is perhaps more meaningful. As seen in the table the critical excitation energies tend to be slightly higher than the excitation energies at the entrance into the plateau.
In referencenatowitz02_2 it was pointed out that an analysis of the caloric curves, carried out assuming a nondissipative uniform Fermi gas model, indicates a rapidly increasing expansion of the nuclei with increasing excitation energy above the excitation energy where the limiting temperatures are reached. In that work an iterative technique was employed to derive self consistent values of the thermal excitation energy, , and the relative density, . The densities derived in the early part of the plateau region of the caloric curve region were found to be natowitz02_2 . Such densities are generally well above the values of 0.3 to 0.39 derived at similar excitation energies from the Fisher Droplet and Corresponding States analyseselliott02_1 ; elliott02_2 . Only as the excitation energy is further increased are such densities reached in the caloric curve analysis. (See Table 1.) Thus it appears that the results from the two different methods are in contradiction.
To further explore this contradiction we have attempted to carry out a corresponding states analysis requiring that the results be consistent with our knowledge of temperature and density information for the liquid branch of the coexistence curve. The temperatures are readily available from the caloric curve but, for excitation energies below the plateau region of the caloric curve, the technique we have employed to derive densities is not applicable as shell, surface and effective mass effects reduce the inverse level density parameter well below its Fermi gas valueshlomo90 ; shlomo91 . However, as pointed out in referencenatowitz02_2 densities estimated from a model which assumes a trapezoidal density distribution and phenomenological dependencies on temperature derived from previous works are in good agreement with results of microscopic model calculations. Thus in the following, we estimate the average densities at excitation energies below the onset of the plateau region using this model. We then take these average densities, together with the experimental temperatures determined at those excitation energies as defining the liquid branch of the liquid vapor coexistence curve.
As pointed out in references moretto02, ; elliott02_1, ; elliott02_2, , the Principle of Corresponding States as developed by Guggenheim for inert gases results in a universal empirical scaling of / vs. T/Tc of the form.
| (1) |
Where b1 and b2= (1+ b1) are empirical constants, is a constant equal to 0.33, the + sign between the second and third terms is valid for the liquid(l) branch and the – sign is valid for the vapor(v) branch of the coexistence curve. In the original scaling proposed by Guggenheim for macroscopic systems b1is . Elliott et al. have pointed out that the constant appropriate to a microscopic system is less as is demonstrated by with Ising model calculations for different sized cubic latticeselliott02_2 . The analysis of Elliott et al. indicates a value of b1 near 0.3 for the nuclei studiedelliott02_2 . In the following we have derived values of Tc with fixed values of b and b and . We have also evaluated the uncertainties on the derived values of Tc and which results from varying these parameters slightly.
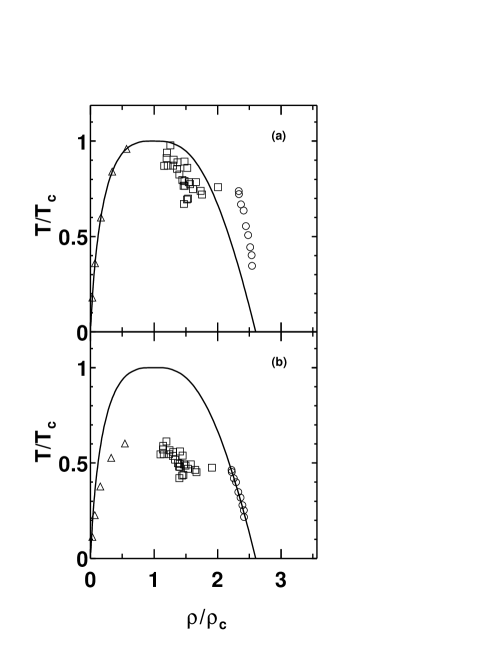
To illustrate the procedure which we have followed, we present in Figure 1a the results obtained by Elliott et al. from the analysis of the vapor branch obtained in 1 GeV/nucleon heavy ion reactionselliott02_2 . This coexistence curve is constructed from the vapor branch assuming the critical temperature, Tc, is equal to 7.6 MeVelliott02_2 . The vapor data (which are represented by triangles) shown in the figure are representative points taken from reference elliott02_2, . These points fall exactly on the coexistence curve as they are the points from which the curve was derived. Also shown in the figure are the data points derived for the liquid branch in the in the mass region, using the approach described above (represented by circles) and the points in the caloric curve plateau, which are derived using the expanding Fermi gas hypothesis (represented by squares)natowitz02_2 . It is immediately apparent that the liquid branch points do not fall on the coexistence curve. To fit such points a significant change in Tc, , or both, is required. In Figure 1b we present the result of fitting our liquid branch points of the coexistence curve to equation 1. This fit leads to a critical temperature of MeV and a critical density of . Thus the liquid branch implies a much higher critical temperature and the overall picture which emerges from such a fit indicates that the limit of the Coulomb instability prevents the system from reaching the critical point. Disassembly in the plateau region of the caloric curve would then appear to be occurring in the coexistence region well below the critical point.
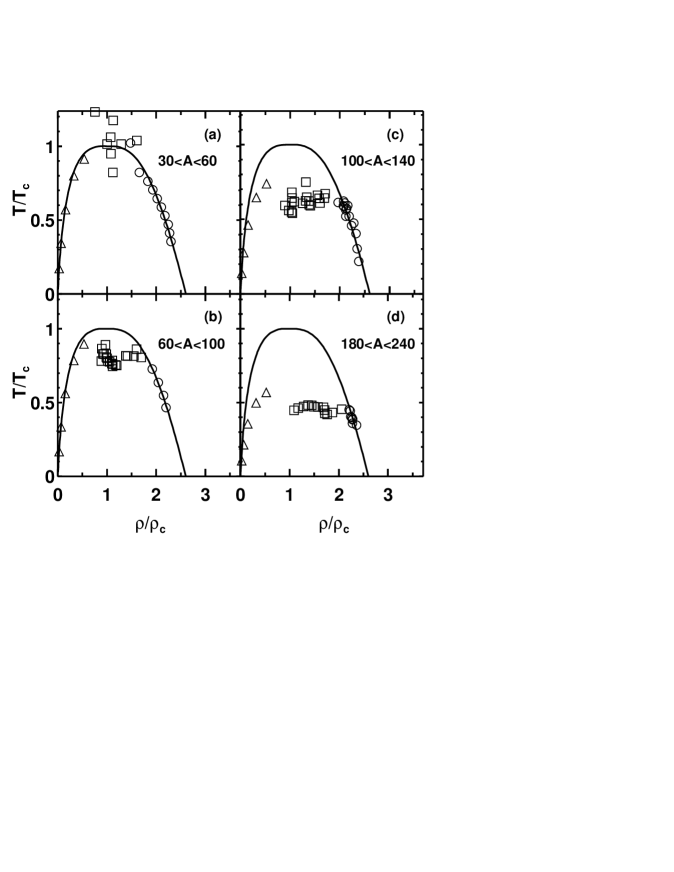
The results of extending this same method of analysis to data from the other mass regions are shown in Figure 2(a)-(d). The temperatures and densities extracted from the fits to the liquid branches are presented in Table 1. While the critical densities remain near 0.4 the critical temperatures increase with increasing mass. For all but the lightest systems () these critical temperatures are increasingly above those reported from the vapor branch analysis and well above the limiting temperatures derived from the caloric curves.
However, for the lightest mass systems this analysis leads to a critical temperature of MeV which agrees quite reasonably with the MeV critical temperature extracted by Elliott et al. for their lightest target, 86Krelliott02_2 . Here it should be recalled that the masses of the nuclei studied in that technique range from 80 to 30 as the excitation energy deposition increaseshauger98 ; hauger00 . The derived Tc for is also consistent with the limiting temperature of MeV obtained from the caloric curve analysis in this mass regionnatowitz02 . Thus Figure 2(a) provides a strong indication that the critical point may well have been reached in these light nuclei where the Coulomb effects are less important. For the heavier systems the present results suggest that the apparent critical behavior observed actually occurs far from the critical point. This is consistent with the onset of important Coulomb instabilitiesraduta01 ; bonche86 ; levit85 ; besprovany89 ; zhang96 ; zhang99 . Recent theoretical investigations have indicated that finite size effects or growth of fluctuations in the spinodal region may mimic critical behaviorchomaz99 ; norenberg02 .
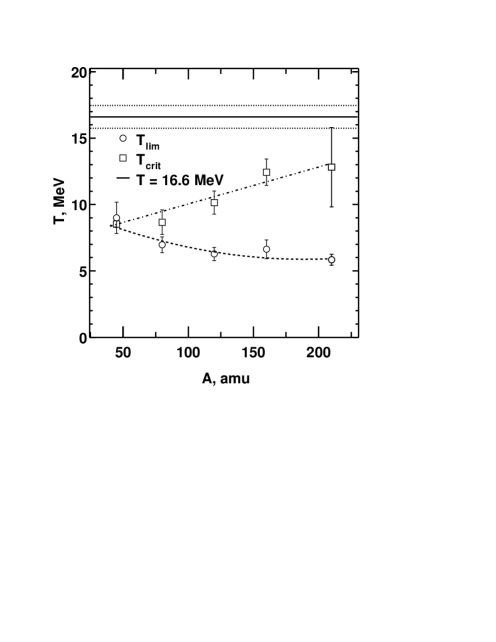
The results of this analysis are summarized in Figure 3. There the critical temperatures derived from fits to the liquid branch are compared with the limiting Coulomb instability temperatures. Also indicated by a horizontal bar in the figure is the critical temperature for symmetric nuclear matter, previously derived from the limiting temperature data. While the limiting temperatures drop with increasing mass, reflecting the increased importance of Coulomb effects, the critical temperatures rise toward the infinite nuclear matter value. The higher values for heavier nuclei are in accord with the constraint that Tc should be greater than 10 MeV as suggested by Karnaukhov based upon an analysis of fission probabilities taking into account the temperature dependence of the surface energy and its effect on the fission barrierkarnaukhov97
Acknowledgements
This work was supported by the U S Department of Energy under Grant DEFG03 93ER40773 and by the Robert A. Welch Foundation.
References
- (1) P. Chomaz, Proceedings of the INPC 2001 Conference, Berkeley, Ca., July, 2001.
- (2) S. Das Gupta, A. Z. Mekjian, M. B. Tsang, nucl-th/0009033, LANL preprint server, submitted to Adv. Nucl. Phys.(2001).
- (3) A. Bonasera, M. Bruno, C.O. Dorso and P.F. Mastinu, Riv. Del Nuov. Cim. 23, 1 (2000).
- (4) L.G. Moretto, J. B. Elliott, L. Phair, G. J. Wozniak, C. M. Mader and A. Chappars, Preprint LBNL-49235, to appear in Proceedings of the INPC 2001 Conference, Berkeley, Ca., July, 2001.
- (5) J. B. Elliott, L. G. Moretto, L. Phair, G. J. Wozniak, T. Lefort, L. Beaulieu, K. Kwiatkowski, W.C. Hsi, L. Pienkowski, H. Breuer, R. G. Korteling, R. Laforest, E. Martin, E. Ramakrishnan, D. Rowland, A. Ruangma, V. E. Viola, E. Winchester, S. J. Yennello, Phys. Rev. Lett. 88, 042701 (2002).
- (6) M. Kleine Berkenbusch et al., Phys. Rev. Lett. 88, 022701 (2002).
- (7) J. B. Elliott et al., LBNL-29237, submitted to Phys. Rev. C (2002). ArXiv nucl-ex/0205004.
- (8) H. Raduta and A. Raduta, Phys. Rev. Lett. 87, 202701 (2001).
- (9) J. A. Hauger et al., Phys. Rev. C 57, 764 (1998).
- (10) J. A. Hauger et al., Phys. Rev. C 62, 024626 (2000).
- (11) L. Beaulieu et al., Phys. Rev. Lett. 84, 5971 (2000).
- (12) L. Beaulieu et al., Phys. Rev. C 63, 031302 (2001).
- (13) M. E. Fisher, Physics 3, 255 (1967).
- (14) M. E. Fisher, Rep. Prog. Phys. 30, 615 (1969).
- (15) E. A. Guggenheim, J. Chem. Phys., 13, 253 (1945).
- (16) E.A. Guggenheim, “Thermodynamics”, 4th ed. (NorthHolland, 1993).
- (17) J.B. Natowitz, R. Wada, K. Hagel, T Keutgen, M. Murray, Y. G. Ma , A. Makeev, L. Qin , P. Smith and C.Hamilton, Phys. Rev. C 65, 034618 (2002).
- (18) P. Bonche, S. Levit and H. Vautherin, Nucl. Phys. A427, 278 (1984); Ibid, A 436, 265 (1986)P. Bonche, S. Levit, and D. Vautherin, Nucl. Phys. A436, 265 (1985).
- (19) S.Levit and P.Bonche, Nucl. Phys. A437, 426 (1985).
- (20) J. Besprovany and S. Levitt Phys. Lett. B217, 1 (1989).
- (21) Y. Zhang, R. Su, H. Song, and F. Lin, Phys. Rev. C 54, 1137 (1996).
- (22) L. L. Zhang, H. Q. Song, P. Wang, and R. K. Su, Phys. Rev. C 59, 3292 (1999).
- (23) J.B. Natowitz, K. Hagel, Y. Ma, M. Murray, L. Qin, R. Wada and J. Wang, submitted to Phys. Rev. Letters (2002); ArXiv nucl-ex/0204015.
- (24) J.B. Natowitz, K. Hagel, Y. Ma, M. Murray, L. Qin, S. Shlomo, R. Wada and J. Wang, submitted to Phys. Rev. C (2002); ArXiv nucl-ex/0205005.
- (25) S. Shlomo and J.B. Natowitz, Phys. Lett. B 252, 187 (1990).
- (26) S. Shlomo and J.B. Natowitz, Phys. Rev. C 44, 2878 (1991).
- (27) P. Chomaz and F. Gulminelli, Phys. Lett. B 447, 221 (1999).
- (28) W. Norenberg, G. Papp and P. Rozmej GSI Preprint 20023, January, 2002.
- (29) V.A. Karnaukhov, Phys. Atom. Nucl. 10, 1625 (1997).