Pseudorapidity and centrality dependence of the collective flow of charged particles in Au+Au collisions at 130 GeV
Abstract
This paper describes the measurement of collective flow for charged particles in Au+Au collisions at 130 GeV using the PHOBOS detector at the Relativistic Heavy Ion Collider (RHIC). An azimuthal anisotropy is observed in the charged particle hit distribution in the PHOBOS multiplicity detector. This anisotropy is presented over a wide range of pseudorapidity () for the first time at this energy. The size of the anisotropy (v2) is thought to probe the degree of equilibration achieved in these collisions. The result here, averaged over momenta and particle species, is observed to reach 7% for peripheral collisions at mid-rapidity, falling off with centrality and increasing . Data are presented as a function of centrality for and as a function of , averaged over centrality, in the angular region -5.05.3. These results call into question the common assumption of longitudinal boost invariance over a large region of rapidity in RHIC collisions.
PACS numbers: 25.75.-q
The study of collective flow in non-central ultra-relativistic heavy ion collisions is important because it can provide information on the initial spatial anisotropy of the reaction zone, conditions present in early stages of the collision [1, 2, 3, 4] and the degree of thermalization attained during the evolution of the collision [5, 6]. In addition, collective flow can affect other measurables of interest, such as two particle correlation functions and the slopes of transverse momentum distributions [1, 7]. Effects of collective flow have been observed in nuclear collisions over a wide range of collision energies and species[1, 8, 9, 10, 11, 12, 13, 14, 15, 16].
Hydrodynamic models, which assume local thermal equilibrium at all points, are generally thought to predict maximal flow. Such models are fairly successful at reproducing the mid-rapidity flow results at RHIC for the more central events and lower transverse momenta [17, 18]. This implies substantial early equilibration in these collisions. Hydrodynamic models predict roughly constant flow over a broad pseudorapidity region either through a full three-dimensional calculation [18] or by assuming longitudinal boost invariance. This paper provides an additional constraint on such models.
The analysis presented here is based on data taken between June and September, 2000, during the first RHIC physics run. Results are presented for Au+Au collisions at 130 GeV as a function of centrality over a narrow range of pseudorapidity (), while minimum bias results are shown over a large range (-5.05.3).
The PHOBOS detector employs silicon pad detectors to perform tracking, vertex detection and multiplicity measurements. Details of the setup and the layout of the silicon sensors can be found elsewhere[19, 20, 21]. For this running period, detector components relevant for this analysis included the first six layers of both silicon spectrometer arms (SPECN and SPECP), the silicon vertex detector (VTX), the silicon octagonal multiplicity detector (OCT), three annular silicon ring multiplicity detectors on each side of the collision point (RN, RP), and two sets of scintillating paddle counters (PN, PP).
Collisions with a coincidence of two or more signals in each of the PN and PP counters were selected by the trigger. This sample corresponded to % of the total inelastic Au+Au cross section. The centrality determination for the triggered events was based on a truncated mean of the deposited energy in the paddle counters. This variable is proportional to the number of particles hitting these counters and is monotonically related to the number of participants, Npart. More details on the event triggering and centrality determination can be found elsewhere[22]. Adjustments in the procedures used previously were made to take into account the fact that data used in this analysis came from an offset fiducial volume and included periods with different magnetic field settings.
Monte Carlo (MC) simulations of the detector performance were based on the Hijing event generator [23] and the GEANT 3.21 [24] simulation package, folding in the signal response for scintillator counters and silicon sensors.
The anisotropy of the azimuthal distribution of charged particles traversing the detector formed the basis for this flow analysis. Uniform and symmetric acceptance was beneficial in terms of sensitivity to the flow signal. This led to the requirement that the primary collision vertex fall within an 8 cm fiducial region centered at -34 cm from the nominal interaction point, in a uniform and symmetric part of the OCT subdetector.
The position of the primary collision vertex was determined on an event-by-event basis by fitting for the optimal intersection point of the straight tracks reconstructed in the first six planes of each of the two spectrometer arms. In addition, the vertex position along the beam, zvtx, was required to be consistent with the vertex position as determined by an independent algorithm to avoid pathological vertex reconstructions and reduce the potential for systematic effects. The second algorithm determined zvtx as the z position of the maximum of the azimuthally averaged hit density in the OCT subdetector. Finally, the reconstructed transverse vertex position was required to be within 2 of the average position (beam orbit).
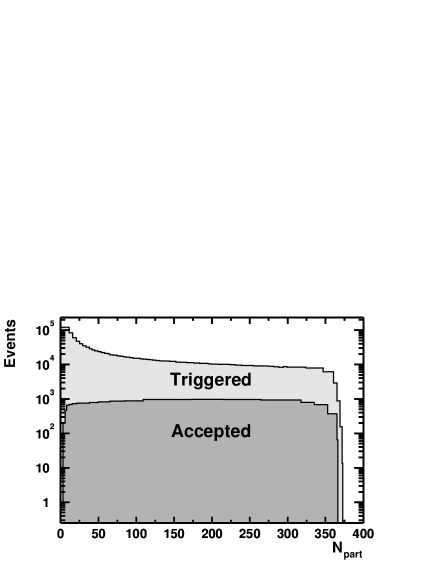
Trigger selection yielded events. A total of 13,644 events survived the vertex cuts described above, yielding a global acceptance for events used in the analysis of 1%. The number of triggered and accepted events are shown as a function of Npart in Fig. 1. The vertex position resolution for accepted events was estimated from simulated data to be 1 mm in x, 1 mm in y and 3 mm in z.
The raw data for this analysis came in the form of energy depositions in individual detector pads, known as hits. The hit energies were adjusted for variations in silicon thickness and converted to dE/dx using the expected path length, assuming each hit to come from a particle emanating from the reconstructed event vertex. Pads with energy depositions greater than 0.625 of the peak of the minimum ionizing particle distribution (i.e., 50 keV) were taken to represent points of charged particle transit and were used in the analysis. At the ends of the octagon, where a single particle track often passes through more than one detector pad, the energy signals in adjoining pads consistent with being from a single track were added together. To avoid biases introduced by malfunctioning pads, the signals from such pads were replaced with signals from corresponding mirror image pads in , making use of the fact that the data were taken during symmetric collisions. This was done for less than 3% of pads in the OCT and less than 1% of the pads in RN and RP. The position of each hit was smeared randomly with a flat distribution within its hardware pad boundaries and mapped into coordinates. The analysis was done on an event-by-event basis in space.
The strength of the flow is given by the nth Fourier coefficient of the particle azimuthal angle distribution,
| (1) |
where is the event plane angle, which is the best estimate of the azimuthal reaction plane angle, , defined by the impact parameter and the beam axis. This analysis was confined to n=2, the so-called elliptic flow. It generally followed the scheme proposed by Poskanzer and Voloshin [25] and was based on the correlation of hits in one part of the detector, known as a subevent, with the event plane angle as determined by hits in a different part of the detector (a different subevent). in a given subevent, ‘a’, was determined by
| (2) |
where the weights, , were selected to maximize reaction plane resolution by adjusting for acceptance and occupancy effects as described below. The sums ran over all hits in subevent a.
The distribution as a function of azimuthal angle should be flat in the absence of detector effects. Structures in the raw hit and distributions were understood qualitatively from studies of simulated data as coming from gaps between sensors, channel-to-channel differences in phase space coverage, and the asymmetric production of background particles. These effects were removed (and the distribution flattened) in each annulus through the use of individual hit weights, w, which were proportional to the inverse of the average number of hits in each pad. Residual effects due to the variation in the vertex position were absorbed in the systematic error. It should be noted that the final results of the analysis were insensitive to this weighting and that results with no acceptance weighting were consistent with the observations reported here.
The finite pad size in the detector led to an occupancy-dependent hit saturation that reduced sensitivity to flow. This effect was accounted for in the analysis by weighting the hits in a given bin by the average number of tracks per hit pad, or occupancy, calculated individually in different sections of the detector. The occupancy was determined on an event-by-event basis from the number of occupied (Nocc) and unoccupied (Nunocc) pads in each section. The occupancy weight in a given section was determined assuming a Poisson statistical distribution as [26]
| (3) |
where =ln(1 + Nocc/Nunocc) is the average number of tracks per pad. This occupancy was used in concert with the acceptance weight to produce the overall weight,
| (4) |
which was used in the determination of in equation (2). The event plane resolution, R, was calculated separately for each centrality bin using the subevent technique[25] as
| (5) |
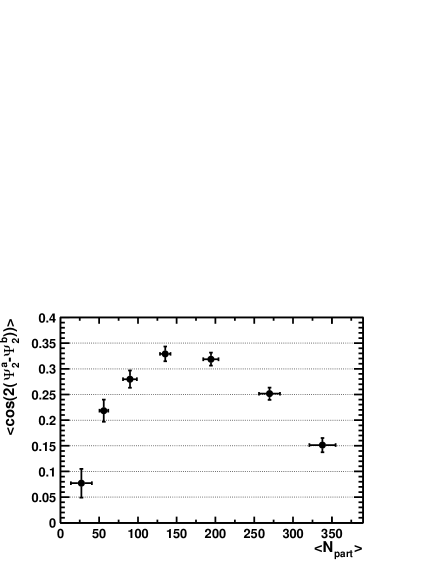
where the superscripts denote separate subevents within a given event and the averaging was done over all accepted events in a given centrality bin. In this analysis, equal multiplicity subevents were defined by dividing the event into two separate regions, OCT-, which extended from -2.0 to -0.1 in , and OCT+, which encompassed between 0.1 and 2.0. The gap between the two angular ranges in the OCT subdetector was introduced to reduce effects due to short-range non-flow correlations between hits in different subevents. The final v2 determination was found to be robust against the choice of subevent used in the evaluation of the event reaction plane so long as the chosen subevent contained sufficient statistics that the reaction plane resolution could be well determined. In addition, the gap width between subevents was varied from 0.2 to 1.0 in and the change in v2 was incorporated in the final systematic error for the analysis. The correlation between the event planes in the OCT- and OCT+ subevents is shown in Fig. 2.
The observed, resolution and occupancy corrected value of v2, v, was calculated in bins of centrality and from the hit map using
| (6) |
where the averaging in the numerator was done over the hits in one event and the averaging of the fraction was done over all events in the given centrality or bin using the appropriate value of R for each event.
In this analysis, v was calculated in several regions of the detector using the position of the hits in the space. Two regions at high corresponded to areas covered by the ring detectors, RN and RP, and encompassed -5.0-3.0 and 3.55.25, respectively. In the mid- range, the regions covered by the OCT subdetector(OCT- and OCT+) were used. For the determination of v2 in the positive (negative) region of the detector, OCT- (OCT+) was used as the subevent region to evaluate . Fiducial cuts in were used to avoid acceptance edge effects on the flow signal.
Even after resolution correction, Monte Carlo simulations showed a residual suppression of the flow signal from background particles carrying no flow information, the so-called non-flow background. This effect was studied in detail using simulated data with a known amount of flow. By comparing the output resolution corrected flow signal to the input flow signal for many samples of simulated data with different forms and magnitudes of input flow (v2), suppression correction factors, C, were determined for each bin of centrality and in the analysis. The suppression factors were found to be independent of the assumed flow magnitude and its form. Furthermore, as a function of , the correction is a constant 12% in the OCT and ranges from 15-30% in most of the rings, where the backgrounds are higher. As a function of centrality the correction is a flat 12%. The final corrected value of v2 was determined by
| (7) |
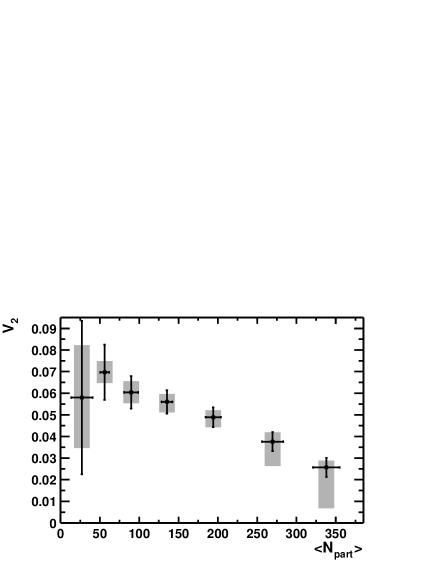
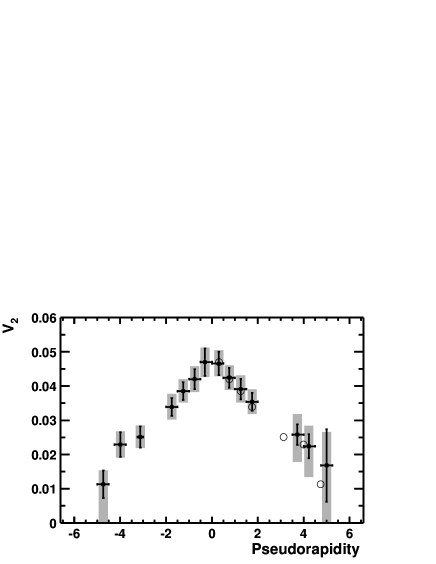
This quantity, averaged over the region -1.01.0, is presented in Fig. 3 as a function of the number of participants, Npart. The dependence of v2, event averaged over centrality, is shown in Fig. 4. For the sample of accepted events entering this plot, =191. This is substantially more than the overall =98 for minimum bias events in Hijing, reflecting the trigger inefficiency and the centrality bias in our vertex reconstruction.
Numerous sources of systematic error were investigated, including effects due to the energy cut, hit merging, subevent definition, knowledge of the beam orbit relative to the detector, shape of the dN/d distribution, vertexing algorithm, transverse vertex cuts, magnetic field configuration and suppression correction determination. The effect of these sources depended both on and centrality. In general, the systematic error arising from each source was determined by conservatively varying that specific aspect of the analysis (or several aspects in concert) and quantifying the change in the final v2 result as a function of and centrality. The individual contributions were added in quadrature to derive the 90% confidence level error shown as the gray band in Figs. 3 and 4. In addition to the procedure described above, the systematic error on the lower side of some points in Figs. 3 and 4 was increased to reflect the reduced sensitivity of the analysis to the low level of flow in those bins as determined from Monte Carlo studies.
These results represent the first measurement of v2 as a broad function of at RHIC and agree with the mid-rapidity measurements of v2 from the STAR [14] and PHENIX [16] collaborations. The extended angular coverage portrayed in Fig. 4 clearly shows a systematic drop in the magnitude of v2 with . This drop could be due, in part, to correlations not associated with the reaction plane, a drop in due to dynamics or kinematics [27], substantial directed flow, or a change in the underlying mechanism of particle production as a function of . Since these data appeared in a preliminary form [28], theoretical efforts have had only limited success in reproducing the dependence [18, 29]. These results call into question the common assumption of longitudinal boost invariance over a large region of rapidity in RHIC collisions. Further work is needed to develop a clear, three-dimensional picture of these collisions.
Acknowledgements: We acknowledge the generous support of the C-A Division and Chemistry Departments at BNL. We thank Fermilab and CERN for help in silicon detector assembly. We thank the MIT School of Science and LNS for financial support. This work was partially supported by US DoE grants DE-AC02-98CH10886, DE-FG02-93ER40802, DE-FC02-94ER40818, DE-FG02-94ER40865, DE-FG02-99ER41099, W-31-109-ENG-38. NSF grants 9603486, 9722606 and 0072204. The Polish groups were partially supported by KBN grant 2 P03B 04916. The NCU group was partially supported by NSC of Taiwan under contract NSC 89-2112-M-008-024.
REFERENCES
- [1] W. Reisdorf and H.G. Ritter, Annu. Rev. Nucl. Part. Sci. 47 (1997) 663.
- [2] H.Sorge, Phys. Rev. Lett. 82 (1999) 2048.
- [3] P. Kolb, J. Sollfrank, and U. Heinz, Phys. Lett. B459 (1999) 667.
- [4] D. Teaney and E.V. Shuryak, Phys. Rev. Lett. 83 (1999)4951.
- [5] P. Kolb, J. Sollfrank, and U. Heinz, Phys. Rev. C62 (2000) 054909.
- [6] S.A. Voloshin, A.M. Poskanzer, Phys. Lett. B474 (2000) 27.
- [7] H. Heiselberg and A. Levy, Phys. Rev. C59 (1999) 2716, as well as references 20-23 in reference [23].
- [8] J.Y. Ollitrault, Phys. Rev. D46 (1992) 229 and J.Y. Ollitrault, Nucl. Phys. A638 (1998) 195.
- [9] E877 Collaboration, J. Barrette et al., Phys. Rev. C55 (1997) 1420.
- [10] E895 Collaboration, C. Pinkenburg et al., Phys. Rev. Lett. 83 (1999) 1295.
- [11] NA49 Collaboration, H. Appelshauser et al., Phys. Rev. Lett. 80 (1998) 4136.
- [12] WA93 Collaboration, M.M. Aggarwal et al., Phys. Lett B403 (1997) 390.
- [13] WA98 Collaboration, M.M. Aggarwal et al., Nucl. Phys. A638 (1998) 459c.
- [14] STAR Collaboration, K.H. Ackermann et al., Phys. Rev. Lett. 86 (2001) 402.
- [15] STAR Collaboration, C.Adler et al., Phys. Rev. Lett. 87 (2001) 182301.
- [16] PHENIX collaboration, K. Adcox et al., LANL preprint archive, nucl-ex/0204005, April 2002, submitted to Phys. Rev. Lett.
- [17] U. Heinz and P. Kolb, LANL preprint hep-ph/0111075, November 2001.
- [18] T. Hirano, Phys. Rev. C 65 (2002) 011901.
- [19] PHOBOS Collaboration, B.B.Back et al., Nucl. Phys. A661 (1999) 690c.
- [20] PHOBOS Collaboration, H.Pernegger et al., Nucl. Instrum. Methods. A473 (2001) 197.
- [21] PHOBOS Collaboration, B.B.Back et al., Nucl. Phys A698 (2002) 416.
- [22] PHOBOS Collaboration, B.B. Back et al., Phys. Rev. Lett. 85 (2000) 3100, PHOBOS Collaboration, B.B. Back et al., Phys. Rev. Lett. 88 (2002) 22302, PHOBOS Collaboration, B.B. Back et al., Phys. Rev. C65 (2002) 031901.
- [23] M.Gyulassy and X.N.Wang, Phys. Rev. D44 (1991) 3501. We used Hijing V1.35 (April 1998) with standard parameter settings.
- [24] GEANT 3.2.1, CERN Program Library.
- [25] A.M. Poskanzer and S.A. Voloshin, Phys. Rev. C58 (1998) 1671.
- [26] PHOBOS Collaboration, B.Back et al., Phys. Rev. Lett. 87 (2001) 102303.
- [27] P. Kolb, in Proc. of the 17th Winter Workshop on Nuclear Dynamics, Park City, UT, 2001.
- [28] PHOBOS Collaboration, B.B.Back et al., Nuclear Physics A698 (2002) 564c.
- [29] E.E. Zabrodin, C. Fuchs, L.V. Gravina, and A. Faessler, Phys. Lett B508 (2001) 184-190.