Event-by-event fluctuations in Mean and Mean
in GeV Au+Au Collisions
Abstract
Distributions of event-by-event fluctuations of the mean transverse momentum and mean transverse energy near mid-rapidity have been measured in Au+Au collisions at GeV at RHIC. By comparing the distributions to what is expected for statistically independent particle emission, the magnitude of non-statistical fluctuations in mean transverse momentum is determined to be consistent with zero. Also, no significant non-random fluctuations in mean transverse energy are observed. By constructing a fluctuation model with two event classes that preserve the mean and variance of the semi-inclusive or spectra, we exclude a region of fluctuations in GeV Au+Au collisions.
pacs:
PACS numbers: 25.75.DwI Introduction
Phase instabilities near the QCD phase transition can result in non-statistical fluctuations that are detectable in final state observables [3]. These instabilities, which may occur due to random color fluctuations [4], critical behavior at the QCD tri-critical point [5], or fluctuations from the decay of a Polyakov loop condensate [6], can result in a broadening of the transverse momentum or transverse energy distributions of produced particles for different classes of events. This phenomenon is expected to be detected experimentally by searching for deviations of the distributions of the event-by-event mean transverse momentum or mean transverse energy of produced particles from the random distributions expected for statistically independent particle emission.
An event-by-event analysis of was previously performed for GeV/c Pb+Pb Collisions at the CERN SPS by Experiment NA49 [7]. In that analysis, the distributions measured over the rapidity range and range GeV/c, were found to be consistent with random fluctuations. NA49 also performed an event-by-event analysis of the ratio [8], showing only very small deviations from random fluctuations. With an increase of to GeV in RHIC collisions, unprecedented energy densities have been observed [12], hence conditions may be more favorable for a phase transition from hadronic matter to a Quark-Gluon Plasma which may be indicated in non-random fluctuations. Presented here is an event-by-event analysis of fluctuations and the first measurement of fluctuations at mid-rapidity at RHIC.
II Analysis
The PHENIX experiment [9] consists of four spectrometers designed to measure simultaneously hadrons, leptons, and photons produced in nucleus-nucleus, proton-nucleus, and proton-proton collisions at RHIC. The two central arm spectrometers, which are located within a focusing magnetic field and each cover in pseudorapidity and in azimuthal angle, are utilized in this analysis. The primary interaction trigger was defined using the Beam-Beam Counters (BBC) [10] and Zero Degree Calorimeters (ZDC) [11]. Events are selected with a requirement that the collision vertex along the beam axis has cm as measured by both the BBC and ZDC. Event centrality is defined using correlations in the BBC and ZDC analog response as described in [12]. For the present analysis, the events are classified according to the , , , and most central events.
The drift chamber [13] is used in conjunction with the innermost pad chamber, called PC1, to measure the transverse momentum of charged particles traversing the PHENIX acceptance. A fiducial section of the drift chamber is chosen to minimize the effect of time-dependent variations in the performance of the detector during the data-taking period. The fiducial volume of the analysis spans an azimuthal range of and covers the pseudorapidity range . Reconstructed tracks [14] are required to contain a match to a hit in PC1 to insure that the tracks are well reconstructed in three dimensions for reliable momentum determination.
The distribution is determined from clusters reconstructed in the two instrumented sectors of the Lead-Scintillator electromagnetic calorimeter [9, 15, 16]. The quantity is defined as the transverse energy per reconstructed calorimeter cluster as described in [16], which can include clusters that have been merged. The effects of cluster merging on the distribution are discussed later. The fiducial volume of the analysis spans an azimuthal range of and covers .
There are no acceptance nor efficiency corrections applied to the semi-inclusive or distributions prior to the calculation of or . These corrections do not vary from event to event and are identical for data and mixed events; therefore they do not modify the values of the fluctuation quantities defined later. The distributions are calculated using the formula
| (1) |
where is the number of tracks in the event that pass the cuts outlined above and lie within the range GeV/c. Similarly, the distributions are calculated using the formula
| (2) |
where is the number of calorimeter clusters in the event that lie within the range GeV. An event is excluded from the analysis if or is below a minimum value to insure that there are a sufficient number of tracks or clusters to determine a mean and to exclude background events. This minimum value for the , , , and centrality classes, respectively, is 40, 30, 20, and 10 for the analysis and 30, 20, 10, and 10 for the analysis. Table I lists statistics pertaining to the data samples used to determine and Table II lists the statistics pertaining to the data samples used to determine . The events used for the and analyses are considered independently of each other.
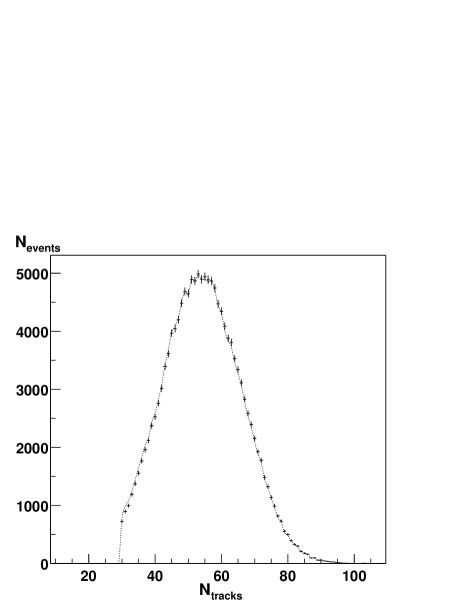
In order to compare the and distributions to what is expected for statistically independent particle emission, mixed events are considered as the baseline for the random distribution. To obtain a precision comparison, it is important to match the number of tracks or clusters along with the mean of the semi-inclusive distribution of the mixed events to that of the data. Therefore, in both analyses, mixed events are constructed by pre-determining the number of charged particle tracks or calorimeter clusters in the mixed event by directly sampling the corresponding data or distributions. Figure 1 shows a comparison of the distributions from the data and the normalized mixed event distribution for the centrality class. Once is determined, a mixed event is filled with or values from the data with the following criteria: a) no two or values from the same data event are allowed to reside in the same mixed event, b) only or values passing all cuts in the determination of or from the data events are placed in a mixed event, and c) only data events from the same centrality class are used to construct a mixed event corresponding to that class. Once a mixed event is filled with tracks or clusters, its or is calculated in the same manner as for the data events.
For both analyses, the data contain a fraction of tracks or clusters within close physical proximity that have merged into a single track or cluster. This fraction is estimated by embedding simulated single-particle events that are processed through a detailed simulation of the detector response into real data events, which are then reconstructed in the same manner as the data. For the centrality class, we estimate that 6% of the tracks and 5% of the clusters are affected.
For the analysis, tracks that are merged into a single reconstructed track typically have similar values of . The result is a slightly lower value of which causes a slight broadening in the width of the distribution due to the reduced statistics per event. However, since the data distribution is directly sampled during the construction of mixed events, the effect of merged tracks cancels for comparisons between the data and mixed events.
For the analysis, the effect of merged clusters is complicated by the fact that a single cluster is reconstructed with an corresponding to the sum of the two (or more) particles contributing to the cluster. To understand this effect on the mixed events, we note that the fraction of merged clusters within a data event increases with event multiplicity. Also, many of the data events with the lowest coincide with the lowest multiplicity events since they contain few, if any, merged clusters that would yield a higher . When the merged clusters in the data events are randomly redistributed among the mixed events, low multiplicity mixed events can contain more merged clusters than the data events with the same multiplicity, resulting in a gross upward shift in for those mixed events. This results in apparent excess non-random fluctuations at low . Conversely, high multiplicity mixed events can contain fewer merged clusters than the data events with the same multiplicity, resulting in a gross downward shift in for those mixed events. However, since the mean is taken over more clusters in this case, the effective shift in is reduced at high , and the apparent non-random fluctuations are much less pronounced. An estimate of the magnitude of this effect is presented later.
III Results
To compare directly the semi-inclusive distribution to the distribution assuming statistically independent particle emission, the closed form prescription outlined in [17] is used. This prescription describes the semi-inclusive distribution using a Gamma distribution,
| (3) |
where and are free parameters that are related to the mean and standard deviation of the semi-inclusive distribution as
| (4) |
where
| (5) |
The reciprocal of is the inverse slope parameter of the distribution. With the track multiplicity distribution assumed to be a negative binomial distribution, , the distribution can be calculated using
| (6) |
where the loop is over from to , which are the limits of the multiplicity. The value of the negative binomial distribution parameter is given by
| (7) |
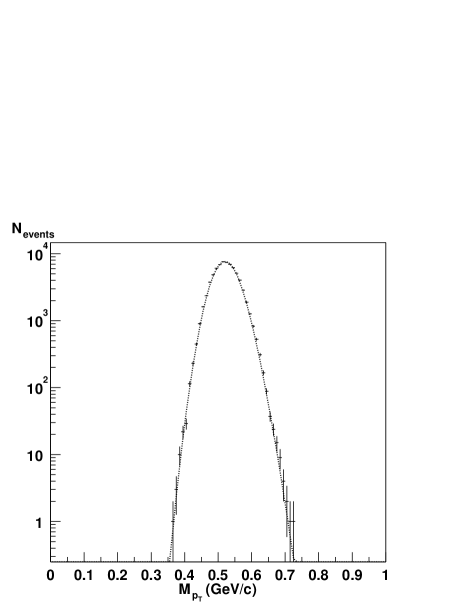
Therefore, given , , and extracted from the semi-inclusive distribution, the expected random distribution can be calculated. Figure 2 shows the distribution for the centrality class. Overlayed on the data as a dotted curve is the result of the calculation. The agreement between the data distribution and the calculation illustrates the absence of large non-statistical fluctuations in the data. The remainder of this article will quantify the amount of non-statistical fluctuations observed and place limits on the level of fluctuations that can be present in central Au+Au collisions at GeV.
To quantify the magnitude of the deviation of fluctuations from the expectation of statistically independent particle emission, the magnitude of the fluctuation in the transverse quantity , representing or , is defined as
| (8) |
The value of is calculated independently for the data distribution and for the baseline, or mixed event, distribution. The difference in the fluctuation from a random baseline distribution is defined as
| (9) |
The sign of is positive if the data distribution contains a correlation, such as Bose-Einstein correlations [18], when compared to the baseline distribution. The fraction of fluctuations which deviate from the expectation of statistically independent particle emission is given by
| (10) | |||||
| (11) |
where refers to the standard deviation of the event-by-event data distribution and is the corresponding quantity for the baseline, or mixed event, distribution. In the absence of a common language for the analysis of and fluctuations, the commonly used fluctuation quantity [19] is also presented in order to compare this measurement to previous results [7]. The quantity is related directly to via
| (12) | |||||
| (13) |
where represents or . The quantity is related to by
| (14) |
The standard deviation of the semi-inclusive spectra can be approximated by [17], where is the standard deviation of the semi-inclusive distribution as defined in Eq. 3.3. Therefore, is simply the fraction of non-random fluctuations in the event-by-event mean or , , scaled by . An advantage of over is that measurements expressed in can be directly compared without further scaling.
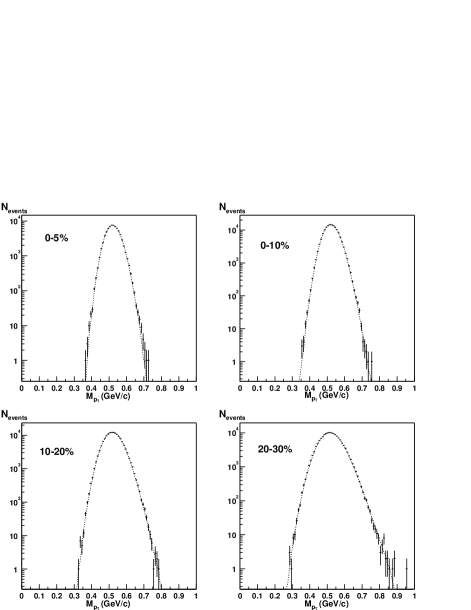
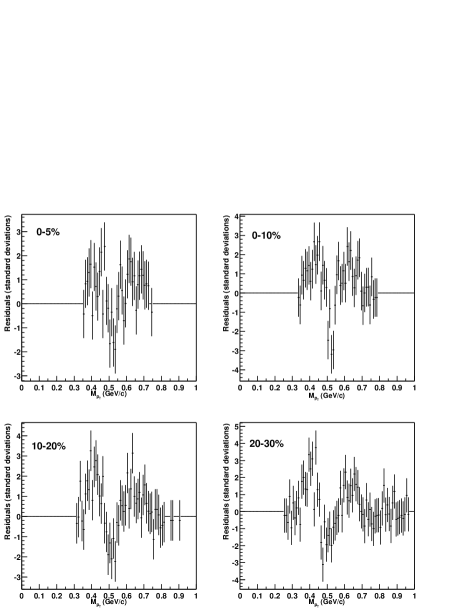
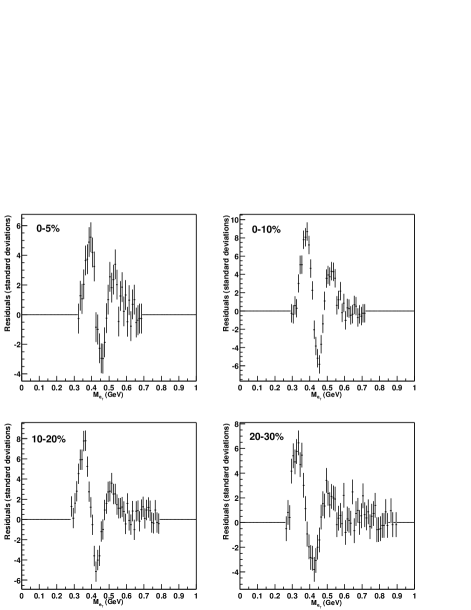
The magnitudes of any non-random fluctuations are established by comparing the data distributions to the mixed event distributions, which serve as the random baseline distributions. For this purpose, the mixed event distributions are normalized to minimize the value with respect to the data distributions. Figure 3 and Figure 5 show the and distributions for all four centrality classes (data points) with the corresponding mixed event and distributions overlayed on the data as dotted curves. The broadening of the distributions for less central collisions are due to the reduction in or . Shown in Figure 4 and Figure 6 are the residuals between the data and mixed events, defined for each bin as , in units of standard deviations, for each centrality class. The shapes of the residual distributions are primarily driven by the normalization procedure applied to the mixed events.
For the distributions, the data and mixed event distributions are indistinguishable. However, the upper edges of the data and mixed event distributions show good agreement while the lower edge of the data distributions are slightly wider than the mixed event distribution. If this low effect were physical, it would imply fluctuations with slightly more low photons since the effect is not seen in the distribution for charged particle tracks. However, some of the excess fluctuations at low can be attributed to the effects of cluster merging previously discussed. The magnitude of this effect has been investigated using a Monte Carlo simulation which calculates after reproducing the calorimeter cluster separation distribution, the distribution, and the semi-inclusive distributions from the data. The fluctuations in the distribution with this effect included in each event are compared to a simulated mixed event distribution constructed from the same generated dataset using the same procedure that is applied to the data. In this manner, it is estimated that the cluster merging effect contributes an additional = 1.5%, 2.1%, 0.9%, and less than 0.01% to the non-random fluctuations for the , , , and centrality classes, respectively. The simulation confirms that the cluster merging effect significantly contributes only to the lower edge of the distribution. The remainder of the excess low fluctuations is likely due to correlated low energy background. GEANT [21] simulations indicate that the primary background contribution is produced by low energy electrons and muons that scatter off of the pole tips of the central arm spectrometer magnet but still pass the cluster selection cuts. Because of the difficulty in quantifying the contribution of background to the excess fluctuations, the present data are taken to indicate an upper limit on non-statistical fluctuations rather than an indication of true non-statistical fluctuations.
The values of , , , and for each centrality class using the mixed events as the random baseline distribution are tabulated in Table III for and Table IV for . The errors quoted for these quantities include statistical errors and systematic errors due to time-dependent variations over the data-taking period. The systematic errors are estimated by dividing each dataset into nine subsets with each subset containing roughly equal numbers of events. For the analysis, the systematic errors contribute to 81%, 88%, 76%, and 75% of the total error in and 85%, 88%, 80%, and 85% of the total error in the variables , , and for the , , , and centrality classes, respectively. The corresponding values for the analysis are a 67%, 63%, 81%, and 82% contribution to the total errors in , and a 64%, 63%, 81%, and 82% contribution to the total errors in , , and for each centrality class. The cluster merging contribution estimates noted above are not applied to the values quoted in Table IV.
IV Discussion
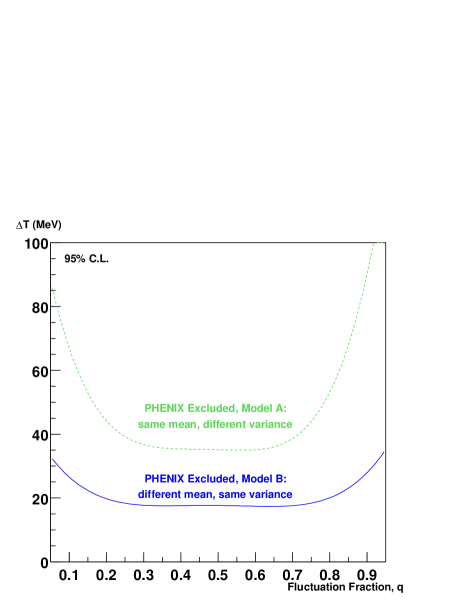
Based upon the fluctuation measurements presented here, certain fluctuation scenarios in RHIC Au+Au collisions at GeV are excluded. For this purpose, we consider two variations of a model that contains two classes of events with a difference of effective temperature, defined as , where is the inverse slope parameter of the event class with the higher effective temperature, and is the inverse slope parameter of the event class with the lower effective temperature. The first variation, Model A, will consider a case where the means of the semi-inclusive spectra for the two event classes are identical, but the standard deviations are different. The second variation, Model B, will consider a case where the means of the semi-inclusive spectra are different, but the standard deviations are identical. Since the semi-inclusive distribution is an observed quantity, the two event classes must be constrained in such a way that the mean and standard deviation of the final semi-inclusive distribution remains constant while the effect of the fluctuation manifests itself in the distribution.
The dual event class model is applied to the determination of the sensitivity to fluctuations in for the centrality class as follows. Returning to the prescription outlined in [17], the semi-inclusive transverse spectrum can be parameterized by the distribution defined in Eq. 3.1. For both model variations, the fraction of events in the event class with the higher effective temperature is defined as
| (15) |
The distribution of the combined sample can then be expressed as
| (16) |
where and .
For Model A, the semi-inclusive distributions of each event class are constrained to have the same mean, so we require
| (17) |
The variance of the final semi-inclusive distribution for Model A is constrained by
| (18) |
With these constraints, the choice of a value for and the effective temperature of one event class is sufficient to extract the remaining parameters from which sensitivity estimates for fluctuations in are obtained.
For Model B, the semi-inclusive distributions of each event class are allowed to have different means, and , so the mean of the total semi-inclusive distribution can be expressed as . Defining a mean shift, , as , we obtain
| (19) |
Allowing = and applying the constraint that the variances of the two event classes are identical, yields
| (20) |
With a choice of values for and , the remaining parameters can be calculated, including .
Both variations of the dual event class model are implemented in a Monte Carlo simulation in the following manner. The number of particles in an event is determined by sampling the data distribution, approximated by a Gaussian distribution fit to the data. The of each particle in an event is determined individually by sampling the appropriate distribution fit to the semi-inclusive data distribution, which yields and for centrality. The of each particle is restricted to the range of the measurement. With and the distribution determined, the for a given number of events is calculated. The generated distribution with for either model variation is found to be statistically consistent with the mixed event distribution.
The data contain a fraction of background particles that did not originate from the collision vertex that effectively dilute the sensitivity to non-random fluctuations. To address this, a fraction of the particles in an event are randomly tagged as background particles, whose distribution is then generated with a separate parameterization prior to calculating for an event. The level of background contamination is estimated by processing HIJING [20] Au+Au events through a software chain that includes a detailed GEANT simulation [21] with the complete PHENIX detector geometry included, followed by a detailed simulation of the detector electronics response [14], whose output is then processed by track, cluster, and momentum reconstruction using the identical software and input parameters as is used for the data analysis. It is estimated that 11% of the tracks and 26% of the clusters are due to background particles, independent of centrality class over the centrality range of these measurements. The estimated and distributions for the background particles are well parameterized by exponential distributions. Again, the majority of the background occurs at low , so any correlated background would most likely contribute to the lower side of the distribution.
To determine the sensitivity to fluctuations within the dual event class model, the fluctuation fraction, , and the value of for Model A and for Model B are varied and the distribution is generated at each step. A chi-square test is then performed on the generated distribution with respect to the mixed event data distribution. For a given value of , the result increases as increases, which allows a fluctuation exclusion region to be defined for the single degree of freedom. The curves in Figure 7 show the lower exclusion boundaries for the centrality measurement at the 95% Confidence Level as a function of and for both variations of the model. If the sensitivity is determined based upon the non-mixed data distribution, the lower exclusion boundary increases by less than 2 MeV for all values of for either model. Also, for all values of in either model, the estimated background contribution degrades the sensitivity estimates by = 3 MeV for both models.
A recent model of event-by-event fluctuations where the temperature parameter fluctuates with a standard deviation on an event-by-event basis [22], can be simply related to :
| (21) |
where is the semi-inclusive parameter extracted from the present data. For the centrality class, the present measurement establishes a 95% Confidence Limit of 2.6 for , or 5% for .
V Conclusions
The fluctuations in the distributions for all centrality classes are consistent with the presence of no fluctuations in excess of the random expectation. The magnitude of in all cases is positive, which may be due to the presence of Hanbury-Brown-Twiss correlations. The fluctuations in the distributions do have a small non-statistical component, much of which is attributable to the effects of merged clusters, the remainder of which are taken to indicate an upper limit on non-statistical fluctuations in transverse energy. By defining a dual event class model, limits are set on the amount of fluctuations that can be present in the angular aperture and in GeV Au+Au collisions. During the RHIC run of 2001, PHENIX has taken data for GeV Au+Au collisions with about a factor of four increase in azimuthal angular acceptance for both the and analyses, which will allow the measurements to be extended toward more peripheral collisions.
VI Acknowledgements
We thank the staff of the RHIC Project, Collider-Accelerator, and Physics Departments at Brookhaven National Laboratory and the staff of the other PHENIX participating institutions for their vital contributions. We acknowledge support from the Department of Energy, National Science Foundation, and Dean of the College of Arts and Sciences, Vanderbilt University (U.S.A), Ministry of Education, Culture, Sports, Science, and Technology and the Japan Society for the Promotion of Science (Japan), Russian Academy of Science, Ministry of Atomic Energy of Russian Federation, Ministry of Industry, Science, and Technologies of Russian Federation (Russia), Bundesministerium fuer Bildung und Forschung, Deutscher Akademischer Auslandsdienst, and Alexander von Humboldt Stiftung (Germany), VR and the Wallenberg Foundation (Sweden), MIST and the Natural Sciences and Engineering Research Council (Canada), Conselho Nacional de Desenvolvimento Científico e Tecnológico and Fundação de Amparo à Pesquisa do Estado de São Paulo (Brazil), Natural Science Foundation of China (People’s Republic of China), IN2P3/CNRS (France), Department of Atomic Energy and Department of Science and Technology (India), Korea Research Foundation and Center for High Energy Physics (Korea), the U.S. Civilian Research and Development Foundation for the Independent States of the Former Soviet Union, and the US-Israel Binational Science Foundation.
REFERENCES
- [1] Deceased
- [2] Not a participating Institution (author is an individual participant).
- [3] H. Heiselberg, Phys. Repts. 351, 161 (2001).
- [4] S. Mrowczynski, Phys. Lett. B314, 118 (1993).
- [5] M. Stephanov, et al., Phys. Rev. Lett. 81, 4816 (1998).
- [6] A. Dumitru and R. Pisarski, Phys. Lett. B504, 282 (2001).
- [7] H. Appelshauser, et al., Phys. Lett. B459, 679 (1999).
- [8] S. V. Afanasiev, et al., Phys. Rev. Lett. 86, 1965 (2001).
- [9] PHENIX Collaboration, D. P. Morrison, et al., Nucl. Phys. A638, 565c (1998).
- [10] K. Ikematsu, et al., Nucl. Instrum. Methods A411, 238 (1998).
- [11] C. Adler, et al., Nucl. Instrum. Methods A461, 337 (2001).
- [12] PHENIX Collaboration, K. Adcox, et al., Phys. Rev. Lett. 86, 3500 (2001).
- [13] V. Riabov, et al., Nucl. Instrum. Methods A419, 363 (1998).
- [14] J. T. Mitchell, et al., BNL Preprint BNL-68320, nucl-ex/0201013, accepted for publication in Nucl. Instrum. Methods A.
- [15] G. David et al., IEEE Trans. Nucl. Sci. 45, 692, 705 (1998).
- [16] PHENIX Collaboration, K. Adcox, et al., Phys. Rev. Lett. 87, 052301 (2001).
- [17] M. J. Tannenbaum, Phys. Lett. B498, 29 (2001).
- [18] U. Wiedemann and U. Heinz, Phys. Repts. 319, 145 (1999).
- [19] M. Gazdzicki and S. Mrowczynski, Z. Phys. C54, 127 (1992).
- [20] X-N. Wang and M. Gyulassy, Phys. Rev. D44, 1991 (3501).
- [21] R. Brun and F. Carminati, CERN Program Library, Long Writeup W5013, March 1994.
- [22] R. Korus, et al., Phys. Rev. C64, 054908 (2001).

| Centrality | ||||
|---|---|---|---|---|
| Data | ||||
| 72692 | 149236 | 149725 | 150365 | |
| 59.6 | 53.9 | 36.6 | 25.0 | |
| 10.8 | 12.2 | 10.2 | 7.8 | |
| 523 | 523 | 523 | 520 | |
| 290 | 290 | 290 | 289 | |
| 38.6 | 41.1 | 49.8 | 61.1 | |
| Mixed Events | ||||
| 523 | 523 | 523 | 520 | |
| 37.8 | 40.3 | 48.8 | 60.0 | |
| Centrality | ||||
|---|---|---|---|---|
| Data | ||||
| 69224 | 138882 | 140461 | 137867 | |
| 68.6 | 62.1 | 41.6 | 28.0 | |
| 11.6 | 13.2 | 10.8 | 8.3 | |
| 466 | 462 | 448 | 439 | |
| 267 | 265 | 258 | 253 | |
| 34.1 | 36.2 | 43.0 | 51.8 | |
| Mixed Events | ||||
| 466 | 462 | 448 | 439 | |
| 32.7 | 34.4 | 41.3 | 50.0 | |
| Centrality | ||||
|---|---|---|---|---|
| (%) | ||||
| (MeV/c) |
| Centrality | ||||
|---|---|---|---|---|
| (%) | ||||
| (MeV) |