DIELECTRON PRODUCTION IN HEAVY ION COLLISIONS AT 158 GeV/c PER NUCLEON
Vom Fachbereich Physik
der Technischen Universität Darmstadt
zur Erlangung des Grades
eines Doktors der Naturwissenschaften
(Dr. rer. nat.)
genehmigte Dissertation von
Dipl.-Phys. M.A. Gunar Hering
aus Chemnitz
Darmstadt 2001
D 17
Referent: Prof. Dr. P. Braun-Munzinger
Koreferent: Prof. Dr. W. Nörenberg
Tag der Einreichung: 27. November 2001
Tag der Prüfung: 21. Januar 2002
Abstract
In this paper, the low-mass electron pair production in 158 A GeV/c Pb-Au collisions is investigated with the Cherenkov Ring Electron Spectrometer (CERES) at the Super Proton Synchrotron accelerator (SPS) at CERN. The main goal is to search for modifications of hadron properties in hot and dense nuclear matter. The presented re-analysis of the 1996 data set is focused on a detailed study of the combinatorial-background subtraction by means of the mixed-event technique. The results confirm previous findings of CERES. The dielectron production in the mass range of 0.25 2 GeV/c2 is enhanced by a factor of over the expectation from neutral meson decays. The data is compared to transport model calculations and seem to favor the version including in-medium effects.
Furthermore, the development of a new technology to manufacture
ultralightweight mirrors for Ring Imaging Cherenkov detectors
(RICH) is described. Replacement of the RICH-2 glass mirror by a
mirror almost transparent to electrons would considerably improve
the performance of the upgraded CERES detector system including a
radial Time Projection Chamber (TPC).
Zusammenfassung
In dieser Arbeit wird die Produktion von Elektronenpaaren kleiner Masse in Pb-Au Kollisionen bei 158 A GeV/c mit Hilfe des Cherenkov Ring Elektron Spektrometers (CERES) am Super Proton Synchrotron Beschleuniger (SPS) des CERN untersucht. Ziel des Experimentes ist der Nachweis von Veränderungen der Eigenschaften von Hadronen in einem dichten und heißen Medium aus Kernmaterie. Der Schwerpunkt der hier präsentierten Neuanalyse des Datensets von 1996 ist die detailierte Untersuchung der kombinatorischen Untergrundsubtraktion mit der Methode der gemischten Ereignisse. Die Ergebnisse der Untersuchung bestätigen die vorhergehenden Resultate von CERES. Die im Massenbereich 0.25 2 GeV/c2 gemessene Rate von Elektronenpaaren übersteigt die Erwartung von den Zerfällen neutraler Mesonen um einen Faktor . Die Daten werden mit theoretischen Vorhersagen im Rahmen eines Transportmodells verglichen. Die beste Übereinstimmung ergibt sich mit einem Szenario, welches Mediumeffekte einschließt.
In einem weiteren Teil der Arbeit wird die Entwicklung einer neuen Technologie zur Herstellung ultra-dünner Spiegel für Ringabbildende Cherenkov Detektoren (RICH) beschrieben. Der Austausch des gegenwärtigen RICH-2 Glasspiegels mit einem für Elektronen fast transparenten Spiegels würde die Leistung des mit einer TPC nachgerüsteten CERES Detektorsystems beträchtlich steigern.
Acknowledgements
Completing this thesis gives me an opportunity to express my
gratitude to many people who have been important to me during my
time at GSI.
First of all, I would like to thank my advisor,
Prof. Peter Braun-Munzinger. I have learnt much from him. His
personal amiability and professional enthusiasm have helped make
the research enjoyable and interesting. I wish to thank Dariousz
Miskowisz, Hiroyuki Sako, Jana Slivova, Peter Glässel, and
Chilo Garabatos for many inspiring discussions and their
contributions to this work. I am indebted to Ralf Rapp for sending
me his recently computed dielectron spectra.
The people of Composite Optics Inc., Edward Lettner,
Audrey Clark, Randy Clark, and Helmuth Dorth, who were
instrumental in manufacturing the carbon-fiber-composite mirrors,
I thank for the successful cooperation.
I want to show my appreciation of the scientists and
staff of GSI, whose support and intellectual challenges I greatly
value. Prof. Johanna Stachel deserves my gratitude for providing
me with a stimulating work environment and access to the
facilities of the Physics Institute of the University of
Heidelberg. Of all the people who made my stays at CERN such a
pleasant one I would like to specially mention Wolfgang Schmitz,
Thomas Wienhold, Geydar Agakishiev, Harry Appelshäuser, Ingrid
Heppe, Heinz Tilsner, Hannes Wessels, and all collaborators of the
CERES experiment.
I am indebted to the German Scholarship Foundation and
The Melton Foundation for supporting me.
Furthermore, I thank my girlfriend Anne Köhler for encouraging me throughout the work and for her invaluable help in proofreading this thesis. Finally, I would like to thank my parents for all the support and encouragement they have given me throughout my education.
Chapter 1 Preface
This thesis is about the study of dielectron production in Pb-Au collisions at 158 GeV/c per nucleon measured with the Cherenkov Ring Electron Spectrometer (CERES) at the Super Proton Synchrotron (SPS) accelerator at CERN. Part of the heavy ion research program at CERN, CERES is committed to the exploration of nuclear matter under extreme conditions of high temperature and high density.
The interdisciplinary field of ultrarelativistic heavy ion collisions combines the elementary interaction aspect of high-energy particle physics with the macroscopic matter aspects of nuclear physics. It is focused on the investigation of the properties of nuclear bulk matter made up of strongly interacting particles, i.e. hadrons, quarks, and gluons. The prediction is that nuclear matter would undergo a phase transition to a quark-gluon plasma (QGP) [1], a gas of freely moving quarks and gluons. This triggered not only a strong theoretical interest in this field but also initiated a huge experimental effort to verify the prediction.
First evidence for this new state of matter was found at CERN in the beginning of the year 2000 [2]. CERES was one of the experiments contributing to this fundamental discovery.
During the phase transition, the quarks are expected to lose their constituent mass which leads to the restoration of chiral symmetry. Left- and right-handed quarks decouple and hadronic states of opposite parity become degenerate.
The study of deconfined or chiral matter is not only relevant for the understanding of heavy ion collisions but also for astrophysics and cosmology. The environmental conditions of a 158 A GeV/c Pb-Au collision at the SPS accelerator resemble those encountered in the evolution of the early universe, where a few tens of microseconds after the big bang a transient stage of strongly interacting matter persisted at temperatures of about K and low baryon density. Another extreme of high densities and low temperatures created in heavy ion collisions at the SIS accelerator is close to the conditions occurring in the interior of neutron stars [3, 4, 5], where mass densities are likely to exceed kg/m3 - about four times the density of nuclei.
Chapter 2 Relativistic heavy ion physics
2.1 Hot and dense nuclear matter
The observations of particle production in heavy ion collisions are related to the evolution of hot and dense matter - a general question of relativistic heavy ion physics - and in particular to the transition of hadronic matter to a quark-gluon plasma and the simultaneous restoration of chiral symmetry.
First, the fundamental physics properties to describe a strongly interacting system of nucleons in vacuum shall be introduced. Next, the modifications in the presence of a hot and dense medium are discussed with special emphasis on theoretical concepts applied to explain experimental data. Finally, dielectron production is related to the properties of hadronic processes occurring in nuclear collisions. In this section, the velocity of light and Planck’s constant are set to = = 1.
In the Standard Model of particle physics, nucleons are constituted of quarks and gluons. Each flavor of quark comes in three colors: red, blue, and green. The quark color wavefunction can be written as a vector of Dirac spinors:
| (2.1) |
The strong interactions of quarks and gluons are described by Quantum Chromodynamics (QCD), a local gauge theory. The dynamics are governed by the Lagrangian of QCD:
| (2.2) |
Considering the relevant light quark flavors, the spinor is represented by u, d, and s quark (i.e. ). The matrix in flavor space is composed of the bare quark masses, i.e. , , and , on the diagonal.
The gluonic part of the Lagrangian is determined by the gluonic field strength tensor:
| (2.3) |
where and denote the strong coupling constant and the structure constants of the group [6], respectively.
To achieve invariance of QCD under local SU(3) gauge transformation the derivative takes the form:
| (2.4) |
It induces a coupling between the spin-1/2 colored quarks fields and the gluonic spin-1 gauge fields. The coupling strength - commonly expressed in terms of the strong “fine-structure” constant - increases with space-time distance or equivalently decreases with the momentum transfer of a given strong process [7]:
| (2.5) |
This particular behaviour is a consequence of the self-interaction of gluonic fields leading to an antiscreening of the strong interaction which dominates the screening of the quark color by quark-antiquark bubbles. The reference is fixed by measurements at a certain scale where is small enough to justify a perturbation expansion, e.g. at the Z boson mass 91 GeV/c2 [8].
At large distance scales, quarks and gluons are confined in colorless mesons and baryons. Only at short distances can perturbation theory be applied, as quarks and gluons are quasi-free (asymptotic freedom). The breakdown of perturbation theory for at momentum transfer of about GeV/c, encountered in heavy ion collisions, poses the most challenging problem in theory. Both the effective couplings and the relevant degrees of freedom change rapidly with scale.
In the limit of vanishing quark mass, the QCD Lagrangian exhibits additional symmetries that can be explored. It becomes invariant under global vector and axial-vector transformations in flavor space:
| (2.6) |
with parameters and being arbitrary vectors in flavor space. This results in conserved vector and axial-vector Noether currents:
| (2.7) |
Introducing the quark-spinor projections of right- and left-handed components:
| (2.8) |
the transformation 2.6 can be rewritten as:
| (2.9) | |||||
| (2.10) |
which describes a global SU(3)SU(3)L chiral symmetry in flavor space. This symmetry has two important implications. First, left- and right-handed quarks are not mixed dynamically and their handedness, i.e. the sign of the projection of spin on its momentum direction, is conserved. Second, corresponding vector and axial-vector resonances are degenerate, as the respective current-current correlation functions :
| (2.11) |
which determine the spectral shape of unstable resonances, are identical [9].
In the physical world, chiral symmetry is apparently spontaneously broken because chiral partners such as (770)- and (1260)-meson show a large mass splitting ( = 500 MeV/c2). Therefore, the ground state, i.e. the QCD vacuum, is not invariant under chiral transformation. In particular, the vacuum state only respects vector symmetries ( = +) [10], while the axial-vector symmetry ( = -) is spontaneously broken:
| (2.12) |
where is the axial-vector charge corresponding to the axial-vector current (see Eq. 2.7).
The strength of the symmetry breaking can be characterized by the vacuum expectation value of the Goldstone boson [11], which is the (nearly) massless pion :
| (2.13) |
where fπ is the measured pion decay constant of f MeV. It is expected that a transition from the asymmetric phase observed (see Eq. 2.12) to a phase where the symmetry of the vacuum is restored ( = = 0) can be triggered by external parameters such as temperature and/or pressure. The expectation value of the so-called chiral condensate :
| (2.14) |
is the lowest-dimensional order parameter characterizing the chiral phase transition. The quark condensate respects all unbroken symmetries of the Lagrangian, as it is a scalar density, diagonal in flavor space, and carrying a baryon number of zero.
The chiral condensate vanishes in the chiral symmetric phase but becomes finite in the asymmetric phase corresponding to a mixing of left- and right-handed quarks in the ground state. In other words, there is a finite expectation value to create a light quark-antiquark pair from a zero-point energy fluctuation of the physical vacuum.
The mixing strength of left- and right-handed quarks in vacuum is connected to the pion decay constant according to the Gell-Mann-Oakes-Renner relation [12]:
| (2.15) |
A value of = 93 MeV from pion decay measurements leads to a vacuum expectation value of (240 MeV)3 = 1.8 fm-3, which is large compared to the normal nuclear density of about 0.17 fm-3 [8], indicating a strong dynamical breaking of chiral symmetry.
Until now what has been discussed is the properties of hadronic matter in vacuum but what is of more interest is the dynamics in the presence of a hot and dense medium.
When hadronic matter is heated and/or compressed, initially confined quarks and gluons start to percolate between hadrons to finally be liberated. This phase transition to a plasma of quarks and gluons is accompanied by a melting of the quark condensate indicating chiral symmetry restoration. Even before the critical region is approached, the chiral symmetry is partially restored by the presence of hadrons. The valence quarks and the pionic cloud of a hadron produce a positive scalar density inside the hadron, thus effectively decreasing the (negative) quark condensate.
The expected modification of the condensate are derived for the case of high temperature T and low density. The equilibrium properties of a hadron gas in contact with a heat bath are described by the grand canonical partition function:
| (2.16) |
where is the Hamiltonian of the system, is the quark number operator, and denotes the quark chemical potential. The expectation value of the quark condensate is then given by the thermal average:
| (2.17) |
where the sum is carried out over all eigenstates of the QCD Hamiltonian. Equation 2.17 can be solved for the simplified case of a non-interacting hadron gas. The resulting correction reduces the quark condensate for increasing temperature:
| (2.18) |
Each hadron species present with scalar density contributes to the reduction of the condensate according to its sigma commutator . The latter quantity divided by quark mass is a measure for the integrated scalar quark density inside a hadron :
| (2.19) |
The particular temperature dependence of Eq. 2.18 can be explained as follows. In the physical vacuum, the color fields are squeezed into hadrons by the repulsion of the quark condensate which fills the vacuum. With increasing temperature this mechanism becomes inefficient, as thermal pions are produced as excitations of the quark condensate, locally changing the expectation value of the quark condensate.
Increasing density also reduces the quark condensate because more and more space is occupied by baryons (equivalent to turning on a baryon chemical potential). In this case, the nucleons give the dominant correction leading to a formula similar to Eq. 2.18:
| (2.20) |
where is the nucleon sigma commutator and denotes the nucleon scalar density at a given nucleon chemical potential . In nuclear matter at normal density, the quark condensate is already quenched by 30% according to a value of about 45 MeV for the nucleon sigma commutator [13].
The sigma commutator and the dropping of the chiral condensate can be estimated in the framework of effective theories, e.g. the -model [14], the Nambu-Jona-Lasinio model [15], or the Walecka model [16]. Figure 2.1 illustrates the melting of the condensate for the example of the Nambu-Jona-Lasinio model [17].
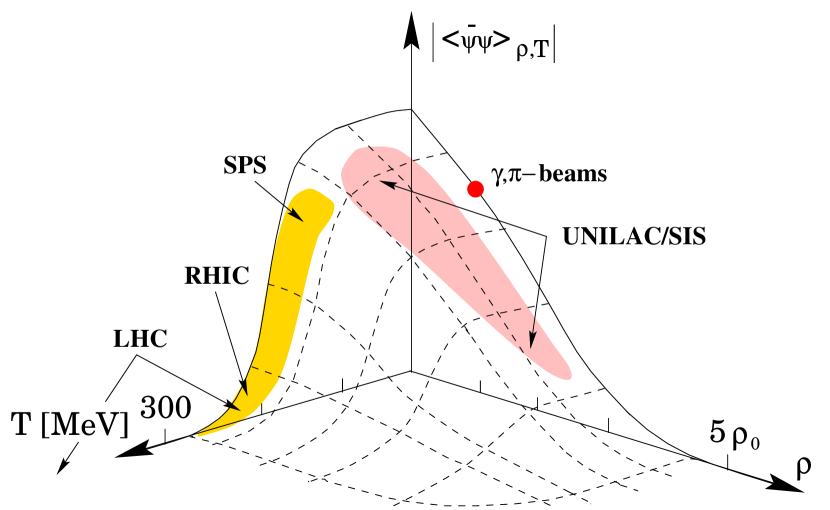
Expectation value of the quark condensate as described by the Nambu-Jona-Lasinio model [17, 18]. The regions accessible by various accelerators are highlighted.
Several effects preceding the phase transition towards a restoration of chiral symmetry were predicted by effective mean-field models. The most important effects are dropping hadron masses (BR-scaling) [19] and mixing of vector and axial-vector currents [20], both leading to modifications of the hadron spectral functions [21]. The competing models shall be discussed in detail in connection with the experimental results presented in Sec. 5.9.3.
Model-independent results are obtained by perturbative low-density expansion. However, this procedure is restricted to temperatures below 120 MeV and cannot address the nature of the phase transition. Of the non-perturbative approaches, only numerical lattice QCD calculations provide a stringent framework even though many-body theory [22] and renormalization-group techniques [23, 24] are promising developments.
The results of a lattice calculation including two quark flavors are depicted in Fig. 2.2.

The expectation value of the quark condensate plotted in the left panel, as expected, shows the sudden drop at the critical temperature indicating a phase transition restoring chiral symmetry. This transition is accompanied by a jump in energy density (see upper symbols in the right panel of Fig. 2.2) from a low hadronic value to nearly the level expected for an ideal gas of quarks and gluons (QGP) [27]. Up to now, lattice calculation do not allow to conclude whether deconfinement is a phase transition of first order, second order, or just a rapid crossover.
Lattice theory including non-vanishing baryon density has been impeded by technical difficulties. Other methods applicable at finite densities include random matrix theory [28, 29], random phase approximation [30, 31], instanton models [32, 33, 34], percolation [35, 36], and supersymmetric models [37]. But their predictive power has been rather limited. A general overview and evaluation of the available theoretical models is presented in [21].
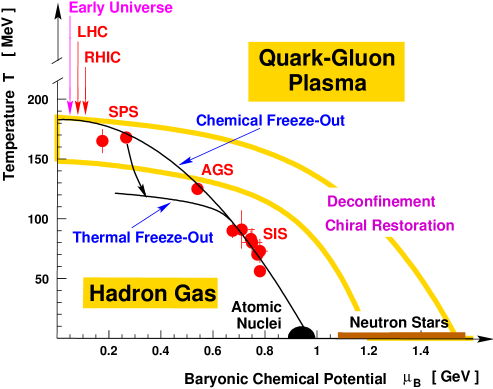
The emerging picture of the transition from hadronic to quark matter is illustrated in a schematic phase diagram in Fig. 2.3.
Despite the tremendous progress in recent years, dispute remains about the exact circumstances, at high temperatures and/or high densities, of restoration of broken symmetries in the medium under extreme conditions. Whether deconfinement and chiral symmetry restoration are two distinct phase transitions, or only one, is a matter of current debate. Lattice calculation indicate the critical temperatures of chiral restoration and deconfinement to coincide in the low-density scenario. In fact, [41] argues deconfinement in the light-quark sector to be triggered by the chiral transition.
Many probes [42, 43, 44, 45] have been proposed to map out the behavior of hot and dense hadronic matter and also to highlight its eventual transition to a quark-gluon plasma. Among those probes dileptons stand out for two reasons.
First, they couple directly to vector mesons. Therefore, hadronic processes are expected to reveal their properties in dilepton spectra. In particular, the dilepton rate allows for direct measurement of the imaginary part of the current-current correlation function in the medium (see Eq. 2.11) [46, 47]:
| (2.21) |
which determines in part the vector meson resonance [48, 49]. Apart from the kinematical constants describing the meson decay, the influence of the medium enters in the current-current correlation function which can be calculated by theoretical models discussed in Sec. 5.9.3.
Second, dileptons suffer minimal final-state interaction because they interact only electromagnetically and are therefore likely to bring information about the innermost zones of high-density and high-temperature matter, formed in the early stages of nuclear collisions, to the detector essentially unscathed. On the other hand, hadrons are rescattered and carry little information about the time prior to the freeze-out stage of the collision.
The schematic dilepton mass spectrum in Fig. 2.4 indicates the major dilepton sources in ultrarelativistic heavy ion collisions.
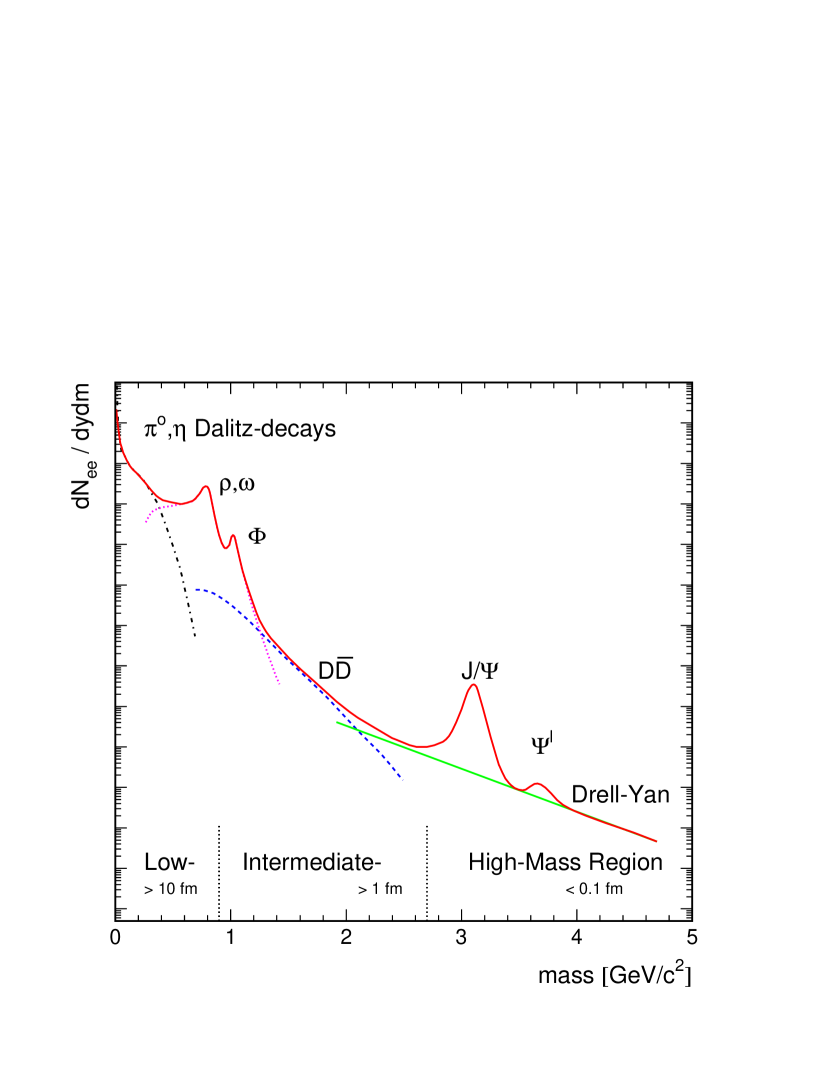
Schematic dilepton mass spectrum of ultrarelativistic heavy ion collisions.
In the high-mass region, dileptons stem from hard processes (mostly Drell-Yan annihilation) occurring in the early pre-equilibrium stage of the collision. Furthermore, a suppression of the and abundance has the potential to signal the onset of deconfinement, as the heavy-quark bound states are dissolved due to freely moving color charges (Debye screening). If not masked by an enhanced open-charm production, a thermal signal from plasma could be revealed by the observation of associated production in the intermediate-mass region [1, 47]. The low-mass region is the exclusive domain of the CERES experiment. It is dominated by soft processes involving the light quark sector. The dilepton continuum originates from Dalitz decays of neutral mesons such as and . The resonance peaks are due to direct decays , , . This region is particularly sensitive to in-medium modifications of the light hadrons which can signal the restoration of chiral symmetry. The -meson is of special importance because, once produced in a dense and hot hadronic environment, it will decay predominantly within the fireball due to its short lifetime. Compared to the other sources, the relative contribution of thermal dielectron radiation from a quark-gluon plasma is expected to be negligible at SPS energies [50].
2.2 The CERES physics program
The production of dileptons in hadronic collisions has been of great experimental and theoretical interest for more than 30 years. The early dilepton measurements were motivated by the search for the vector mesons in pp, pA, and A collisions. The unexpected observation of a continuous dilepton spectrum for mass below 600 MeV/c2 motivated the development of several theoretical models which are still relevant. Most notably was the prediction of the quark-gluon plasma - a new phase of matter - in 1978 [1]. The thermal radiation of the plasma comprises low-mass dileptons and direct photons.
CERN was the first laboratory worldwide to systematically investigate dielectron production in ultrarelativistic hadron-nucleus and nucleus-nucleus collisions. The Helios-1/NA34 collaboration was the first to measure and pair production in p-Be collisions [51]. The CERES/TAPS collaboration reproduced them with much greater precision. Figure 2.5 shows the measured dielectron invariant mass spectrum of p-Be and p-Au collisions at 450 GeV/c in comparison to the expected contributions of hadron decays.


The simulation of the so-called hadronic cocktail is based on the knowledge of the branching ratios of all relevant leptonic and semi-leptonic decays and the total production cross sections of neutral mesons measured in pp collisions (see App. A).
As evident from Fig. 2.5, the hadronic cocktail accounts for the measured dielectron yield. Previous speculations about an anomalous source of dileptons with mass below 600 MeV/c2 were found to have originated from an underestimation of Dalitz yield. This was proven by the exclusive measurement of the decay [53].
Most important, a reference based on pp and pA data was established to be used in nucleus-nucleus collisions for distinguishing between new in-medium effects and trivial dielectron sources.
Recent measurements of the low-mass dilepton yield in 200 GeV/c p-U collisions by the NA38/50 collaboration [54] and in 12 GeV/c p-C(Cu) collisions at KEK [55] could not be explained exclusively by the decay of the known hadronic sources. The NA38/NA50 collaboration found a significant excess in the mass window – GeV/c2. In-medium modification of the -meson could not explain the observed enhancement. NA38/50 conjectured that it may be due to annihilations (Drell-Yan process). This production mechanism is considered to be negligible in the CERES acceptance, i.e. for low transverse pair momentum 1 GeV/c, but may become important for lepton pairs with large transverse momentum predominating in the NA50 acceptance. Therefore, this measurement is not necessarily contradicting the CERES results. At KEK, the mass spectra of p-C and p-Cu collisions were found to differ significantly below the -meson peak (i.e. mass window – GeV/c2). This difference was interpreted as an in-medium modification of the -meson spectral shape at normal nuclear density. Since no such effect was found by CERES, further studies are necessary to settle the dispute about the role of in-medium modifications of vector mesons in pA collisions.
The situation changes dramatically for nucleus-nucleus collision. The dielectron yield observed in S-Au and Pb-Au collisions at 200 A GeV/c and 158 A GeV/c, respectively, significantly exceeds the expectations extrapolated from p-p collisions [56, 57, 58]. While the Dalitz peak is well reproduced by the hadronic cocktail, the local minimum expected between the -Dalitz component and the -resonance peak at around 500 MeV/c2 is entirely filled up, as apparent from Fig. 2.6.
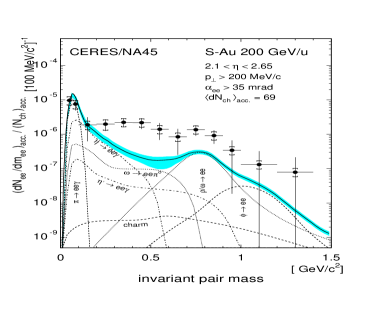

The integrated yield of pairs with mass above 200 MeV/c2 exceeds the hadronic cocktail by a factor of (stat.) and (stat.) for S-Au and Pb-Au collisions, respectively.
This result was confirmed by the observation of an enhanced production in 200 A GeV/c S-W collisions compared to 200 GeV/c p-W collisions by the HELIOS/3 collaboration [59].
The comparison of nucleus-nucleus collision at different bombarding energies, i.e. different initial conditions, should allow for independent interpretation of temperature and baryon-density driven changes of the dielectron spectrum.
The most recent result for dileptons is the measurement of the invariant mass spectrum of Pb-Au collisions at 40 GeV/c per nucleon (see Fig. 2.7). A recently resolved problem in GENESIS (see App. A) resulted in a 30% increase of the predicted low-mass yield compared to [60, 61]. The data plotted in Fig. 2.7 were taken from [61] and normalized to the expected yield of pairs with mass below 200 MeV/c2 according to the procedure described in [60].

Dielectron invariant mass spectrum of Pb-Au collisions at 40 GeV/c per nucleon. The data in [61] were normalized to the expected low-mass yield simulated with GENESIS (see App. A). The integrated yield of pairs with invariant mass above 200 MeV/c2 of corresponds to an enhancement factor of (stat.).
An enhancement of the dielectron yield, larger even than in the 158 A GeV/c data, is observed, relative to the expected yield of hadronic sources. Since the detector system upgraded in 1998 was not yet fully operational, the data set is limited in terms of statistics and momentum resolution.
The experimental results on dilepton production in nucleus-nucleus collisions have experienced many responses from theoretical physicists. These were mainly stimulated by the prospects of chiral symmetry restoration and deconfinement (see fig. 2.8).
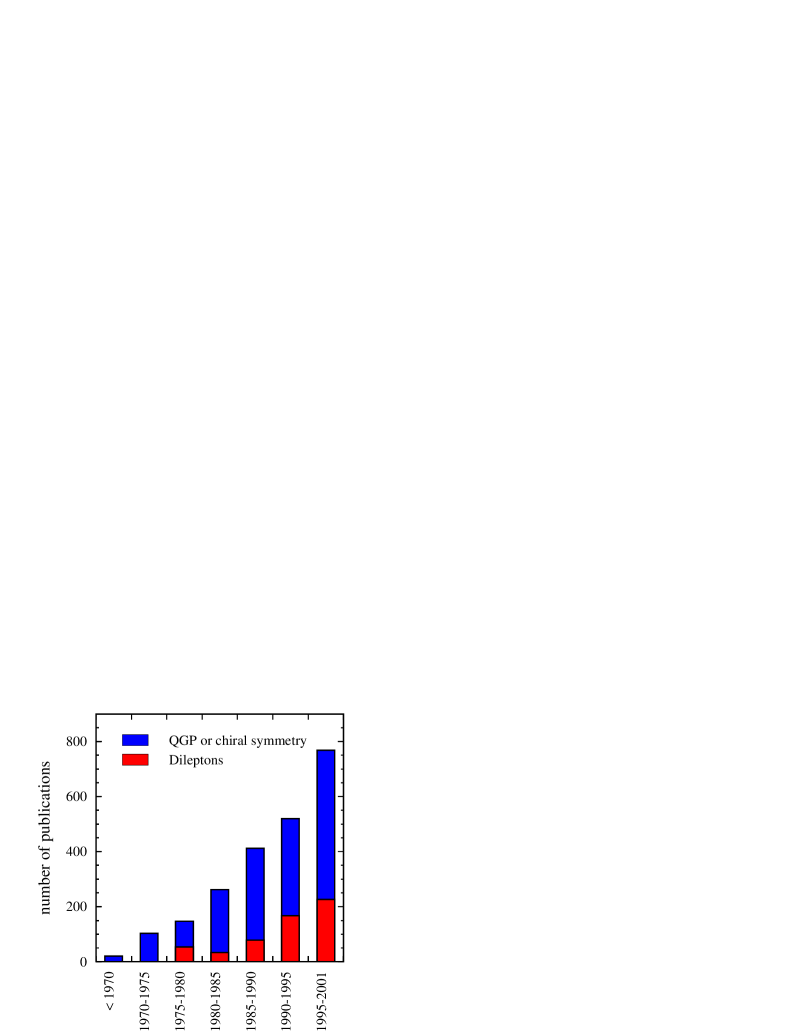
Number of publications related to dileptons, chiral symmetry, and quark-gluon plasma in the SLAC-SPIRES-HEP database [62].
Aside from the focus on dielectrons, the CERES collaboration has also extensively studied charge particle production [63], high momentum pions [63, 64], direct photon production [65, 66], and azimuthal correlations of charged particles (i.e. flow) [67]. The upgrade of the spectrometer with the TPC allowed to greatly extend the scope of CERES towards hadronic observables. Recent results [60, 68] include the measurement of Bose-Einstein correlations, mean transverse momentum fluctuations, and hadronic production of , , and K0.
Chapter 3 The CERES detector
3.1 Setup
The CERES experiment was designed for the detection of dielectrons with invariant mass up to 2.0 GeV/c2, covering a range in pseudo-rapidity of [69, 70]. The initial setup consisted of two ring imaging Cherenkov detectors (RICH), placed before and after an azimuthally deflecting magnetic field. The RICH detectors provide particle identification and a measurement of the trajectory. The azimuthal deflection in the magnetic field determines the momentum. The measurements of p-Be, p-Au, and S-Au collisions [52, 53, 56] were performed with this configuration.
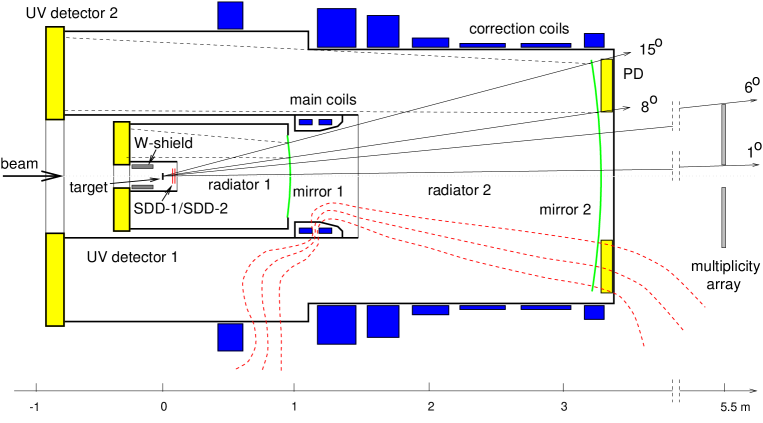
In 1994 and 1995, the spectrometer was substantially upgraded in order to cope with the high multiplicity environment encountered in ultrarelativistic Pb-Au collisions. The original setup was extended by two silicon drift detectors (SDD) and a multiwire proportional counter with pad readout (PD) as illustrated in Fig. 3.1.
The SDDs sample each track on two additional points. This allows for a precision reconstruction of the event vertex, a measurement of the energy deposition , and a reliable determination of the charged-particle multiplicity. The main purpose of the PD is to help the ring recognition in the RICH detectors. The enhanced track reconstruction and electron recognition capabilities were demonstrated with the study of high-momentum pion and dielectron production in Pb-Au collisions at 158 GeV/c per nucleon recorded in 1995 [63, 71].
The 158 A GeV/c Pb-Au collision data analyzed in this work was recorded in 1996 with the setup shown in Fig. 3.1. The following section gives a brief description of the individual components of the experimental setup.
3.2 Target region
The setup of the target region is shown in Fig. 3.2. The target consists of 8 gold foils of diameter and thickness. For the particles to hit just one of the consecutive targets disks, a space of 3 mm between targets is chosen, minimizing the probability of secondary interactions. The target is surrounded by a tungsten shield to protect the readout of the RICH UV-detectors from highly ionizing particles scattered backwards.
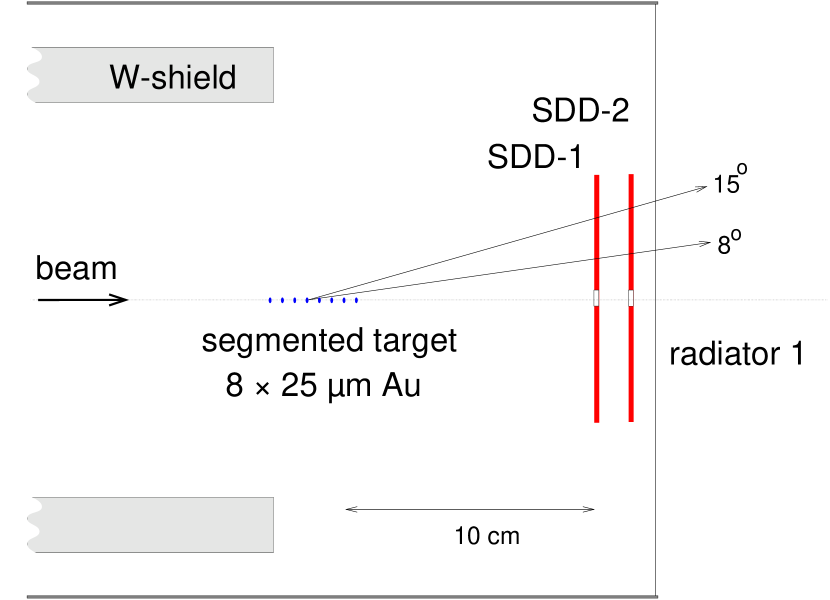
Schematic view of the CERES target region.
3.3 Silicon drift detector
The first detector system of the CERES apparatus, located downstream of the target, is a doublet of silicon drift detectors (SDD) of diameter [72]. The CERES experiment was first to successfully employ this type of radially symmetric position-sensitive detector [73]. A detailed description of these detectors is given elsewhere [74].
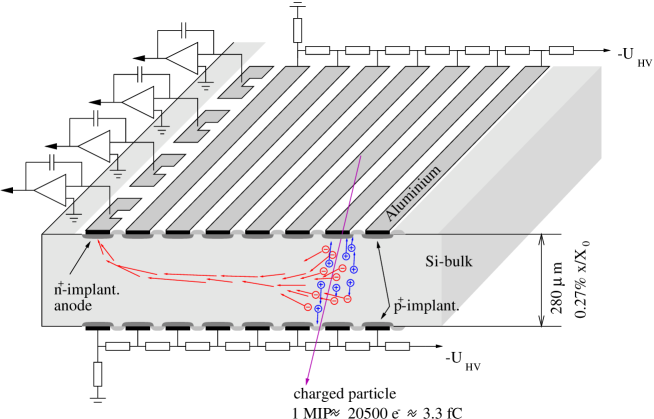

The basic principle of operation is illustrated in the upper panel of Fig. 3.3. A charged particle traversing the detector produces a cloud of electron-hole pairs inside the depleted region of the semiconductor. The particle energy required to create an electron-hole pair is about 3.6 eV [75]. The charge deposited by a minimum ionizing particle in a 280 m thick Si-detector is about 3.3 fC (20500 electrons) corresponding to an average energy loss of 74 keV.
In radial electric field generated by a set of concentric implanted voltage dividers, the electrons drift radially towards a segmented anode at the outer circumference of the silicon wafer. The segmented anode, shown in the lower panel of Fig. 3.3, consists of 360 partially interlaced pixels to provide a precise azimuthal position measurement. The charge signal collected for each anode is digitized by a fast FADC with a sampling frequency of 50 MHz. Given the drift velocity known, the radial position of a charged-particle hit can be determined by a measurement of the drift time with respect to the first-level trigger.
3.4 Ring Imaging Cherenkov detector
The essential components of the 1996 CERES apparatus are two Ring Imaging Cherenkov detectors (RICH). The first of these is situated between the SDDs and a short super-conducting double solenoid, and the second is behind the solenoid. An electron produced in a collision emits Cherenkov photons while traversing the Methane filled radiator volume. A spherical mirror reflects the Cherenkov light to form a ring image at the mirrors focal plane. In case of RICH-2, the mirror is split up in 8 smaller panels of equal size for manufacturing reasons. The geometry of one such panel is shown in Fig. 3.4.

Geometry of RICH-2 mirror panel.
The imaging properties are described in detail in Sec. 4.2.2. The photons are detected in a position sensitive UV-detector located at the image plane. This gas detector is filled with helium, methane, and Tetrakis-dimethylamino-ethylene vapor (TMAE) [76]. The high quantum efficiency of TMAE in the UV region made it the preferable detector gas at the time when CERES was designed. The UV-detectors of RICH-1 and RICH-2 are separated from the radiator volume by a CaF2 and a quartz window, respectively.
Electrons emitted after photoabsorption in TMAE are amplified in three steps: two parallel-plate avalanche stages and a subsequent Multi-Wire Proportional Counter (MWPC). After an amplification by a factor of –, signals are read out on 50000 individual pads covering the geometric acceptance. A complete description is given in [70, 77, 78].
3.5 Magnetic field
To determine particle momentum, a magnetic field of 7 T is produced between RICH-1 and RICH-2 detector by a pair of super-conducting coils with alternating currents. The currents in the additional correction coils are adjusted for the field lines in the RICH-2 radiator to point back to the target and the RICH-1 detector to become almost magnetic field free. This particular field shape is illustrated in Fig. 3.1.
Particles crossing the radially increasing magnetic field ( ) between RICH-1 and RICH-2 are azimuthally deflected by an angle :
| (3.1) |
The polar angle of the particles is approximately conserved because particle trajectories and magnetic field lines in RICH-2 do not cross in this direction. However, all particles traversing the RICH-2 detector are slightly bend towards the beam axis according to their initial azimuthal deflection. This so-called second-order-field effect is illustrated in Fig. 3.5.
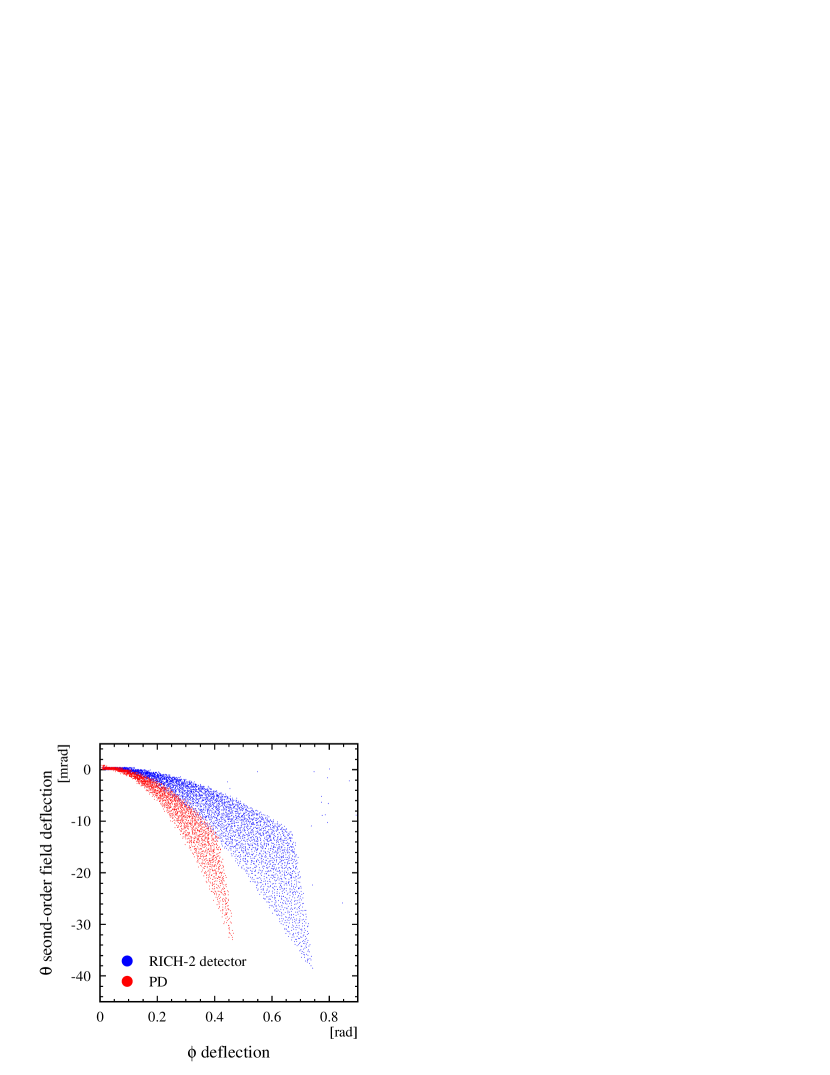
Second-order-field effect modification of track polar angle as a function of the deflection in the magnetic field. Small deviations from the -radial-field gradient result in a variation of the second-order-field deflection depending on the polar angle of the particle.
While RICH-2 measures the local space direction of the trajectory in the radiator, the Pad Chamber samples a point on the particle trajectory with respect to the vertex. Therefore, the azimuthal deflection observed in RICH-2 is about 1.5 times larger than in the pad chamber.
To simulate the particle trajectories in the presence of the B-field, the Poisson program package [79] was used to calculate a field map for the CERES geometry because the magnetic field distribution has not been measured directly. The accuracy of the map was estimated to be better than 0.5%.
3.6 Pad Chamber
The Pad Chamber (PD) is located downstream of the RICH-2 radiator. It consists of a MWPC with pad readout. Each of the 20000 pads has a dimension of 77 mm2, which results in an angular resolution of better than 0.6 mrad. The main purpose of the PD is to limit the number of possible electron track candidates, given by the combination of rings in the RICH-1 and RICH-2 detectors, by measuring an additional point on the particle trajectory. This background reduction is vital in the high charged-particle multiplicity environment of Pb-Au collisions. Furthermore, the PD provides an independent reference frame for the geometry calibration of the other detectors [63]. An exhaustive description is given in [80].
3.7 Trigger system
The CERES trigger system consists of three Cherenkov counters (BC1, BC2, BC3) and two plastic scintillator detectors: veto counter (VC) and multiplicity detector (MD). BC1 is located 60 m upstream of the experiment, BC2 and BC3 are directly before and after the target, respectively. MD is at the downstream end of the spectrometer.
The minimum-bias collision trigger requires a lead signal in BC1 and BC2, and no signal in BC3. The central trigger additionally demands a signal in MD, with the threshold set at a level corresponding to 100 charged particles. This is equivalent to the most central 35% of the geometrical cross section. To avoid beam pile-up, the particle which triggers the reaction must not be followed or preceded by any other lead particle going through BC1 for several microseconds.
3.8 1998 detector upgrade
The CERES detector system was upgraded in 1998 by the addition of a new magnet system and a radial Time Projection Chamber (TPC) [81]. The PD and the multiplicity detector were removed. This new setup is illustrated in Fig. 3.6.
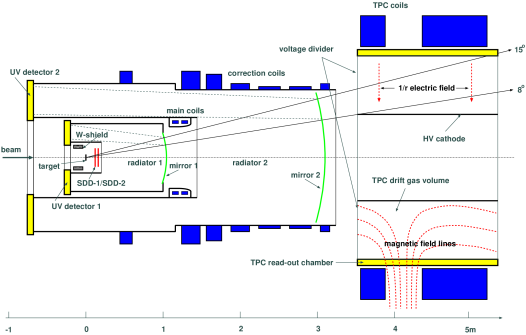
There are three major benefits of the upgrade. First, the high-precision momentum measurement of the TPC is expected to improve the mass resolution to [68]. Second, between the RICH detectors no magnetic field is applied, allowing to operate both detectors in a combined way with doubled photon statistics for the RICH rings and increasing efficiency [60]. Third, considerable reduction of the combinatorial background can be achieved due to higher photon statistics in the RICH detector and the additional d/d measurement in the TPC. Furthermore, the spectrometer capabilities for the study of hadronic observables are significantly extended.
Chapter 4 Development of an ultralightweight mirror for RICH detectors
4.1 Reasons for the replacement of the RICH-2 mirror
After the upgrade of the CERES experiment with a TPC downstream of the existing detector as described in Sec. 3.8, a new tracking scheme has been developed in order to improve background rejection. According to this scheme, both RICH detectors are operated without magnetic field and allow a combined use for electron identification and tracking while the momentum is measured separately in the TPC. All particles must traverse the RICH-2 mirror before entering the TPC. Multiple scattering in the mirror material changes the particle direction and, thus, deteriorates the invariant mass resolution. Additionally, electrons lose energy by Bremsstrahlung. The resulting low energy tail impedes the spectroscopy of vector resonances. Therefore, the replacement of the thick RICH-2 glass mirror by an ultralightweight mirror almost transparent to dielectrons would considerably improve the performance of the new detector system as will be discussed in detail in the following sections.
4.2 Impact of the RICH-2 mirror on the spectrometer performance
4.2.1 Interaction of electrons in matter
High-energy electrons traversing the matter of a mirror are affected in two ways. First, all electrons with momentum p are deflected due to multiple Coulomb scattering from nuclei with a probability depending on the thickness x and the radiation length of the material. The Coulomb scattering distribution is roughly Gaussian for small deflection angles, with a width given by:
| (4.1) |
Second, electrons lose energy by bremsstrahlung at a rate nearly proportional to their energy. The cross section can be approximated in the ”complete screening case” as [8]:
| (4.2) |
with y=k/E being the fraction of the electron’s energy transferred to the radiated photon. The energy loss due to scattering and ionization is negligible compared to bremsstrahlung for electrons with MeV/c2 as illustrated in Fig. 4.1 [8].
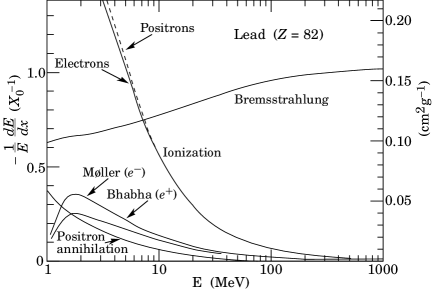
The thickness of matter in terms of electron energy loss can be conveniently measured in units of the radiation length which is the mean distance over which a high-energy electron loses all but of its initial energy by bremsstrahlung. The radiation length can be approximated for a material with a charge number Z and a mass number A as [8]:
| (4.3) |
For compounds or mixtures each material contributes with a fraction wj proportional to its molecular weight Aj:
| (4.4) |
The material thickness, which corresponds to , is given in Table 4.1 for several materials.
| material | density | thickness | comment |
| in g/cm2 | () | ||
| soda lime float glass | mm | CERES RICH-2 mirror | |
| carbon fiber (MAN) | 1.7 | mm | CERES RICH-1 mirror |
| carbon fiber (HEXCEL) | mm | COI prototype | |
| Poly-Carbon ceramic | mm | HADES mirror [82] |
4.2.2 Imaging properties of the RICH detector
A brief review on the fundamentals of RICH detectors with special emphasis on the CERES RICH detector will precede more extensive discussion of the impact of the RICH-2 mirror on the performance of the CERES spectrometer.
A Ring Imaging Cherenkov detector measures the photons radiated by a charged particle traversing a transparent medium (radiator) with a velocity higher than that of light in the medium. The emission angle of the so-called Cherenkov photons is then determined by the index of refraction n of the radiator medium and the velocity of the charged particle:
| (4.5) |
At atmospheric pressure gases have refraction indices close to one. The threshold velocity is best expressed in terms of the Lorentz factor :
| (4.6) |
Methane (CH4) with was chosen for the radiator gas of the CERES RICH [77]. It makes the detector almost blind to hadrons, except to pions with a momentum of more than GeV/c. The Cherenkov photons emitted along the trajectory of the particle in the radiator and reflected by a spherical mirror create a ring image at the focal plane. The particular optical scheme is illustrated in Fig. 4.2.
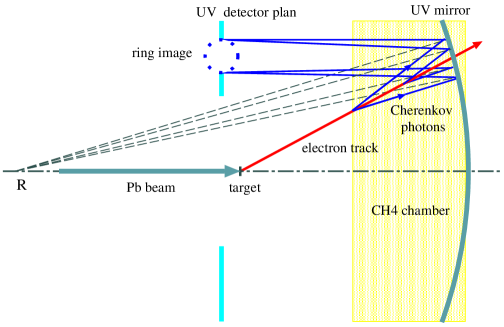
A photon detector, located at the focal plane, allows to determine the ring position and radius, as well as the number of photons (see Fig. 4.3).
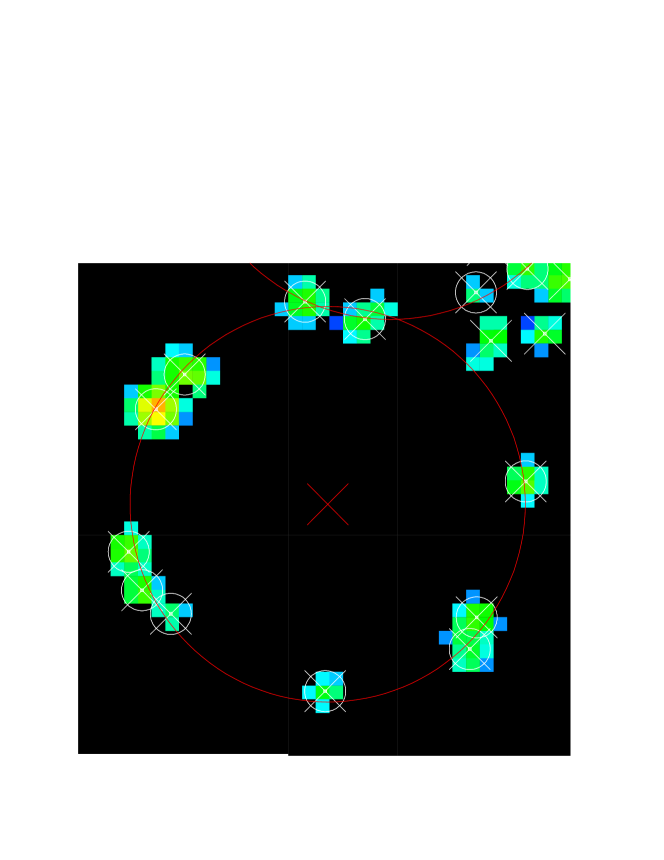
Asymptotic electron ring reconstructed from 11 photon hits in RICH-1 [83].
The ring-center position is a measure of - and -coordinates of the original charged-particle track. The ring radius is related to the photon emission angle and, thus, to the velocity of the particle. The Cherenkov angle approaches its asymptotic value for electrons with a velocity close to the speed of light ():
| (4.7) |
Formula 4.7 applied to CERES geometry results in an electron ring radius of R mrad, slightly depending on radiator temperature and atmospheric pressure.
The efficiency of the ring reconstruction depends strongly on the number of detected photon per charged particle. The total number of photons emitted per unit path length and unit photon energy interval is related to the half-angle of the Cherenkov cone:
| (4.8) |
and, thus, to the index of refraction of the radiator gas which is a function of photon energy.
The energy range of the detected photons is limited by the photo-sensitivity of TAME (eV) [84] and the ultraviolet transparency of the quartz entrance window (eV) [85, 86] which separates the UV detector from the radiator. In this energy range, the index of refraction is very close to one and nearly constant. The temperature gradient in the radiator is small due the continuous gas flow. Therefore, the expected total number of photons for a radiator of length L is given by:
| (4.9) |
The factor , called the figure of merit, is defined by the product of quantum efficiency of the UV-detector Q, total transmission of radiator gas and quartz entrance window T, and mirror reflectivity R:
| (4.10) |
The emission probability for k Cherenkov photons is described by a Poisson distribution:
| (4.11) |
where , the mean number of photons, is given by Eq. 4.9. Successful detection of an electron requires the reconstruction of a ring image composed of k single photon hits. The reconstruction efficiency depends strongly on the mean number of photon hits per ring excluding background contributions [87]. Thus, it is limited by all contributions in equation 4.10, in particular by the UV reflectivity of the mirror coating. Additionally, the UV detector spokes and small gaps between adjacent mirror segments lead to a local reduction of the number of detected photons.
The right assignment of a RICH ring to the external track information is of great importance for efficient particle tracking. It is determined by the ring-center resolution and, thus, by the mean number of hits per ring and the single-hit resolution according to:
| (4.12) |
There are four major contributions to the single photon hit resolution. First, multiple scattering of the charged particle within the radiator contributes on average mrad. Second, the chromatic dispersion of the radiator gas results effectively in a smearing of Cherenkov angle according to:
| (4.13) |
being the rms width of the index of refraction averaged over the bandwidth and weighted with the probability to detect a photon QTR (see Eq. 4.9). With mrad, chromatic dispersion [87] is by far the dominating contribution to the single-hit resolution. Third, mirror shape irregularities that occur on a scale of less then the radius of a Cherenkov light cone distort the ring image and, thus, contribute to the single-hit resolution. This is one of the main issues of this chapter. Large scale mirror deformations shifting the entire ring can be corrected to first order by local adjustment of the focal length, provided the deformations are continuous for adjacent mirror segments. Finally, the granularity of the UV-detector as determined by a pad size of ( mm)2 for RICH-1 and ( mm)2 for RICH-2 (equivalent to about mrad per pad in both cases) results in an expected single-hit resolution of mrad for the RICH-1(RICH-2) detector.
To protect the UV-detectors from particles produced in the collision, the target is placed at which leads to a small deviation from the ideally flat focal plane. The contribution thereof to the single-hit resolution is negligible.
All contributions are independent and, hence, add in quadrature to the single photon resolution:
| (4.14) |
4.2.3 Simulation of energy loss in the RICH-2 mirror
The effect of bremsstrahlung was studied using a GEANT detector simulation [88] including contributions of multiple photon radiation in the inhomogeneous material distribution of the CERES setup according to Eq. 4.2.
Figure 4.4 shows the relative energy loss of electrons due to bremsstrahlung in the CERES setup upstream of RICH-2 ( of a radiation length), which is dominated by the target and the RICH-1 mirror, and the additional contribution of an ultrathin RICH-2 mirror ( of a radiation length) in comparison to the present thick mirror ( of a radiation length).
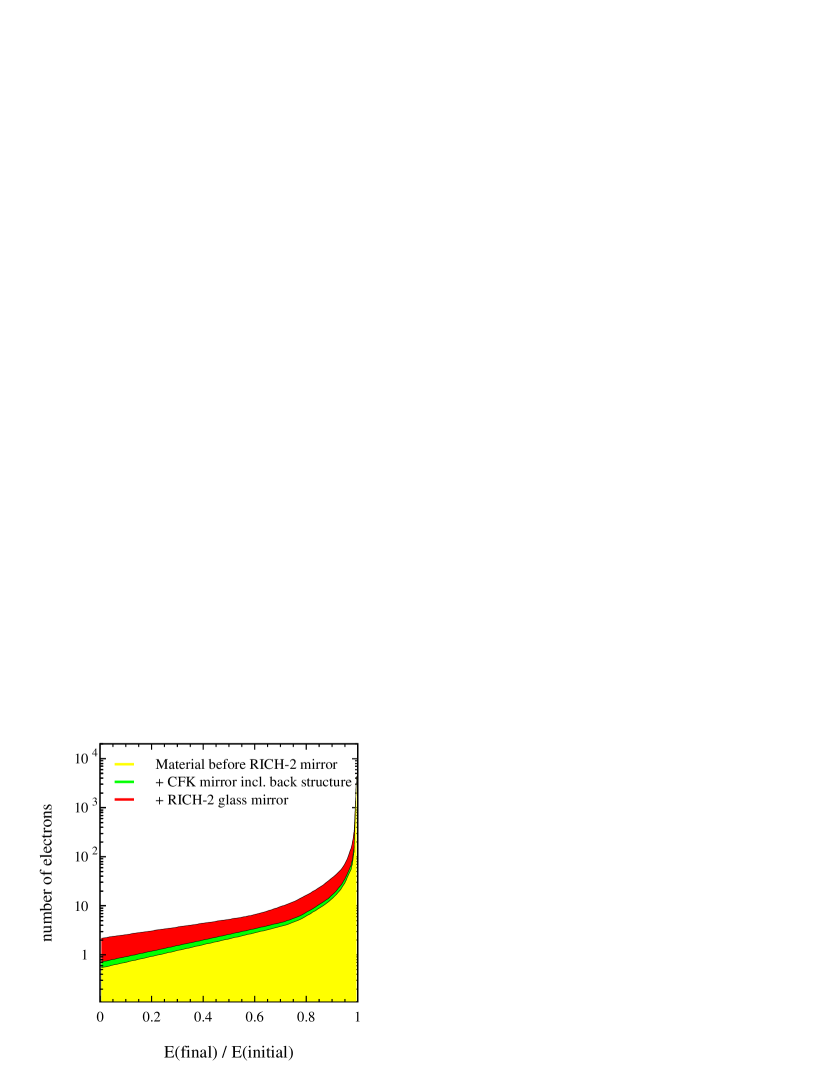
Relative energy loss of electrons because of bremsstrahlung.
Considering the logarithmic scale in Fig. 4.4, it becomes obvious that the RICH-2 glass mirror is presently the dominating source of bremsstrahlung leading to a significant low energy tail for every resonance in the dielectron pair mass spectrum. To verify this for the mass region of interest, the dielectron decay distributions of - and -mesons were folded with the bremsstrahlung spectrum. Figure 4.5 shows the result for the case of the resonance.
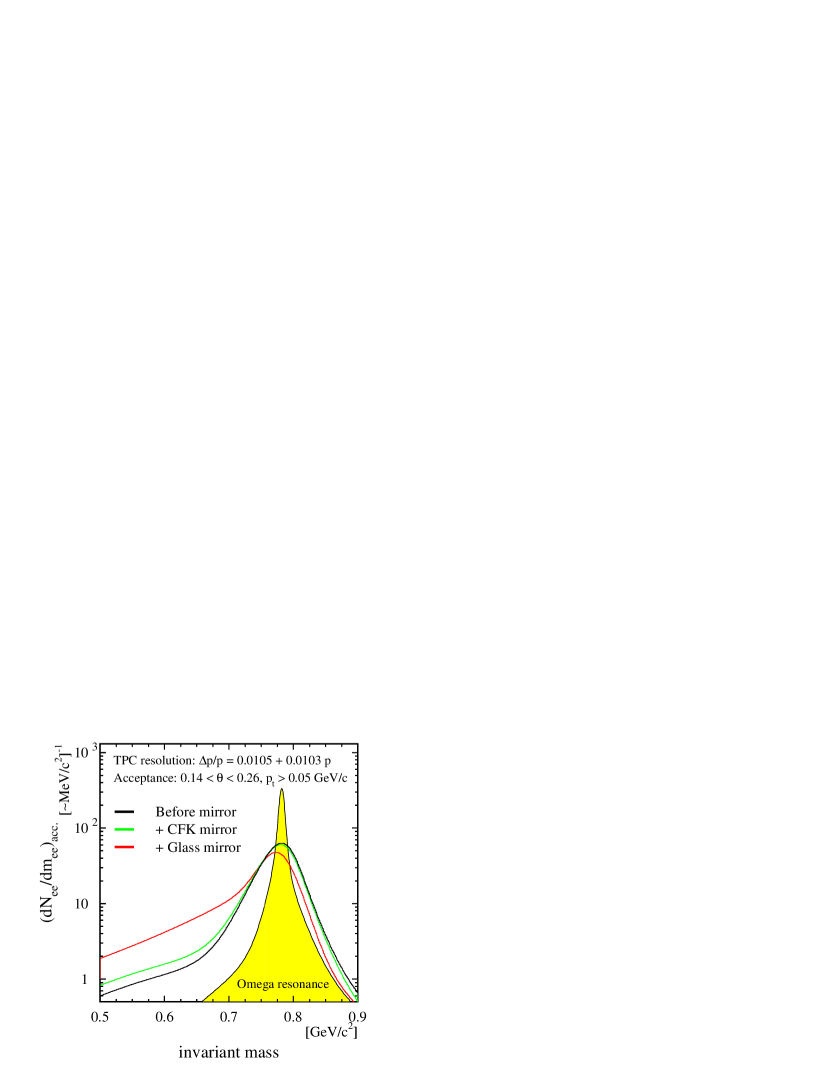
Impact of the RICH-2 mirror on the spectrum of the resonance. A Breit-Wigner function was assumed for the spectral shape of the resonance.
The number of dielectrons in the peak drops significantly due to the bremsstrahlung tail. Discriminating the resonance peak from the background of other sources becomes increasingly difficult. An ultrathin mirror, in comparison, would significantly reduce the dielectron loss almost to the minimum level determined by the upstream material. Although not shown here, the situation of the -meson is qualitatively comparable.
4.2.4 Quantitative estimate of the influence of the RICH-2 mirror on the invariant mass spectrum
A dielectron invariant mass spectrum was produced for quantitative study using the Monte Carlo detector simulation. The input distributions of various dielectron sources were obtained from the GENESIS event generator (see App. A). The appropriate momentum resolution and the CERES acceptance cuts were applied to the simulated mass spectrum.
To perform meson spectroscopy, the dielectron signal has to be obtained by subtraction of the uncorrelated background pairs according to Eq. 5.11 in Sec. 5.6. Next, the resonance signal Smeson can be extracted from the background of other dielectron sources :
| (4.15) |
For an expected signal-to-background ratio of 1/10 in the mass region of - and -resonance, the relative error of the signal Smeson/Smeson is dominated by the statistical error of the uncorrelated background of dielectron pairs :
In the next step, the meson signal is determined for each mirror version integrating the pair yield within the 3-width of the original resonance peak (see Fig. 4.5). The results are summarized in Fig. 4.7 and Table 4.2.
| Option | Total number | in | Total number | in |
|---|---|---|---|---|
| in peak | width | in peak | width | |
| RICH-1 | 2300 | 89.8 | 500 | 89.2 |
| RICH-2 (thin) | 2300 | 83.0 | 500 | 81.9 |
| RICH-2 (thick) | 2300 | 64.6 | 500 | 62.9 |
It turns out that the number of dielectrons in the peak would increase by as much as if the present thick mirror was replaced by an ultrathin mirror. The impact of the 30% difference is most profound in a low-statistics and high-background scenario because large width of mass bins and large statistical errors of the background subtraction (see Eq. 4.2.4) strongly reduce the statistical significance of the meson signal. The reduction of the multiple scattering in the thin mirror results in an improvement of the total momentum resolution by approximately at GeV/c and at GeV/c as seen in Fig. 4.6.
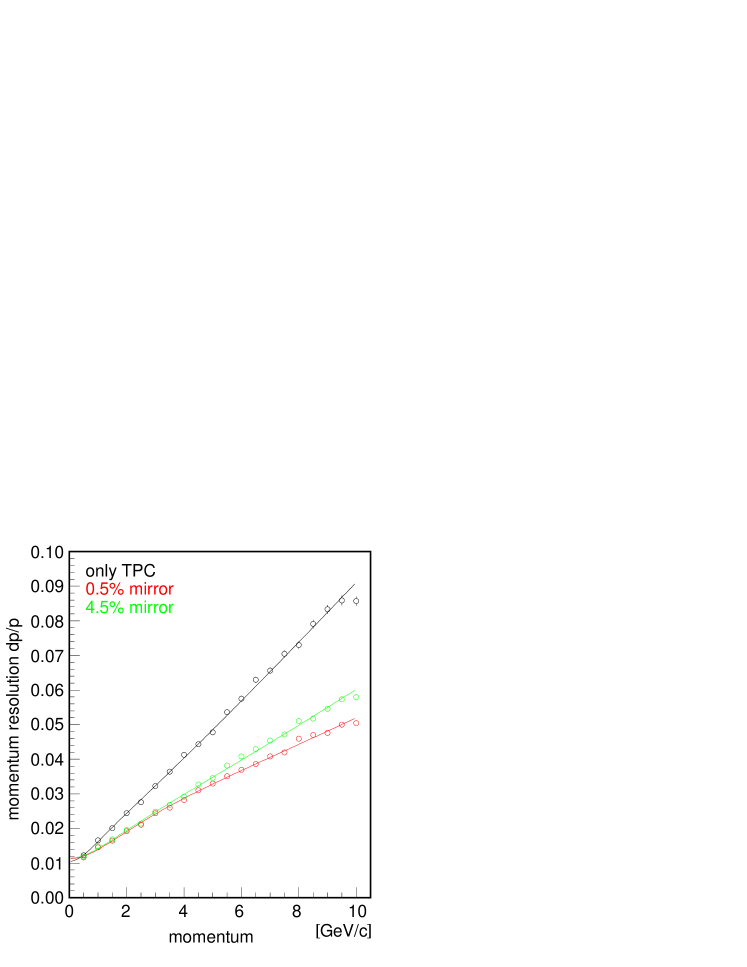
Momentum resolution of the CERES detector as simulated with the GEANT package [89].
It should be noted that in case of the thick mirror, shown in panel (4) of Fig. 4.7, the region between - and -meson peak, which is particularly sensitive to possible shape changes of the -meson, would be masked by the bremsstrahlung tail of the -meson resonance.
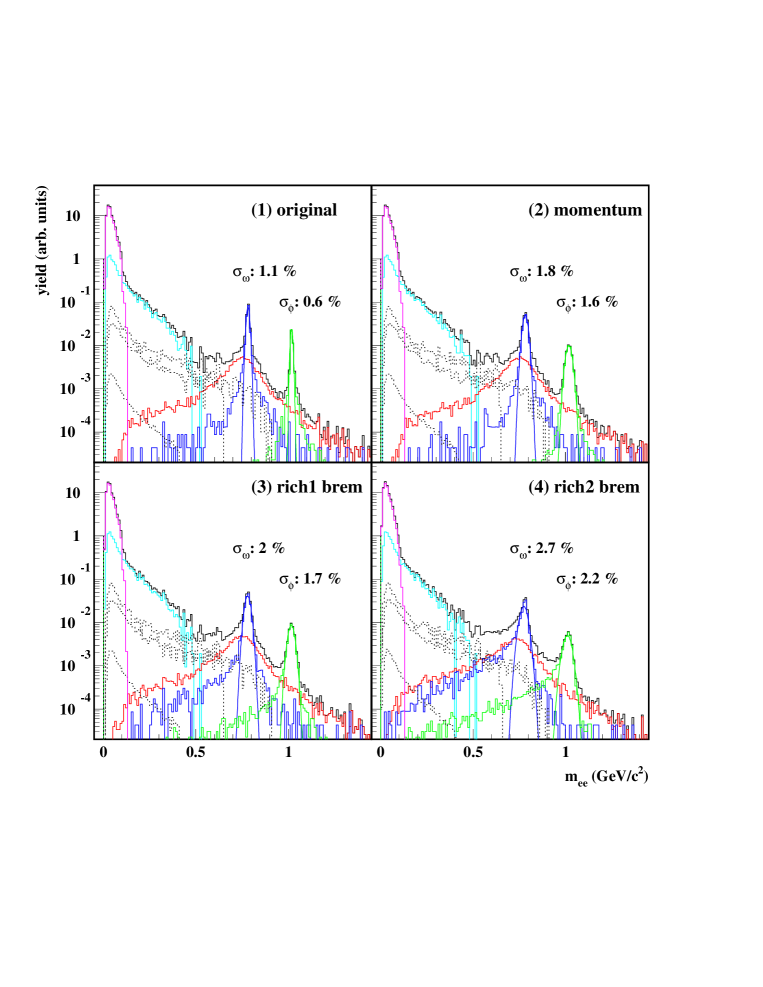
(1) cocktail of expected hadronic sources [90]
(2) including the limited momentum resolution
(3) including the modifications by bremsstrahlung in RICH-1 mirror
(4) including the modifications by bremsstrahlung in RICH-2 mirror
To summarize, spectroscopy of - and -mesons would greatly benefit from replacement of the present RICH-2 mirror by an ultrathin mirror. An increase in signal-to-background ratio of the meson resonances and better access to the spectral shape of the -meson peak are the two main prospects.
4.3 Ultralightweight RICH-2 mirror
In the past, manufacturing of ultralightweight mirrors has proven a technologically very challenging endeavor for two reasons [91]. First, reduction of the mirror thickness results in a quadratic decrease in bending stiffness making it increasingly difficult to maintain sufficient optical imaging quality. Second, achieving a high reflectivity for photon energies in the UV range requires not only a surface micro-roughness below nm [92] but also very sophisticated coating technology [93, 94, 95, 96].
4.3.1 Mirror distortions
Deviations of the mirror surface from an ideal spherical shape will result in a blurring of the point image produced by parallel radiated Cherenkov rays. The deformation of the mirror can be measured in terms of the slope error. It can be specified by a twofold of the angle between the actual slope of the mirror surface and the nominal value which corresponds statistically to a rms-width of distribution of the reflected light (see Fig. 4.8).
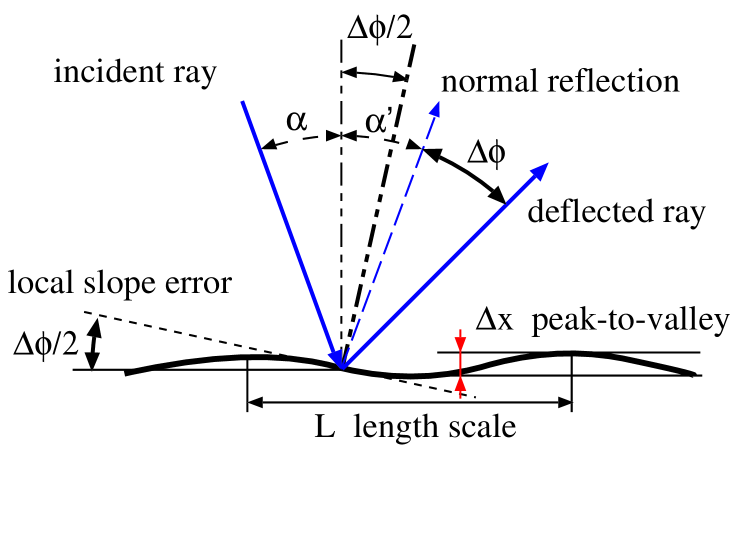
Definition of the slope error .
In a Monte Carlo simulation including real background events of the 1995 data set, the ring reconstruction efficiency (defined as the probability to reconstruct a ring for a given Monte Carlo track) and the ring-center resolution in RICH-2 were studied as a function of the slope error of the mirror. Local distortions smaller than the mirror area illuminated by a Cherenkov light cone were assumed to be randomly distributed. This is roughly equivalent to a random deviation of the reflected light from its nominal direction with a Gaussian probability distribution. Therefore, the hit position of each Cherenkov photon in the UV-detector is smeared by the convolutions of the probability distributions describing slope error, chromatic dispersion, electron drift, and finite pad resolution.
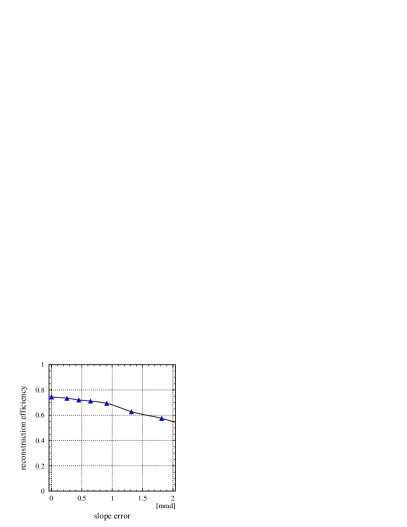
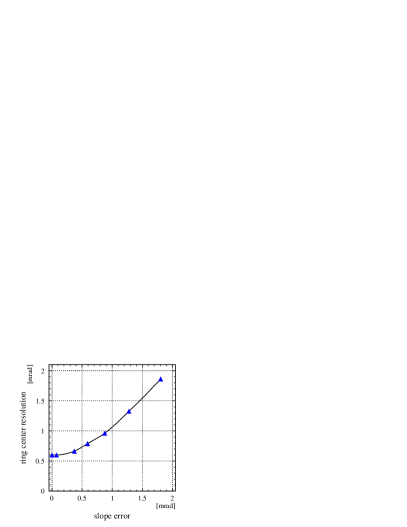
Figure 4.9 shows the decrease of the ring reconstruction efficiency with increasing slope error. This reflects the decrease of the number of true hits per ring due to the fixed size of the ring search mask in the reconstruction algorithm and the relative increase of misidentified hits on rings. This analysis allowed for setting of the limits of tolerance for slope errors at a maximum of about 0.7 mrad. It is worth stressing that improving the mirror quality beyond a slope error of mrad will not lead to a gain in reconstruction efficiency. Furthermore, it should to be noted that the ring-center resolution deteriorates quickly with increasing mirror deformation as seen in Fig. 4.9. It is clear that as soon as the errors induced by a certain slope error become larger than the contribution of the chromatic dispersion ( mrad) the ring-center resolution drops significantly. Optimizing the tracking strategy and fine tuning of the ring fitting algorithms could slightly improve the result. Combining both studies, an upper limit of mrad (rms) for the slope error was estimated. The present glass mirror, in comparison, has an overall slope error of mrad. Additionally, the actual focal length of the mirror must not deviate by more than from the nominal value of 4000 mm. The gap between adjacent mirror segments must not exceed mm which corresponds to an average loss of about 1.8% of the photons for 50% of all rings. A small gap would allow for an easy adjustment of the mounted mirror segments.
4.3.2 Reflectivity for UV photons
The only metal known to provide high reflectivity in the UV region is aluminum (Al). The optical properties of metals are characterized by the index of refraction n and the extinction coefficient k. The normal-incidence reflectance is given by:
| (4.17) |
which holds true for Cherenkov photons because of the large focal length of the mirror and the small Cherenkov angle. A maximum reflectance of can be achieved for aluminum at a wavelength of nm [93]. In case of the size of the surface roughness exceeding of the photon wavelength , the diffusely reflected component of the beam becomes large due to scattering from surface structures according to:
| (4.18) |
with being the width of the autocorrelation function of the surface profile. The latter describes the spatial correlation between the height of the surface at points and which can be approximated by a Gaussian distribution:
| (4.19) |
where and L denote the micro-roughness and the average correlation length, respectively. Thus for UV photons, a micro-roughness of less than nm is required, comparable to excellent polished float glass.
The most widely used technique for depositing Al coatings is evaporation in high vacuum [93]. All coatings for this study were performed at the CERN coating facility. Purest grade of Al(%) was evaporated from a tungsten coil. It is then deposited on the rotating substrate to ensure uniform thickness of the coating. In order to produce highly reflecting films, extreme care must be taken to ensure that the evaporated coatings are not contaminated by residual gases present during deposition. In principle, the metal should be deposited at the highest possible rate and not thicker than needed to be just opaquely reflecting. Otherwise, the surface roughness will increase. The optimal thickness for Al was found to be about 7 Å [97]. The small thickness of the film means a rather slow deposition rate and, therefore, an ultrahigh vacuum of mbar was of utmost importance. The thickness of the coating was controlled by measuring the oscillation frequency change of a crystal induced by the material deposited onto it.
A natural oxide film grows on the evaporated Al surface to an
ultimate Å in thickness as soon as it is exposed to air.
While this oxide layer prevents aluminum from tarnishing, it also
causes a drastic decrease in reflectance in the UV region.
Therefore, the Al film needs to be protected with a magnesium
fluoride (MgF2) overcoating preventing oxidation. The thickness
of the MgF2 film is chosen such that the reflectivity of the
combined layer is enhanced by destructive interference of the
light reflected on both boundaries of the film. A MgF2 layer of
Å in thickness was used for all coatings produced for
this study.
It is well known that evaporated MgF2 coatings absorb water when
exposed to air. This decreases the reflectance in the UV region
significantly. Therefore, once coated, a mirror must always be
kept free from moisture, preferably in a protective nitrogen
atmosphere. Additionally, outgassing or diffusion of a component
of the mirror substrate can deteriorate the coating. Previous
experience in the coating of the RICH-1 mirror showed that a
replicated gold surface needs to be covered by a blocking layer
such as SiO/Cr to prevent the gold atoms from diffusing into the
aluminum coating [94].
4.3.3 Other important aspects
The mirror is operated in a methane (CH4) environment at atmospheric pressure in a temperature range of 35 to 45 ∘C. All specifications must be fulfilled at least for this operating temperature interval. Furthermore, the mounted mirror should withstand any thermal stresses induced in a temperature interval of 10 to 45 ∘C due to shut down of the heating during the off-line period.
Any additional contamination of the radiator gas with ppm of water or oxygen will reduce the UV photon efficiency by about due to absorption. The present gas system can achieve an equilibrium concentration of O2 1 ppm and H2O 2 ppm. If a new mirror introduces a larger oxygen source an upgrade of the RICH-2 gas system would be required to maintain the present low level of oxygen contamination. Of further importance is the fact that cleaning of the CH4 radiator gas after opening the RICH-2 takes at least 3 to 6 weeks.
4.4 Manufacturing technologies
The manufacturing technology depends on the choice of the mirror substrate such as glass, metal, or composite materials. Traditionally, mirrors for optical applications such as the old RICH-2 mirror were made of glass for the following reasons: technological control over wide range of physical properties, excellent surface quality due to polishing, and very low production cost. For the purpose of reducing the thickness below of a radiation length, a float glass mirror must be thinner than mm according to Table 4.1. This, however, is not feasible because glass as a quasi-fluid rapidly loses its long term shape stability for large-size mirror panels with a thickness of less than mm.
In the scope of this study, three alternative approaches were considered. First, to construct a mirror from coated Mylar foil keeping a spherical shape by applying a pressure gradient between front and back side. A two Mylar foil mirror setup of a 100 m thickness for each would correspond to of a radiation length. This option was rejected because any spatial anisotropy in elasticity or substrate thickness will lead to large shape distortions. Second, a novel mirror substrate based on carbon ceramic was developed by DASA/IAGB [98] and the Technical University of Munich for the HADES RICH mirror [82]. The extremely high stiffness of the ceramic allows for minimum mirror thickness of about mm. This corresponds to of a radiation length for a substrate density of g/cm2. Additionally, a very high local surface quality and, hence, reflectivity can be achieved because substrate shells are individually polished to a micro-roughness of about nm. The major disadvantage of this type of substrate is the high risk of residual stresses in the material. At the time of this evaluation the mirror panels regularly broke during polishing or trimming indicating insufficient control of the manufacturing process. In combination with the prohibitive high cost of such a mirror, this led to discarding of the option.
Third, mirror substrates made of carbon-fiber-composite (CFK) materials were considered. These materials had been used for many high-tech applications in the past decade. Many times, it was successfully shown that large ultralightweight mirrors can be manufactured using CFK substrates with a replica technology for coating [91, 94, 99]. The main advantages of CFK materials are very low area density ( 1.7 g/cm2), high stiffness, and industrial mass production guaranteeing reasonable prices. The significant technological advances of recent years led to a considerable reduction of inherent disadvantages such as fiber printing, inhomogeneous module of thermal expansion, and moisture absorption. In view of these promising developments and the lack of alternatives, all subsequent studies were focused on CFK materials.
4.4.1 Carbon-fiber-composite mirrors
Carbon-fiber-composite mirrors consist of bundles of carbon fibers which are glued together with a special resin in a baking process. Three types of substrates can be distinguished depending on the arrangement of the carbon-fiber bundles: uni-directional materials with irregular orientation of chopped bundles, materials with long parallel aligned bundles, and woven fabricates consisting of interlaced texture of carbon-fiber bundles. Figure 4.10 illustrates the composition of a typical uni-directional material commonly used as mirror substrate.
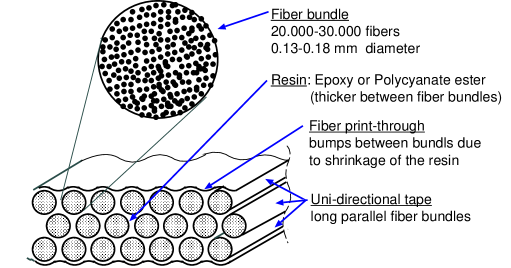
These days, the properties of carbon-fiber substrates can be controlled within a broad range to fit specific requirements. This can be done by choosing the proper fiber material and resin system and by adjusting the parameters in the curing process.
Most difficulties of CFK substrate arise from the spatial inhomogeneity of the material due to anisotropic fiber structure and the thermal inhomogeneity due to the difference of the coefficient of thermal expansion (CTE) between resin and carbon fibers. The lower CTE of the resin system creates valleys between adjacent carbon-fiber bundles when the substrate cools down after the high-temperature curing process as shown in Fig. 4.10.
This effect, known as fiber printing, can be reduced by applying an additional resin layer to the substrate surface in a replication process as illustrated in Fig. 4.11. This process can also be utilized to transfer a reflective metal coating such as aluminum and silver to a mirror surface.
This technology was successfully applied in the manufacturing of the CERES RICH-1 mirror by MAN Technologie AG [94, 101]. However, it cannot be utilized for UV coatings, as the protective MgF2 coating layer is very fragile and, therefore, cannot be transferred from master to substrate.
Another drawback of CFK materials is their spatial inhomogeneity. This can be controlled by combining several uni-directional carbon-fiber sheets with appropriate fiber orientations. Approximate spatial homogeneity to thermal, mechanical, or bending stresses can be achieved through arrangement of 2, 4, or 8 layers of CFK, respectively. Adherence to absorption of moisture causing the material to expand and to act as a source of water in a dry atmosphere such as the CH4 radiator gas is a further disadvantageous property of CFK materials [102].
4.4.2 Evaluation of CFK manufacturing concepts
A survey of CKF mirrors from all major vendors was carried out to assess the impact of recent improvements in manufacturing technologies on the inherent critical properties: surface micro-roughness, fiber print-through, and substrate stiffness. Mirror samples were obtained from the following companies: ARDCO [103], SESO [104], and Composite Optics Inc. (COI) [105]. MAN Technologie AG [101], that had previously built several 1-m-diameter CFK mirrors for CERES RICH-1, had no longer the facilities to do the gold coating of the replication master and could not offer any alternative solution. Before assessing technologies with respect to the specifications, experimental methods to measure the samples will be described.
UV reflectivity can be measured directly with a reflectometer or indirectly by determining the micro-roughness with a surface interferometer. The samples were evaluated in the CERN reflectometer depicted in Fig. 4.12.
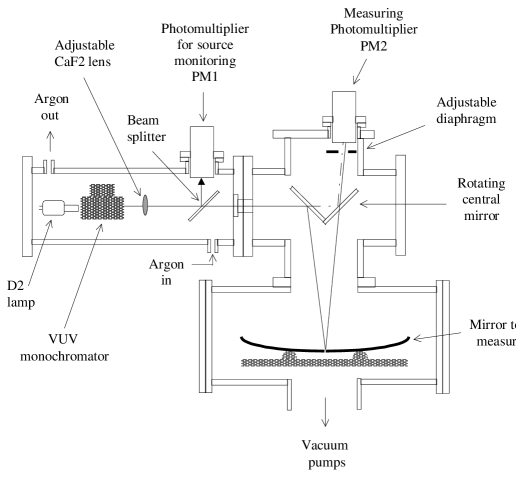
A grating selected a monochromatic light beam with a wavelength of 160 to 230 nm with a bandwidth of 2 nm from the continuum of a deuterium lamp. The intensity of the incident beam was measured with the photo multiplier PM1. After rotation of the central mirror the beam was sent to the center of the measured sample. The ratio of the intensity of reflected beam measured with photo multiplier PM2 to the intensity of the incident beam gave the reflectance of the sample. All measurements were performed in ultrahigh vacuum to avoid photon absorption.
To evaluate the CFK material specific fiber print-through a surface profile needs to be measured with a resolution of less than mm as determined by the diameter of the carbon-fiber bundles. Figure 4.13 shows the experimental setup used to scan flat reflective samples with a laser beam. The UV laser excels because of a small beam diameter of 300 m and a very high intensity that allows to measure the reflection from uncoated samples.
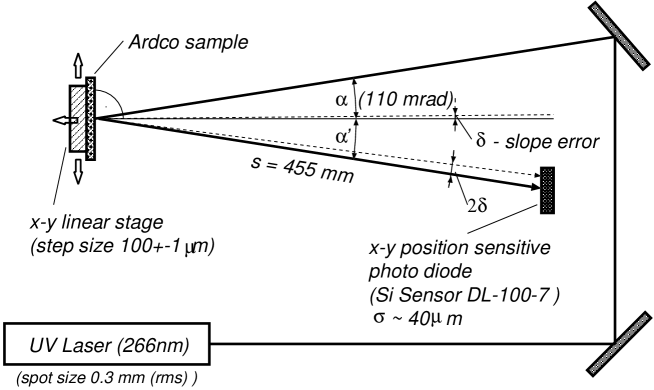
A surface profile was obtained by moving the sample on a linear stage relative to a fixed laser beam and recording the image of the reflected laser beam on a position sensitive diode. Any surface deformation with a length scale larger than the beam diameter results in a shift of the image position on the diode. The average slope error can be computed from the rms-width of the distribution of image positions:
| (4.20) |
where s denotes the distance between mirror and diode and is explained in Fig. 4.13. The orientation of the carbon-fiber bundles needs to be taken into account for highly anisotropic uni-directional CFK fabric.
The new substrate from ARDCO is a sandwich of CKF layers and ROHACELL foam. The ROHACELL foam stiffens the mirror considerably and increases the total thickness only by of a radiation length. The mirror samples manufactured by ARDCO [103] represented a novel sandwich design developed for the RICH mirrors of the PHENIX experiment [99]. Two uni-directional plane CFK shells of mm in thickness are stabilized and stiffened by a cm thick ROHACELL foam core. A detailed analysis of the sandwich design concept will be presented in Sec. 4.4.3.
The composite substrates were coated by OPTICON Inc. [100] with an Al/Au layer by a replication process (see Fig. 4.11). To achieve high UV reflectance, both samples were coated with a high quality Al and MgF2-protective film (by A. Braem, CERN). This required the development of a novel technology involving differential pumping on the sandwich structure to prevent outgassing and collapse of the ROHACELL foam in the ultrahigh vacuum during coating.
A summary of the measured reflectance before and after UV coating is shown in Fig. 4.14.
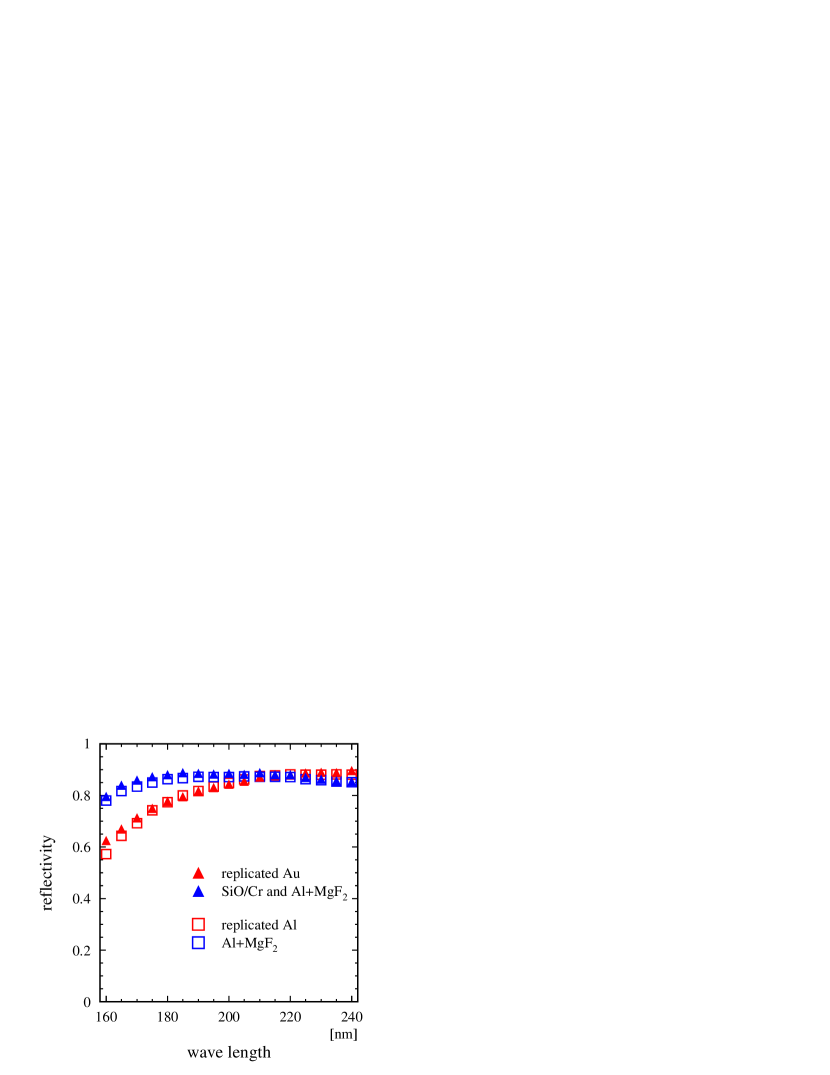
Reflectivity of the aluminum coating with MgF2 protective layer applied to a CFK mirror with aluminum or gold replicated coating.
A reflectance of 87% for a wavelength above nm is close to the expected value of 90% [93]. Furthermore, it is comparable to the float glass witness sample indicating that the release agent used by OPTICON during replication did not deteriorate the micro-roughness of the replicated Al or Au surface. The strong decrease of reflectance of the replicated samples without UV coating for a wavelength below nm, as apparent in Fig. 4.14, is caused by the natural oxide surface layer as explained in Sec. 4.3.2. Inasmuch as Au and Al coating exhibit a comparable reflectance, the replication of Al is easier because Au coating requires an additional SiO/Cr blocking film to avoid diffusion into the surface UV coating. It can be concluded that the UV reflectance of replicated CFK mirrors is not limited by the surface micro-roughness and is comparable to a glass mirror.
Figure 4.15 shows the local slope error along a mm surface profile measured using the experimental setup of Fig. 4.13.


The surface quality of the ARDCO/OPTICON sample is surprisingly poor. The print-through of individual fiber bundles was already evident from visual inspection. The deformations have a maximum amplitude of the order of mrad resulting in a slope error of approximately mrad. OPTICON claimed that the large fiber printing was solely due to the poor quality of the ARDCO CFK substrate. Rough surface structures result in an uneven gap width between substrate and replication master and hence in variations of the thickness of the epoxy resin layer. These variations induce mechanical stresses when the resin shrinks during the curing process.
The m diameter SESO mirror [104], originally manufactured for the HADES experiment [82], was made of woven CFK fabric which is very cheap but gives inferior stiffness. Its thickness of mm corresponds to of a radiation length. The surface profile shown in Fig. 4.17 is much smoother and exhibits a slope error of only 0.11 mrad (rms), one order of magnitude better than the ARDCO sample. Detailed study of the mirror shape by HADES [106] revealed a large astigmatism due to the lack of stiffness. According to SESO, only an increase of substrate thickness up to 4 mm would allow to achieve a sufficiently high stiffness.
The sample provided by COI consisted of a uni-directional pan fiber substrate (M55J/954-3 made by HEXCEL [107]) of mm in thickness. A novel polycyanate ester resin was used to glue the laminate layers for minimal difference in CTE between laminate and resin system. An Al surface coating was replicated onto the substrate by OPTICON using the replication technique described in Fig. 4.11. The measurement of the slope error along a surface profile is summarized in Fig. 4.17.


The slope error of mrad is remarkably small and comparable to that of the SESO sample.
In conclusion, an average slope error of less than mrad can be achieved by combining best available CFK substrates with novel efficient manufacturing approaches. This result invalidates the widespread opinion that CFK mirrors have poor quality due to fiber print-through.
COI Inc. was chosen for further mirror development based on the measurement and its excellent reputation as the largest manufacturer for advanced carbon-fiber substrates for all kinds of optical and spacecraft high-tech applications [91].
4.4.3 Mechanical stability of the mirror
Generally, very thin large-size CFK mirrors possess insufficient strength and stiffness to hold proper shape under their mass unless mounted or otherwise supported. Fixing the mirror at its outer perimeter to a mount, as done for the RICH-1 mirror, is clearly not possible due to the segmentation of the RICH-2 mirror.
There are two concepts for stabilizing a thin mirror shell. First, the sandwich design: the CFK face skin bonded to a lightweight core material such as ROHACELL foam and CFK back skin to counterbalance thermal stresses. Second, the isogrid design [108]: the thin mirror shell is supported with an isotropic core structure achieved by assembling strips of CFK flatstock in an egg-crate fashion forming equilateral triangle core cells (see Fig. 4.18).

The sandwich approach was first adapted to RICH mirrors by the PHENIX collaboration [99]. In Sec. 4.4.2, measurements of a test sample were described. The main advantages for RICH mirror application are: very low density foam allowing a high core thickness and resulting in an excellent mirror stiffness, low material and assembly cost, and technological feasibility for mounting at the back skin. An unsealed ROHACELL foam core, used for the PHENIX detector, was ruled out because ROHACELL has a strong affinity to take up moisture also causing the foam to expand. As a result, an additional sealing of the panel edges is necessary to prevent outgassing into the radiator. Replacing ROHACELL by a reticulated vitreous carbon core (RVC) with similar properties but less affinity to moisture would reduce the outgassing rate but sealing of the core would still be necessary.
The development of the isogrid design was driven by the need for more thermally stable satellite reflectors for use in telecommunication and in remote sensing of the atmosphere. From the fabrication point of view, isogrid mirrors provide higher bending stiffness and are less prone to thermal distortion because the entire structure is constructed from a single material. An exhaustive comparison of sandwich and isogrid design can be found in [108]. For the application to RICH mirrors the main advantage of this solution is that the CFK face skin can be as thin as mm assuming 12 layers of pan fiber tape or about in terms of a radiation length. Additionally, 1% to 5% of the electrons would traverse the material of the support structure made of ribs with cm height and mm thickness. This would correspond to a thickness of 0.6% to 3.8% of a radiation length depending on the incident angle of the electrons. From general considerations it becomes clear that this solution is favorable compared to an equivalent (thicker) homogeneous mirror because most electrons traverse the thinner face skin and remain within the narrow line width of the - or -meson whereas the electrons traversing the much thicker back structure are anyway ”lost” in the bremsstrahlung tail. The higher number of almost unaffected electrons improves the background discrimination considerably. In this design without a foam core, there is no need to worry about outgassing or special coating arrangements which leads to substantial time and cost savings. The critical issue of this design is the possible print-through of the support structure caused by the gluing of the back structure to the face sheet.
The apparent advantages of the isogrid design led to the decision to further pursue this novel solution to ultralightweight UV mirrors.
4.5 Prototype measurements
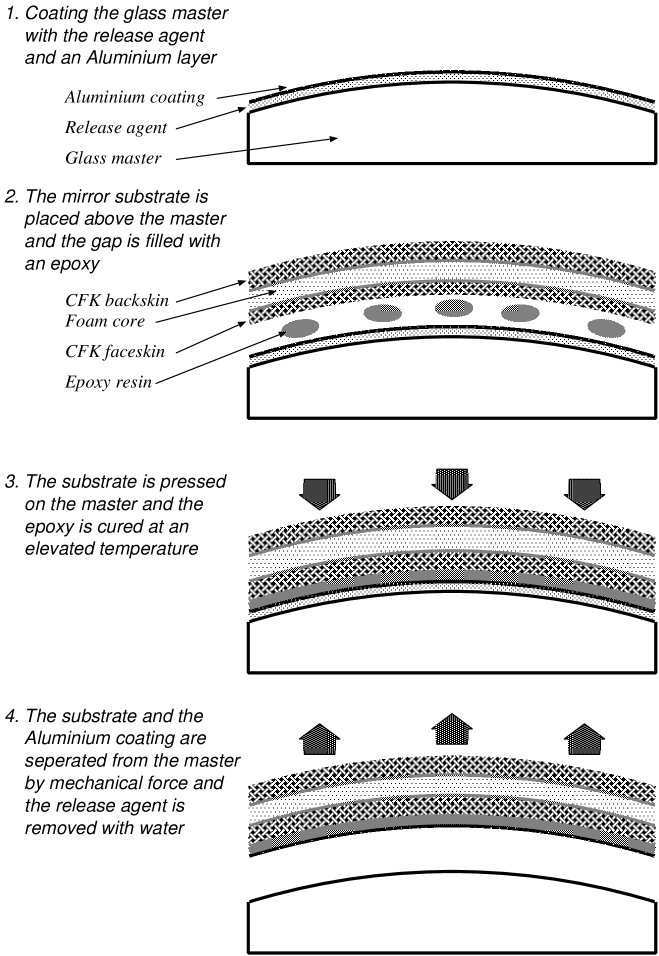
The first full size prototype was fabricated by COI and delivered in October 1999. The substrate consists of 12 layers of uni-directional pan fiber tape (M55J/954-3 by HEXCEL [107]) with a combined thickness of mm. The specific substrate was selected to provide a near zero CTE to insure dimensional stability over a wide temperature range and for its exceptionally high stiffness. The unitape layers are rotated consecutively by 30 degrees each to obtain best thermal isotropy. To bond the layers, a polycyanate ester based resin system was chosen to match the CTE of the substrate. The face skin restrained to a glass master was cured in an autoclave at a temperature of approximately 140 ∘C. In the same step, the mirror surface was replicated by use of a newly developed release agent of COI making any additional replication with a metal coating unnecessary. This improvement resulted in considerable time and cost savings. After curing, the rib structure was bonded to the back side of the face skin which was still restrained to the glass master. The isogrid structure of the second prototype including five additional vertical ribs is illustrated in Fig. 4.18. After the second curing at room temperature to bond the rib structure, the composite mirror is released from the glass master. From now on the back structure is responsible for preserving the shape of the mirror.
The reflectance of the replicated mirror surface was sufficiently high even without an additional metal coating to allow for laser measurement of the mirror. Figure 4.19 shows a schematic view of experimental setup used for mirror shape measurements.
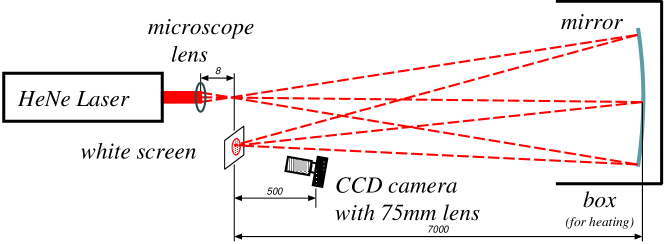
The mirror was illuminated by a point source of monochromatic light (632 nm HeNe laser beam focused by a microscope lens) placed at the center of the mirror sphere. The radius of curvature of the mirror panel was measured as mm.
A summary of the optical measurements is presented in Fig. 4.20.
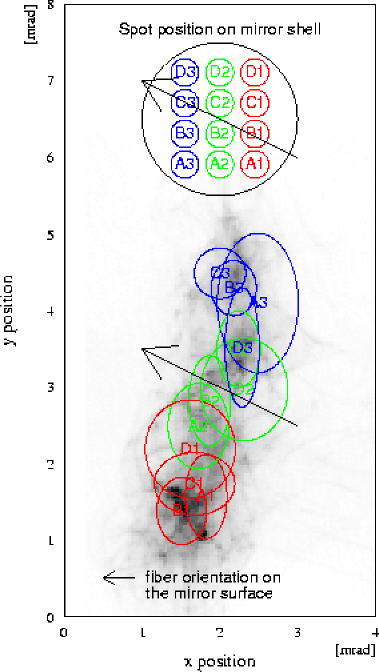
It shows the focal image of the point source when the whole panel is illuminated. The apparent structures indicate rather large surface distortions. The slope error is about 1.4 mrad (rms). This is equivalent to an image size of about 2.5 cm (diameter). Heating the mirror up to the operating temperature of C did not improve the slope error. A closer examination by illuminating individual surface regions of 10 cm diameter, the size of a Cherenkov light cone, reveals a large spatial variation of the focal point as evident by the position of the individual focal images. This astigmatism is produced by a larger radius of curvature along the fiber direction of the front CFK layers and can be directly attributed to the higher bending stiffness along the fiber direction.
The average slope error of the spots, shown as the diameter of the circles, varies between 0.40 mrad and 0.91 mrad (rms). It turned out that the surface area within each back structure triangle is especially distorted. Most likely it is due to stresses induced by the shrinking of the adhesive used to bond the isogrid. The direct print-through of the back structure was visible but fairly small compared to those other distortions. Although the optical quality for small areas was encouraging, deficits in manufacturing and design were apparent.
Based on this experience the following steps were taken to improve the local and the overall mirror shape while increasing the thickness by as little as possible.
-
•
50% increase of number of layers for front panel to gain more resistance against plucking stresses
-
•
100% increase of rib structure height to improve overall bending stiffness
-
•
addition of five perpendicular ribs to the isogrid as shown in Fig. 4.18 to enhance spatial isotropy
-
•
reduction of adhesive used for bonding to decrease plucking
The second prototype was delivered by COI in September 2000. Figure 4.22 shows the focal image of the full illuminated mirror using the setup shown in Fig. 4.19.
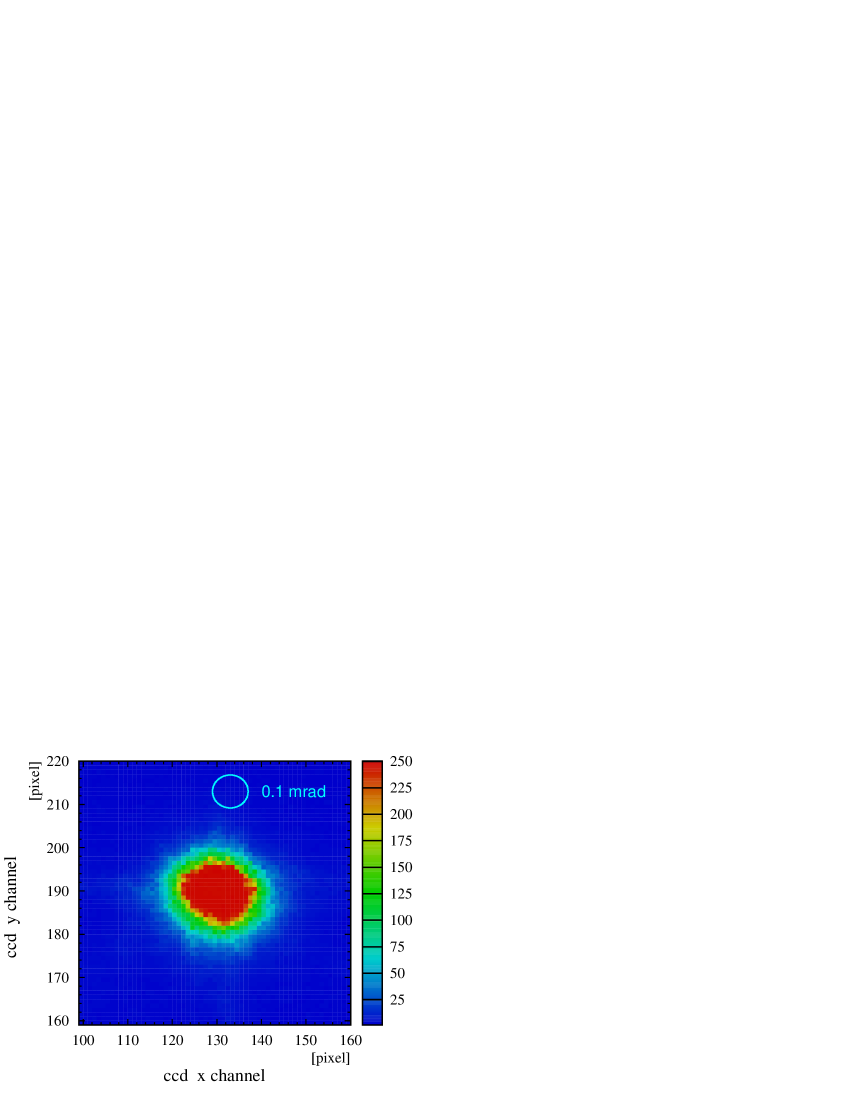


The most striking feature of Fig. 4.22 is the absence of substructures like the ones in Fig. 4.20. The overall slope error was determined to mrad by the width of the image projections shown in Fig. 4.22. It is worth stressing that design improvements resulted in tenfold increase of the mirror quality.
The spot size is already close to the limit of the setup defined by the divergence of the laser beam and the resolution of the CCD camera. The remaining surface distortions can only be seen in the Foucault image of the mirror surface shown in Fig. 4.23. The image was captured on a white screen placed at a distance of about 5 m from the mirror.
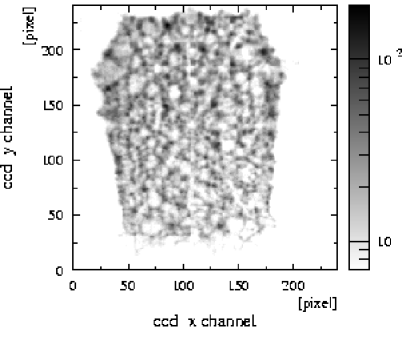
The brighter diagonal lines indicate a remaining print-through of the long continuous isogrid rib possessing the same magnitude as the local plucking distortions.
To evaluate the local surface errors quantitatively, the mirror was measured with phase shifting interferometry by COI using a CO2 laser with a wavelength of 10.6 m. The phase shift was observed with respect to the position of a reference mirror. Figure 4.25 shows the interference pattern for 15 horizontal and for 15 vertical fringes.
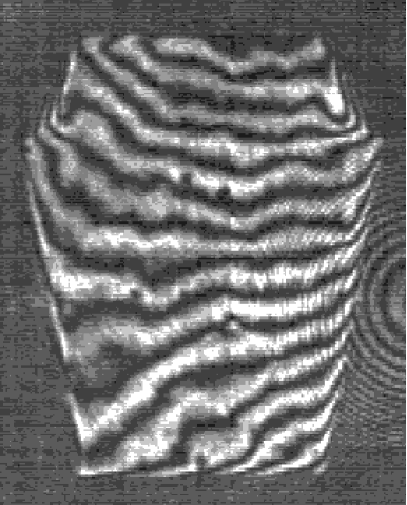
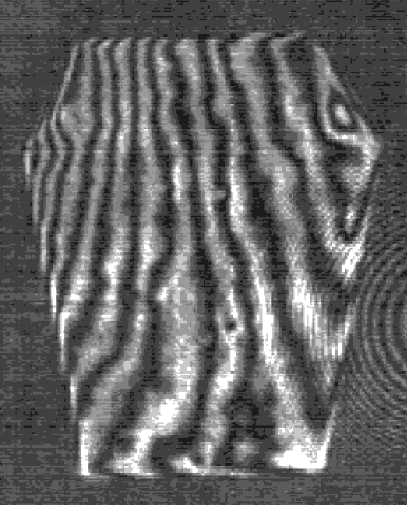
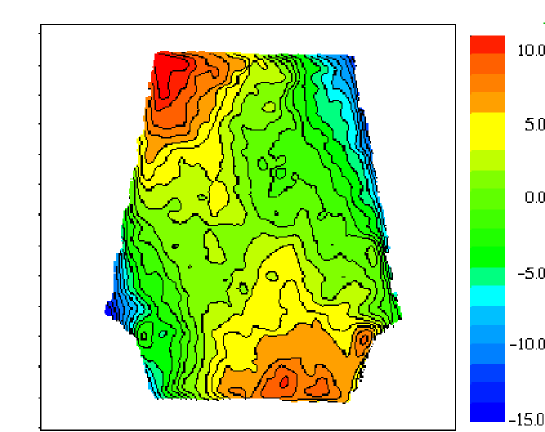
The mirror surface structure shown in Fig. 4.25 was reconstructed by deconvolution of both interference signals.
A surface irregularity of 4.2 m (rms) was measured which is equivalent to a peak-to-valley deviation of 25.8 m. Besides, a small edge cusping at the corners was evident resulting in first-order astigmatism of 4 m peak deviation for an average angular profile. It is worth stressing that the central 160-mm-radius zone exhibits a very flat average radial profile with less than 1 m peak deviation.
4.6 Summary and outlook
By use of the Monte Carlo detector simulation based on a realistic hadronic cocktail it was demonstrated that the meson spectroscopy capabilities of the CERES detector system would greatly benefit from a new ultrathin RICH-2 mirror replacing the original thick glass mirror. The properties and technical requirement of a such a mirror were specified.
A survey of available mirror substrates led to the conclusion that only mirrors made of carbon fibers could fulfill these expectations. The evaluation of CFK mirror samples from different vendors proved that high UV reflectivity and excellent imaging quality, as such the most critical requirements, can be achieved by the appropriate choice of carbon-fiber substrate and mirror fabrication technology.
A novel approach to the stabilization of ultrathin CFK mirror shells by an isogrid support structure was developed. It is especially suitable for meson spectroscopy because the relative fraction of dielectron pairs remaining in the resonance peak compared to those shifted in mass due to bremsstrahlung is enhanced and, thereby, the meson signal-to-background ratio is improved.
The first prototype incorporating the new isogrid design was manufactured by Composite Optics Inc. in October 1999. Optical measurements revealed large local deformations and a significant astigmatism indicating insufficient substrate thickness and support structure stiffness. Based on these findings and bound to a tight schedule, the CERES collaboration decided that the considerable risks involved in the implementation of the mirror for run time in 2000 could not be justified by the expected benefits. Furthermore, the ongoing study of mirror technologies was to be finalized.
Several measures were taken in the fabrication of the second prototype to optimize the mirror design. As a result, the overall slope error of the mirror was reduced to mrad, i.e. ten times. The residual astigmatism of m is negligibly small. Such an excellent optical quality has never been achieved for an ultrathin carbon-fiber mirror. The novel replication technique and the simplicity of the isogrid design result in low manufacturing cost. Thus, significant cost savings of more than 50% could be gained in comparison to the HADES RICH mirror which is fabricated on the basis of carbon ceramic substrate technology [106].
The second prototype arrived only shortly before the main production run in Fall 2000 ruling out the implementation of a new full-size mirror in the CERES RICH-2 detector. Nevertheless, the development of an ultrathin carbon-fiber mirror in only three years is an accomplishment considering that comparable projects took more than 5 years until completion [95]. Future applications are to be expected driven by the recent renaissance of RICH detectors in heavy ion physics and particle physics [95, 99, 110, 111]. A summary of the mirror development is in preparation for publication [112].
Chapter 5 Analysis of Pb-Au collision data at 158 GeV/c per nucleon
5.1 Introduction
Any experiment attempting to measure low-mass dielectrons in ultrarelativistic heavy ion collisions has to deal with major experimental challenges. First, the large number of produced particles leads to a high detector occupancy resulting in a serious load on the detectors. Distinction of electrons from the 2 to 3 orders of magnitude more abundant hadrons requires a detector system with superior particle identification capabilities. Only a small fraction of all electrons come from nontrivial sources other than -conversion and Dalitz decay . Finally, uncorrelated electrons and positrons originating from a large fraction of partially reconstructed pairs form a huge combinatorial background when combined to pairs.
Although the CERES experiment has been designed to detect electrons under such conditions, a sophisticated data analysis is a necessity in order to extract a statistically significant dielectron signal.
The data analysis consists of the following steps:
-
•
calibration of detector raw data
-
•
reconstruction of hits in each detector
-
•
combination of hits of all detectors to particle tracks including particle identification and momentum determination
-
•
rejection of accidentally matching track segments and reduction of combinatorial background
-
•
single-track efficiency correction by means of Monte Carlo detector simulation
-
•
subtraction of the combinatorial background from the pair distribution
This Chapter is focused on the results of new studies and developments. The key points of the chain of analysis will be explained and details will be given where necessary for general understanding. A thorough description of the previously used detector calibration and hit reconstruction algorithms can be found in [63, 66, 71, 113]. New detector calibrations developed in this paper are included at pertinent places.
5.2 Reasons for re-analysis of the 1996 data set
The 1996 data set has been analyzed twice before [80, 113]. The third analysis was motivated by the following reasons.
First, in previous analyses the signal of correlated electron-positron pairs was extracted by subtracting the mass distribution of like-sign pairs from the unlike-sign spectrum. This procedure assumes the combinatorial unlike-sign background to exactly resemble the like-sign spectrum. Improper subtraction of combinatorial background as a cause of the dielectron enhancement observed was a serious concern, since the signal-to-background ratio is very small (i.e. 1 : 13 [113]). Furthermore, signal and background distribution are similar in shape. The enhancement observed could be explained by a 3.6% increase of the background as noted in [113]. Such a situation could occur in case of an unrecognized asymmetry of the detector with regard to detection and reconstruction of unlike-sign and like-sign pairs.
Second, a smoothing procedure was applied to the like-sign combinatorial background to reduce statistical error. In fact, the statistical errors of the individual mass bins were shifted to a systematic error of the integral distribution. A certain level of subjectiveness resulting from the particular choice of the fit function (see Fig. 5.12 in [71]) increased the difficulties in understanding the systematic error of the background subtraction.
In this paper, these particular questions will be addressed in the discussion of the application of the mixed-event technique, an alternative method for the construction and subsequent subtraction of the combinatorial background. The comparison of the two background subtraction techniques will allow a test and validation of the assumptions inherent in both methods.
The first attempt to construct a mixed-event combinatorial background was based on the results of the previous first-stage analysis [113]. Figure 5.1 shows the mixed-event distribution to deviate strongly from the same-event like-sign background.
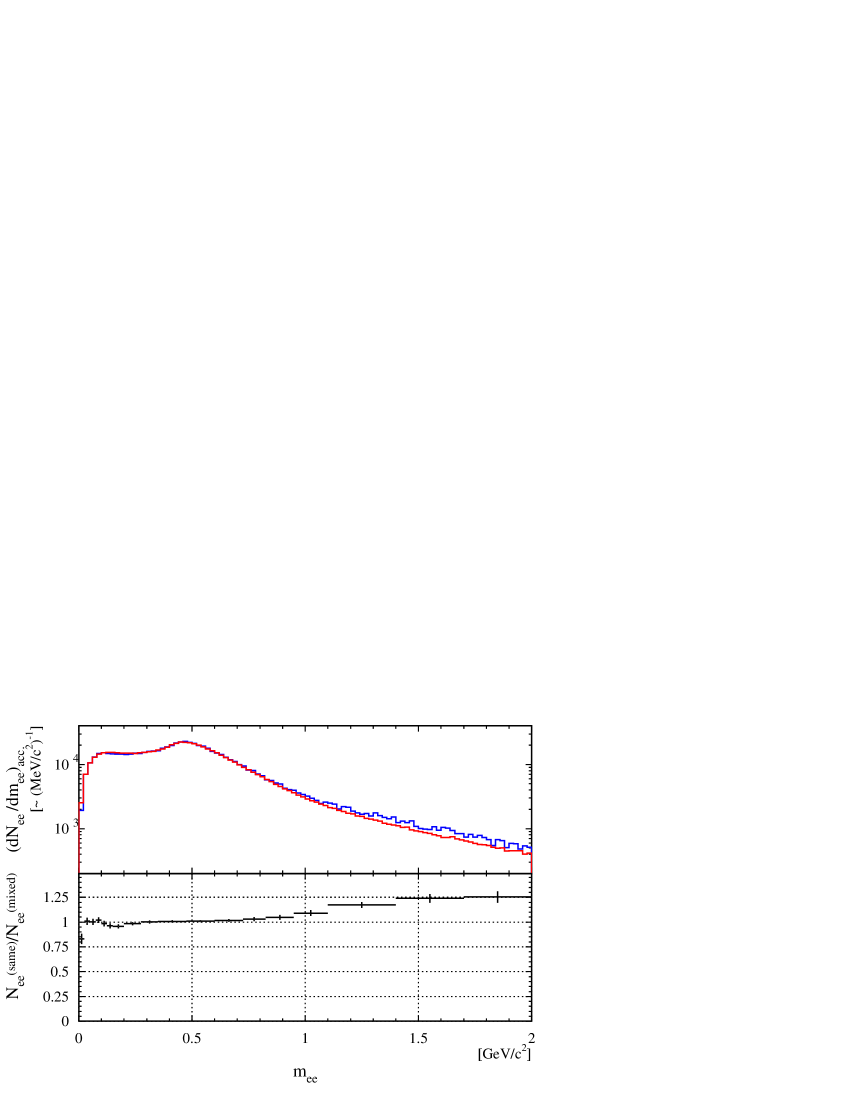
In absence of other plausible explanations, a new first-stage analysis had to be performed to exclude any artifacts of the hit and track reconstruction or of the event selection applied for data reduction.
Several minor problems of previous analyses were addressed in the process of the data re-analysis with the mixed-event technique. Most notably, a very complex background rejection strategy had been used in [71, 113] which was not easy to reproduce. The main focus of this paper was placed on the essentials and clarity with special emphasis on the rejection strategy.
5.3 Hit and track reconstruction
5.3.1 Technical aspects of the raw data analysis
The first of two steps of analysis, hit and track reconstruction, requires processing GB of raw data, collected in the recording of events. It was carried out at the CERN EFF PC-farm using 40 CPUs for two weeks. The general results are summarized in Table 5.1.
| Analysis stage | Number of events |
|---|---|
| Recorded on tape | 60.000.000 |
| Available events | 41.694.200 |
| Successfully analyzed | 40.418.548 |
| Events with -track | 34.523.208 |
| Events with e-track | 25.170.135 |
| Events with dielectron | 2.380.071 |
Recent progress in data storage technology and the increase of available computing power allowed to loosen the event selection and to store all events with at least one electron or high-momentum pion track. Each event was characterized by the centrality and by the orientation of the reaction plane used only in the hadronic flow analysis by [114].
5.3.2 SDD-hit reconstruction
The major change at the first stage of the analysis was the implementation of a novel algorithm to reconstruct hits in the SDD developed by [114]. Before evaluating the impact of new software on the dielectron analysis, the general concept of SDD-hit reconstruction is explained with special emphasis on the differences between the old and the new software version.
SDDs play a crucial role in the reconstruction of event vertex and tracks and in the rejection of pairs of close tracks by either resolving those or using the deposited-energy information for discrimination. The SDD-hit reconstruction software is used to determine the hit position taking into account effects such as the noise of the electronics, pulse shape variations, and the saturation of the pulse height. Overlapping hits are resolved as far as possible.
The strategy previously applied was based on the clustering of pulses of adjacent anodes to hits and determining the hit position by a center of gravity method [73]. Overlapping hits were split only in anode direction in case of a local minimum between adjacent pulses in a hit cluster. As noted in [71], this method produces a large fraction of artificially split single hits deteriorating the single-track resolution and the close-track rejection power. The new method was developed to improve this situation [114]. It employs a Gaussian pulse fit to find the hit center as well as a special logic to recognize overlapping hits based on a double-Gaussian fit of the pulse shape in time-bin direction and a simple local minimum splitting in anode direction.
A Monte Carlo simulation of the double-hit reconstruction efficiency by [114] is plotted in Fig. 5.3.
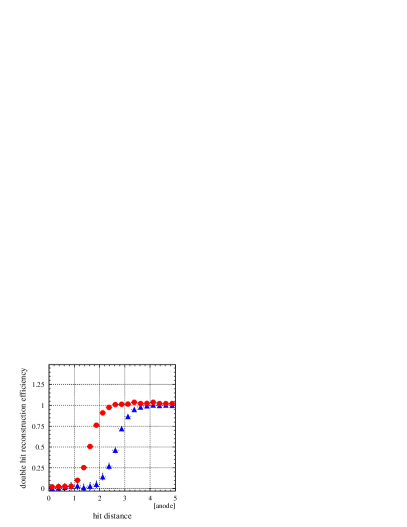
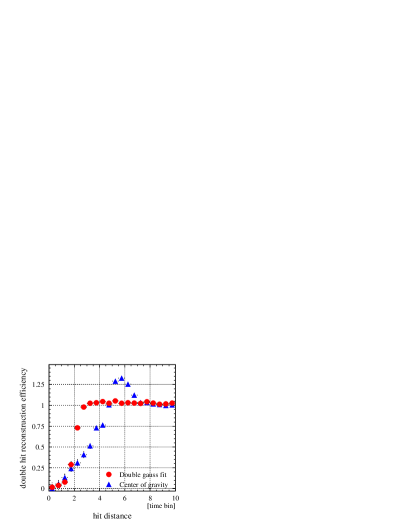
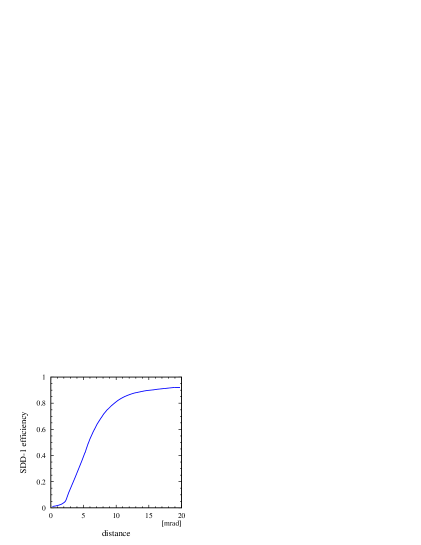
With the old software a large excess of reconstructed pairs appears in time-bin direction, an indication of artificial splitting of single hits. This peak has disappeared after introduction of the new hit reconstruction software.
The double-hit resolution, defined as the distance of reconstruction of both hits with 50% probability, is improved by 60% for anode and time-bin direction. The latter is verified in this paper by an evaluation of the measured distribution of hits in the vicinity of a reconstructed track which gives a double-hit resolution of 5.6 mrad (see Fig. 5.3).
The Monte Carlo simulation of the double-hit reconstruction efficiency does not address the problem of artificially split single hits because a split single hit could be mistaken for a properly reconstructed double hit. A new approach based on experimental data was taken in this paper to resolve this issue.
Without artificially split hits, the SDD-hit density must be uniform close to a hit belonging to an electron track. Only information about the next closest hit was stored in the first stage of analysis. The density distribution of the next closest hit rapidly decreases with increasing distance to a given track. It can be approximated by a Gaussian probability distribution. One part of a hit artificially split belongs to a track while the other results in an enhanced density of next closest hits. The finite double-hit resolution causes a depletion in the vicinity of a hit. The observed density distribution of next closest hits is plotted in Fig. 5.4.
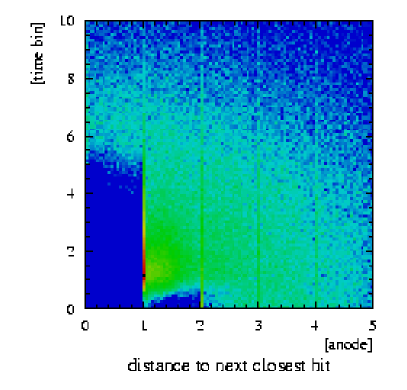
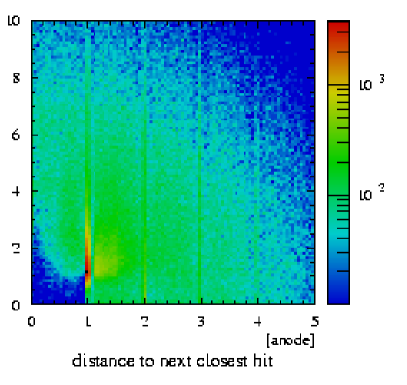
The old software (left panel) shows a huge excess due to artificial splitting at a hit distance range of 1 to 2 anodes and 1 to 3 time bins. Overlapping hits in time-bin direction were not split which leads to a depleted hit density up to a distance of 5 time bins. In contrast, the new software shows this area filled resulting from the additional splitting in time-bin direction. However, a significant peak indicating artificially split single hits is still present.
The fraction of artificially split hits was estimated for a quantitative study by the integrated yield of the observed excess relative to the number of regular background hits. Contrasting both software versions in Fig. 5.5 (left panel) shows the total fraction of artificially split hits to be reduced from 25% (old version) to 19% (SDD-1) and 16% (SDD-2) (new version).
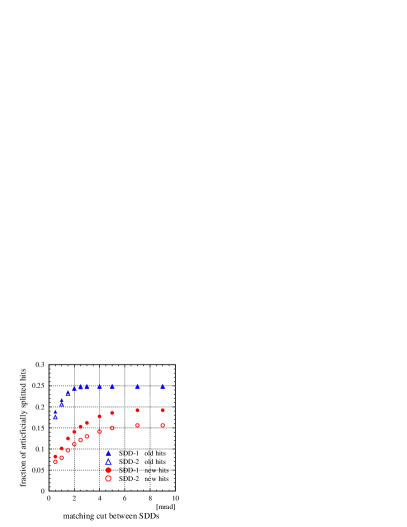
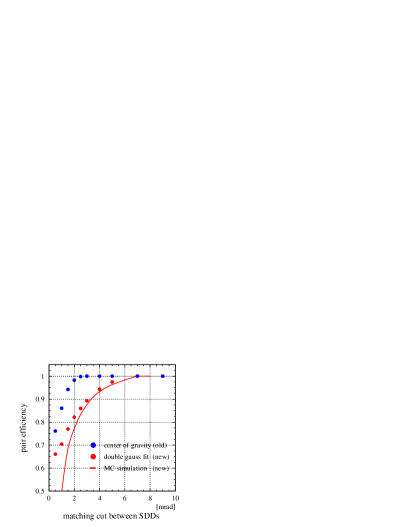
The artificial hit splitting in both SDDs occurs independently. In particular, it is independent of the quality cut applied to the matching of SDD-1 and SDD-2 hits unless the position of artificially split hits is shifted. Figure 5.5 (left panel) reveals the relative fraction of split hits in the new version to decreases rapidly with increasing matching quality exactly as one would expect if an increasing fraction of artificially split hits were rejected due to poor matching. This feature results in an additional pair efficiency loss as illustrated in Fig. 5.5 (right panel). Although the new software reduces the fraction of split hits considerably, those that are still artificially split exhibit a larger position shift (i.e. comprise smaller hit fractions and/or more single-anode hits) which in turn results in a 8%/16% track/pair reconstruction efficiency loss compared to the old software.
The study of this effect is not yet completed to date but is considering the following possible explanations: the Gaussian double-hit fit is more sensitive to distorted pulse shapes compared to the center of gravity method and the parameters controlling the double-hit splitting in anode direction need to be re-adjusted to accommodate small variation in the drift-time calibration or the pulse shape between adjacent anodes.
5.3.3 Outline of the tracking strategy
After completion of the reconstruction of hits from the detector signals, the spatial hit positions are utilized to construct particle tracks. The tracking strategy applied in this analysis closely follows the approach taken in [113]. It encompasses the following successive steps:
-
•
matching of SDD-1 and SDD-2 hits
-
•
vertex determination as interception of all SDD track segments
-
•
reconstruction of RICH-1 Cherenkov rings utilizing SDD track segments as pointer to select proper ring candidates
-
•
combination of fitted RICH-1 rings and RICH-2 rings/PD hits to RICH-PD track segments taking into account the inhomogeneous B-field
-
•
final matching of SDD and RICH-PD track segments to complete particle tracks
The particular purpose of this strategy is to aid the ring recognition algorithm in both RICH detectors by external tracking information of SDDs and PD. All tracking steps were put under strict scrutiny in search for artifacts that could lead to a biased track reconstruction. The resulting improvements and other important modifications are documented below. The matching of the detectors measuring angles (RICH-1/2) and those measuring spatial coordinates (SDD, PD) has been changed everywhere. It is now based on solid angles rather than polar and azimuthal angles not reflecting spherical symmetry.
5.3.4 Reconstruction of SDD track segments
The most likely position of the event vertex is determined by an optimization procedure (Robust Vertex Fit [115]). The vertex is defined as the spatial point where the weighted sum of its squared distance to all trajectories of matching SDD-1 and SDD-2 hits is minimal. Next, SDD track segments are created. A simple predictor pointing to SDD-1 is calculated for each hit in SDD-2 (see Fig. 5.6).
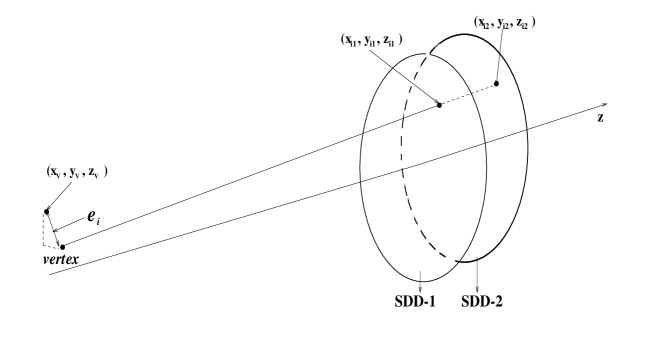
Previously, a tilt of both SDDs [66] with respect to the beam axis was neglected in the predictor determination. To include this effect, an improved predictor method was developed using analytic geometry. Next, a binary-search algorithm is applied to find the SDD-1 hit closest to the SDD-2-vertex predictor. This algorithm was modified because it was failing in certain rare cases. The size of the search window of the best-matching hit was adjusted to always cover the maximum matching window of mrad.
To avoid ambiguous rejection of track segments within the limit of the detector resolution, tracks sharing a common hit in SDD-2 (so-called reversed VSDD-tracks) were allowed in addition to track segments sharing a common hit in SDD-1 (VSDD-tracks).
These changes also apply to the second stage of SDD-vertex tracking where the z-position of the reconstructed vertex is refined to the exact position of the target disk. An optimized x-y vertex position is obtained by minimizing the sum residual distance of the initially found SDD-vertex tracks pointing to the target. After refinement of the vertex position, an optimized set of SDD-vertex track segments is obtained following the steps described above. This procedure improves the SDD-vertex pointing resolution by . Further optimization of the code implementation results in a reduction of the overall execution time.
5.3.5 Reconstruction of RICH-PD track segments
Particle tracking is closely interlocked with electron identification and momentum determination as described in Sec. 3.5 because of the particular setup of the CERES detector. Electron track reconstruction in the RICH-PD detector system therefore has to meet all of the following principal objectives: highest possible tracking efficiency, sufficiently good pointing accuracy for minimal probability of accidental matches with fake rings, and precise momentum determination. Independent fulfillment of these requirements is restricted by: the momentum dependent multiple scattering (see Eq. 4.1), the -deflection caused by the second-order-field effect (see Fig. 3.5 in Sec. 3.5), and small deviations of the magnetic field from the nominal B(r) 1/r dependence.
Best reconstruction efficiency for low-momentum tracks is vital to reduce the combinatorial background. Higher-order effects are important and are to be treated carefully especially for these tracks. The previous tracking strategy of [63, 66, 71, 113] was replaced by a new tracking strategy based on a detailed simulation of the CERES detector including all higher-order effects. It grounds in several basic ideas as follow. First, all previously fitted RICH-1 rings and all RICH-2-ring candidates are combined provided they fall within a butterfly-shaped matching window described by:
| (5.1) |
accounting for multiple scattering and detector resolution. Moreover, -deflection in the magnetic field has to be less than rad (corresponding to MeV/c).
The expected -deflection in RICH-2, caused by the second-order-field effect, is calculated for each combination of rings as a function of the -deflection and the radial position of the track. The latter dependencies reflect the residual non-linear contribution of the magnetic field. The radial shift of the vertex with respect to the radial symmetry of the magnetic field is also included.
After this correction, the remaining difference in -direction between RICH-1 and RICH-2 is attributed to multiple scattering and detector resolution. A follow-your-nose approach was applied to achieve maximum tracking efficiency. With multiple scattering occurring mainly in the RICH-1 mirror, a correlated shift in all downstream detectors, namely PD and RICH-2, must follow. Multiple scattering in azimuthal direction however cannot be distinguished from the -deflection by the magnetic field and is directly contributing to the momentum resolution. Next, a predictor is computed into the PD. It includes multiple scattering in -direction and the second-order-field effect. The predictor function relating RICH-2 and PD coordinates is depicted in Fig. 5.7.
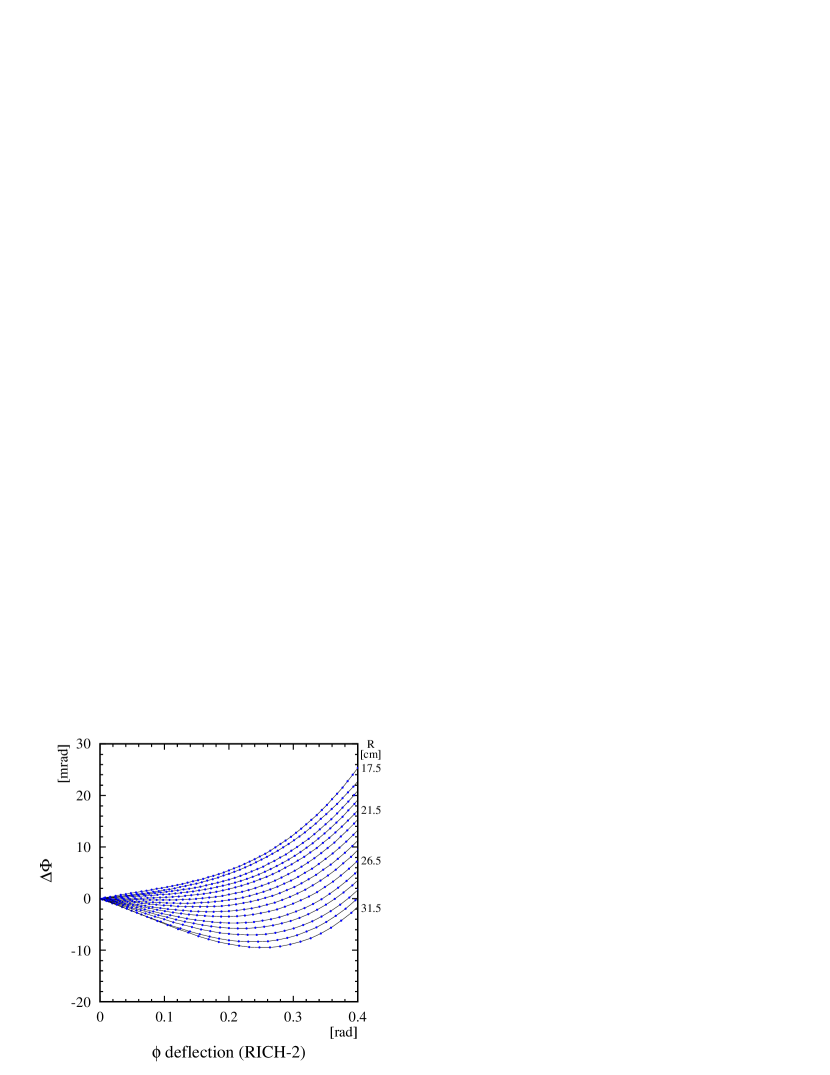
GEANT simulation of the difference between the -measurement in PD and RICH-2 depending on the radial track positions . The average deflection measured in the PD was subtracted: . The functional dependence was fitted by a fourth-order polynomial to obtain the new PD--predictor function.
It was obtained by tracking particles through the CERES detector setup using the GEANT simulation package [88]. The expected ring center position in the RICH-2 detector was determined from the average orientation of the particles momentum vector while traversing the RICH-2 radiator volume rather than from the center of the fitted RICH-2 ring. The latter method becomes inaccurate for low momentum tracks because the ring shape observed is distorted by the second-order-field effect.
Figure 5.8 illustrates the accuracy of the new PD phi-predictor compared to the previously employed version.
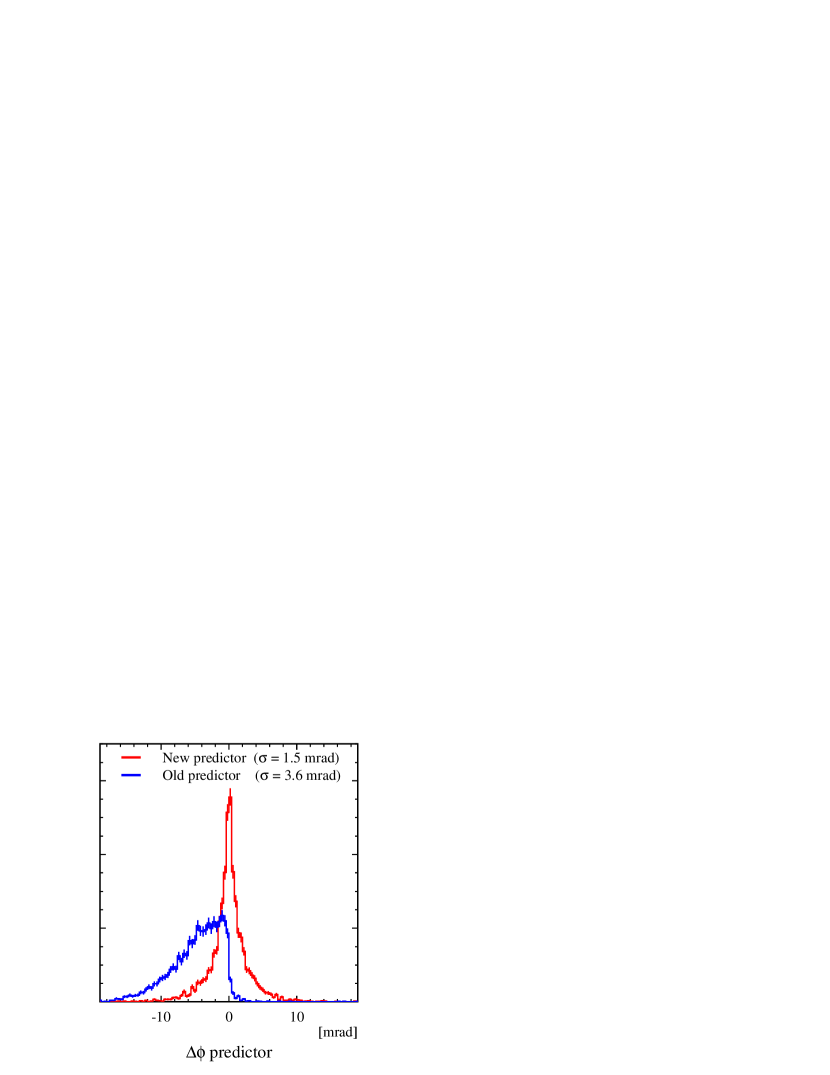
Deviation of new and old predicted -position from the true hit position simulated in GEANT including multiple scattering. The distribution of the old version is not only much broader but also exhibits a general offset of about mrad with respect to the true hit position.
The distribution of the old version is not only much broader but also exhibits a general offset of about mrad with respect to the true hit position. The matching of PD hits and RICH-1/2 segments was little affected because the -offset was partly counterbalanced by a 3 cm misalignment of the PD z-position.
In the next tracking step, all RICH-2 ring candidates are fitted, provided a PD hit was found close to its predictor. All complete RICH-PD track segment are stored for subsequent matching to the previously constructed SDD-vertex track segments.
The maximum search window for the closest PD hit was modified to a fixed solid angle (as opposed to the formerly fixed rectangular matching window in x-y pad coordinates which does not reflect the appropriate symmetry of the detector).
Sometimes more than one track segment shares either the same RICH-1 or RICH-2 ring. The first case represents unresolved dielectrons (called V-tracks) with a small opening angle for that the segments have opposite charge. They are kept for further studies. In previous analyses, all other multiple matches were rejected by choosing the track with the best -match between RICH-1 and RICH-2 detector. This procedure favors reconstruction of high-momentum tracks which are less affected by multiple scattering. The charge determination is refined at a later stage of the analysis, based on the more precise measurement of the deflection between SDD and PD instead of the initial combination of RICH-1 and RICH-2 detector. The pair-charge dependence of this rejection introduces a subtle bias for high-momentum tracks.
With the new tracking, all multiple matches were kept for later evaluation based on an improved deflection determination and a further rejection of fake rings by additional quality cuts. The surviving V-tracks of the same charge were used to evaluate the fraction of accidental matches of unlike-sign V-tracks. The few multiple matches that remained unresolved after the quality cut were finally rejected to avoid a tedious selection procedure.
By means of GEANT detector simulation, the relation between the momentum of the electron and its azimuthal deflection in the magnetic field was determined including higher-order corrections. Figure 5.9 shows the momentum resolution contrasting new and old version of the momentum fit. The relative error of the new method of is small compared to the observed resolution (see Sec. 5.4.3). The momentum offset for the old version is caused by a previously unnoticed misalignment of the PD z-position. This shift was independently confirmed by a measurement of reconstructed D-meson mass [116].
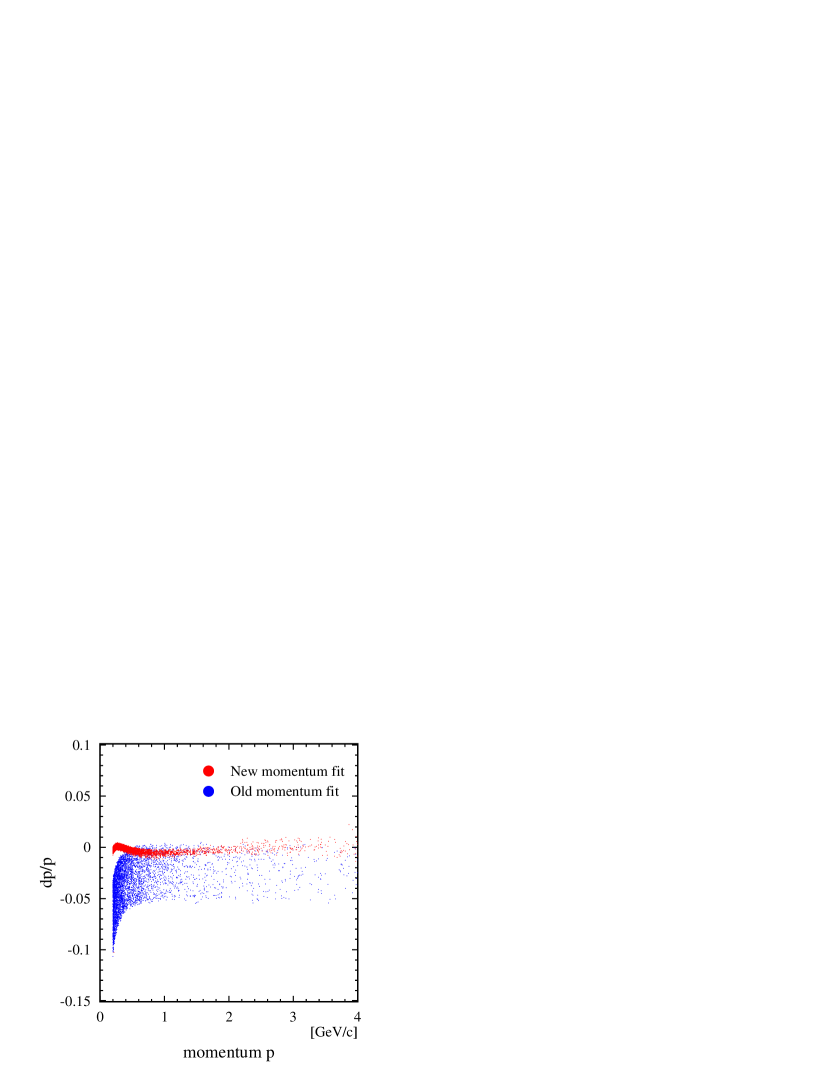
GEANT simulation of the relative error of the momentum determination excluding multiple scattering. The momentum reconstructed with the old software exhibits an overall 2.5% offset which increases for small momenta.
Which of the software modifications finally led to the convergence of same-event and mixed-event background (see Sec. 5.6.4) could not be verified because the necessary repetitions of first-stage analysis were prohibited by their excessive need of computing power, storage space, and time.
5.4 Global calibration of the spectrometer
5.4.1 Intercalibration of detectors
High-precision alignment of all detectors is of crucial importance for efficient tracking and subsequent rejection of accidental matches. The external distance measurements of individual detector with respect to a fixed laboratory frame, made during assembly, do not have sufficient precision. But they provide initial values and constraints for an intercalibration with a data sample of reconstructed high-momentum pions. Compared to electrons, high-momentum pions ( GeV/c) are no much affected by multiple scattering and, therefore, more suitable for precise detector alignment. Starting with the autocalibration of the SDDs and the reconstruction of the event vertex, described in Sec. 5.3.4, all identified pion tracks are matched to the independent reference of PD hits and RICH rings. Each detector was aligned in x-y coordinates with respect to the center of SDD-1 which was used as reference point. Any residual offsets in -direction can be removed by applying a radial correction to the local drift velocity of the SDDs.
Using this calibration strategy, a high-precision alignment of the ’96 detector setup was carried out prior to this paper. Details of the calibration are documented in [63, 66]. The attempt to reuse the calibration parameters for this analysis failed, as they were unable to reconstruct the vertex at the nominal target positions. An investigation revealed the positions of the SDD hits, obtained with the new fitting algorithm, to have been subject to a systematic shift due to the non-Gaussian pulse shape. The intercalibration of SDD-detector system had to be redone. A simple study of the calibration parameters was carried out to avoid an elaborate recalibration of the Silicon-vertex telescope. The correct spacing of the target disks was regained by decreasing the outer-radius parameter of SDD-1 by 24 m resulting in a systematic expansion of the radial scale. The residual time-dependent offset between the nominal target and the reconstructed vertex position was used to compute a small correction factor for the local drift velocity in both SDD detectors for each run. After this correction, the reconstructed vertex distributions were centered at the nominal position of the target disks as shown in Fig. 5.10 (left panel).
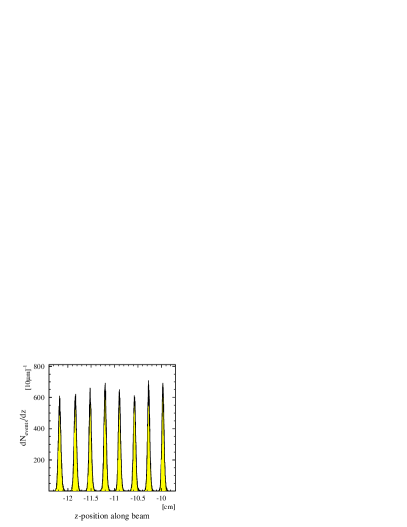

The individual vertex distributions are clearly separated. This allows for unequivocal identification of the target disk in which the interaction took place. The SDD-track reconstruction can be refined with the knowledge of the exact vertex z-position.
The higher double-track resolution of the new SDD-hit reconstruction software (see Fig. 5.3) improved the resolution of the vertex z-position by 20 m to 260 m (compare [66]). For geometry reasons explained in [117] the vertex z-resolution is about 15% better at the far side of the SDD as seen in Fig. 5.10 (right panel).
The vertex z-resolution could be further improved by in case of best calibration of the SDD-vertex telescope [117]. Figure 5.11 shows the time variation of the mean and the width of the reconstructed-vertex distribution for each target disk. The residual offset of about m leads to a very small systematic shift of the radial(-) matching of mrad which is negligible compared to the resolution of the SDDs.
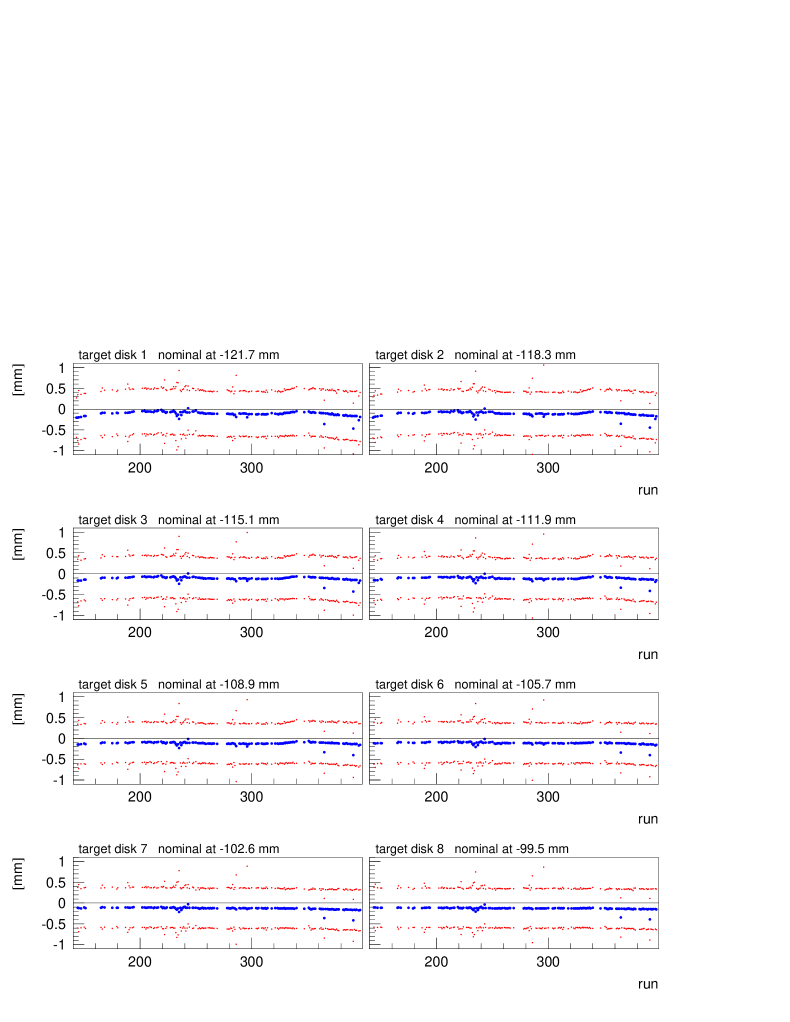
5.4.2 Matching distributions
Internal consistency and quality of the readjusted calibration can be evaluated by looking at the residual offset of the centroid, the shape, and the width of the matching distributions of all detector combinations.
Figure 5.12 shows the matching distributions of high-momentum electrons ( GeV/c).
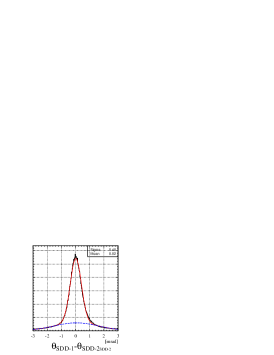
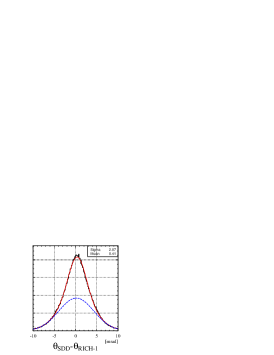
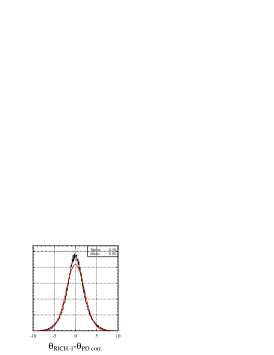
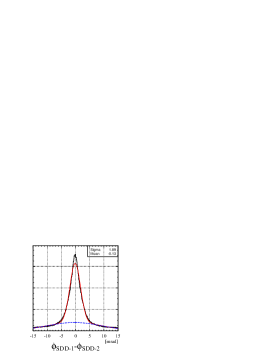
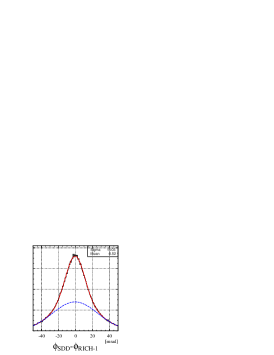
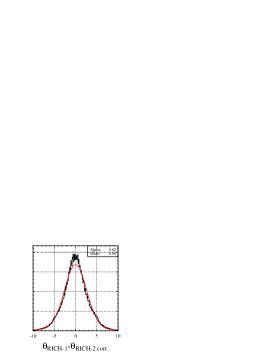
The large background fraction of the SDD matching distribution (first column in Fig. 5.12) can be attributed mainly to single anode hits with very poor resolution in anode direction. In case of a SDD-vertex track segment with a single anode hit in either drift chamber, the -coordinate of the combined track was determined by the -value of the other detector rather than the average of both drift chambers in order to improve the matching with the downstream detectors. The limited reconstruction capability for partially overlapping rings in RICH-1 originating from SDD-1 conversions and close Dalitz pairs (here not rejected by other means) results in large fractions of unrecognized double rings which exhibit a poor matching quality of SDD and RICH-1 (second column in Fig. 5.12).
The centroid offset is a measure of the quality of the geometrical inter-calibration of individual detectors. The observed offset of less than mrad for all detector combinations is small compared to the width of the matching distributions and, thus, confirms the excellent quality of the calibration.
The remaining small miscalibration of the SDD-vertex telescope previously mentioned resulted in a run-to-run variation of the centroid of SDD–RICH-1 and SDD–PD matching distribution shown in Fig. 5.13. The similarity of both distributions is prove that the variation is indeed caused by the SDD. The offset of the matching was not corrected because the SDD–RICH-1 offset is small compared to the width of the distribution (see Fig. 5.12) and the SDD–PD -match was not used in the analysis (see App. B).
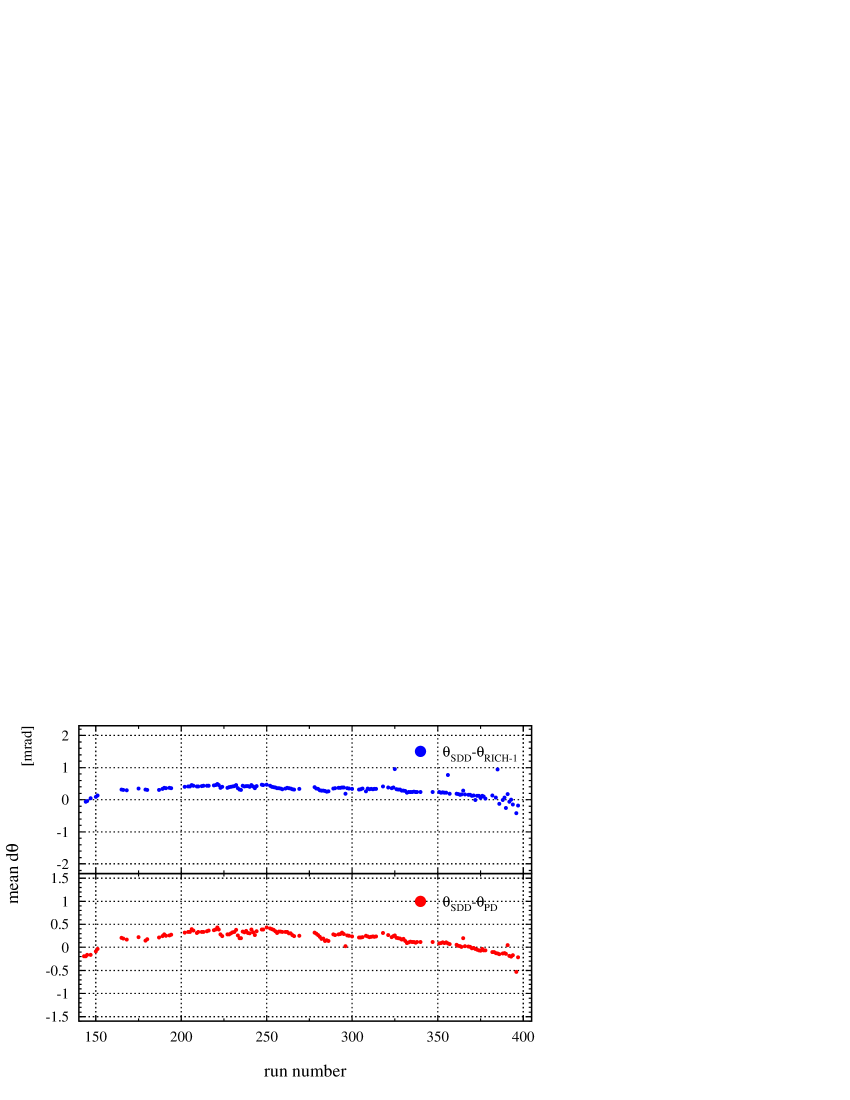
In the limit of high momentum, multiple scattering is negligible and, hence, the width of the matching distribution is determined by the contributions of the single detector resolutions:
| (5.2) |
Given the matching distributions of any combination of three independent detectors, Eq. 5.2 can be resolved to extract the single detector resolution:
| (5.3) |
Table 5.2 summarizes the extracted detector resolutions.
| Detector | resolution [mrad] |
|---|---|
| SDD-1 | 0.28 |
| SDD-2 | 0.28 |
| RICH-1 | 2.03 |
| RICH-2 | 1.66 |
| PD | 0.54 |
5.4.3 Momentum resolution
The experimental momentum resolution is determined by the accuracy of the measurement of the azimuthal deflection between detectors before (SDD and RICH-1) and after the B-field (RICH-2, PD):
| (5.4) |
It is composed of the single detector resolution and the momentum dependent multiple scattering. The latter can be inferred from the experimentally accessible -matching distribution:
| (5.5) |
It should be noted that Eq. 5.5 slightly underestimates the multiple scattering contribution because it is partly absorbed in the follow-your-nose tracking approach applied to the RICH-PD track segments in -direction (see Sec. 5.3.5).
The left panel of Fig. 5.14 shows the width of the matching distribution of various detector combinations as a function of momentum.
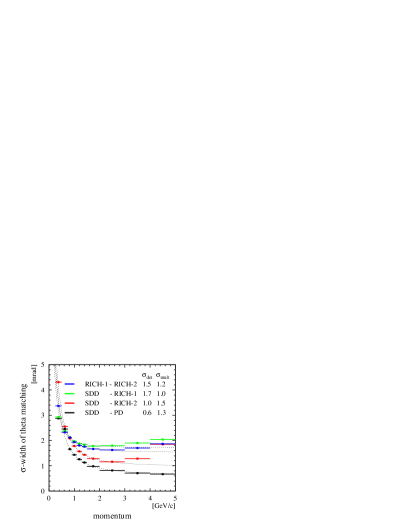
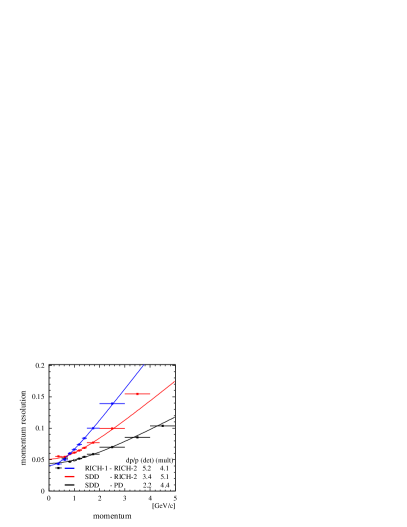
To obtain the momentum resolution, Eq. 5.4 can be expressed in terms of Eq. 5.5:
| (5.6) |
The accuracy of the momentum determination according to Eq. 5.6 is depicted in the right panel of Fig. 5.14 for various detector combinations. Examination reveals the momentum measurement based on the SDD–PD combination to be best for high momenta while the RICH-1–RICH-2 deflection measurement is best for low momenta. This ground in the fact that RICH-2 measures the local -angle of the particle trajectory in the RICH radiator after the azimuthal deflection in the magnetic field. The -deflection observed in the RICH-2 detector is about 56% larger than in the PD detector. For small deflection, i.e. high momentum, the resolution is dominated by the intrinsic detector resolution and favors the SDD–PD combination. To optimize the mass resolution, the latter effect was taken into account by simply switching from the RICH-1–RICH-2 momentum measurement to the SDD–PD combination for momenta smaller than 0.8 GeV/c. The combined momentum resolution given by:
| (5.7) |
agrees with the result of previous studies [113].
5.5 measurement and centrality determination
Global observables of a relativistic heavy ion collision such as the multiplicity, i.e. total number of emitted particles , or the transverse energy carry important information about the reaction dynamics [119, 120]. The centrality of a collision in particular can be inferred from the particle yield. The characterization of collisions in terms of centrality and forms the basis for comparison among various collision systems and different experiments.
In the CERES experiment, the number of charged-particle tracks is measured with SDDs in the pseudorapidity range from 2 to 3. The distribution of per event obtained is shown in Fig. 5.15.
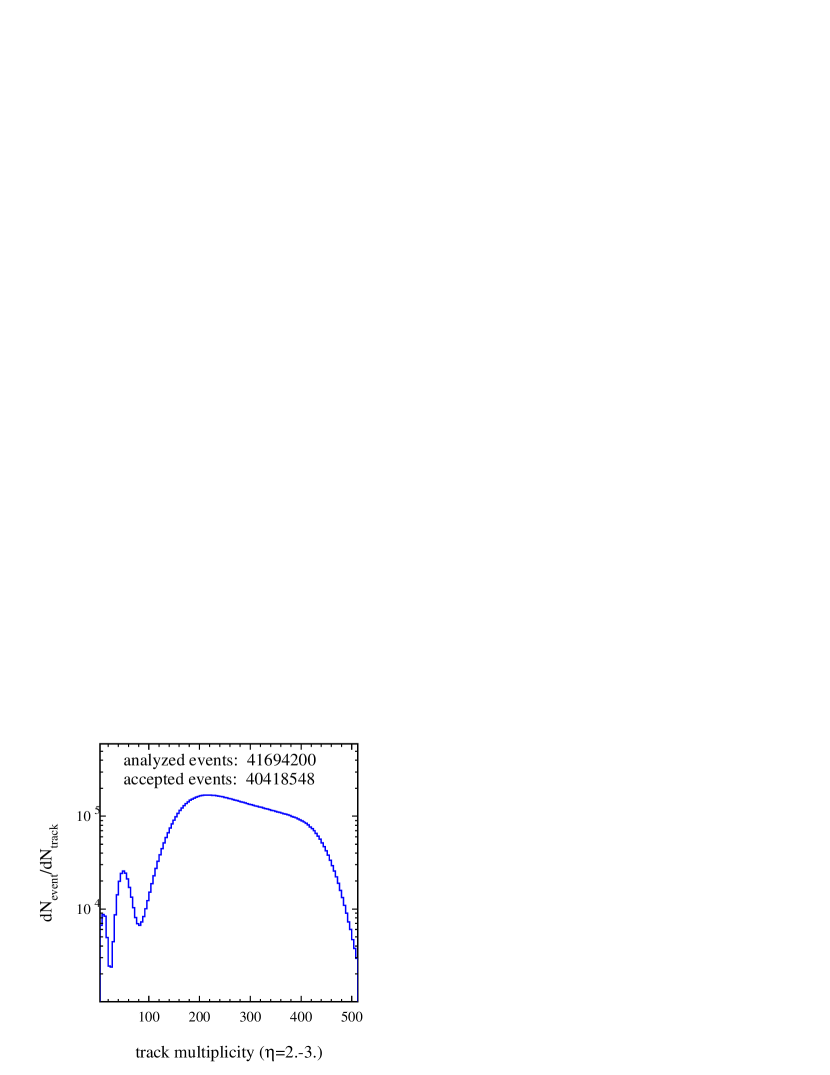
Multiplicity distribution for SDD tracks.
The cutoff towards lower multiplicity corresponds to the trigger threshold of 100 hits in the multiplicity detector MD. The peak at is caused by non-target interaction. These event are later removed by an offline centrality cut.
Figure 5.16 shows the position of the trigger slope (left edge) as well as of the central slope (right edge) of the multiplicity distribution to change with time. The apparent decrease of the central-slope position was caused by the gradual deterioration of one high-voltage sector in the SDD (see Fig. 5.37 in Sec. 5.7.2). The remaining variation was attributed to a slight temperature dependence of the SDD reconstruction efficiency. The data was corrected for both effects.
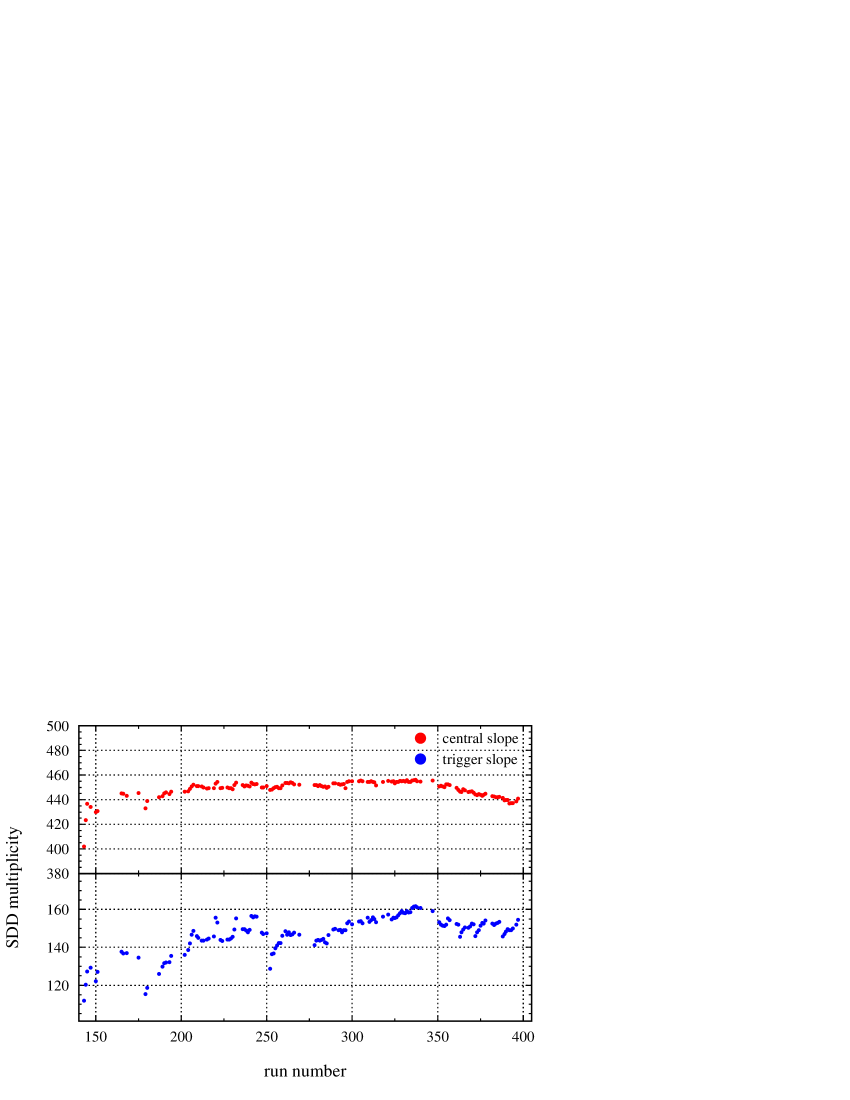
The large fluctuation of the trigger slope is most likely caused by an unstable voltage supply for the multiplicity detector. It results in a variation of the initial centrality selection and, therefore, does not directly impact on the measured multiplicity except for the weighted multiplicity average (less than 1%). The limited statistics of the data sample did not allow to enable full exclusion of the low-multiplicity range affected by the trigger fluctuation.
The measured multiplicity distribution needs to be corrected for the reconstruction efficiency of the SDD to obtain the true number of emitted charged particles. The efficiency correction was derived from a Monte Carlo simulation of 10000 realistic UrQMD events [121]. It describes passage of all particles through target and detectors taking into account energy loss, -conversions, -radiation, particle decays, and all detector properties including electronic noise [113, 114]. All simulated events were reconstructed as genuine raw data events.
Delta electron tracks do not point to the vertex and can be recognized and removed to the level of less than one track per event [122]. The beam pile-up was considered to be small.
The comparison of the number of reconstructed tracks with the number of initial tracks, illustrated in Fig. 5.18 (left panel), shows the obtained correction factor of 5% to be smaller then the 20% upward scaling found in the previous analysis [113].

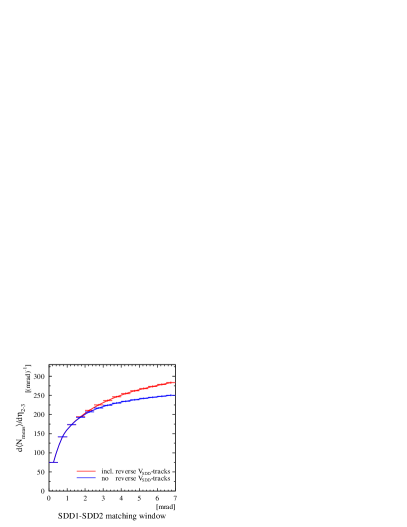
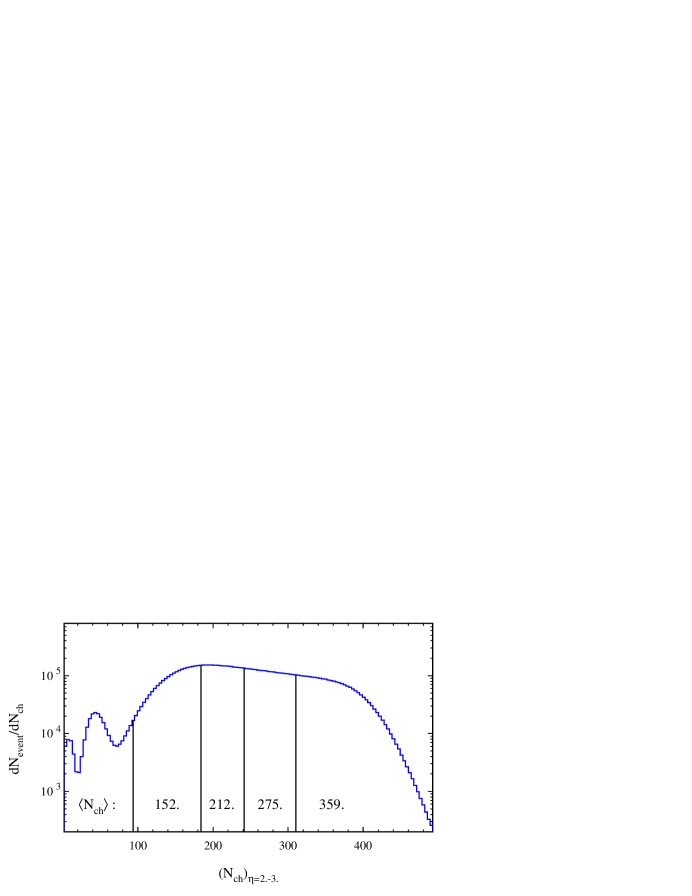
The difference is attributed to a use of a relatively large matching window between SDD-1 and SDD-2 (7 mrad) and the inclusion of reversed VSDD-tracks (i.e. two tracks sharing the same hit in SDD-2) in the SDD tracking which results in a 15% increase of random background matches as shown in Fig. 5.18 (right panel).
The average charge-particle multiplicity obtained with the Monte Carlo correction for the two cases with and without reversed VSDD-tracks differs by 10% which suggests that Monte Carlo simulation does not fully describe these subtle differences in the tracking. Therefore, it seemed best to account for the reversed VSDD-track contribution by applying an additional % correction to the measured multiplicity. The fully corrected multiplicity distribution is shown in Fig. 5.18.
The systematic error of this method is very difficult to evaluate, as the correction relies solely upon the Monte Carlo simulation. A rough estimate can be obtained by attributing all variations in the measurement of various track reconstruction methods to the systematic error. A comparison of the new and old SDD software gives a difference of 5%. Additionally, the Monte Carlo simulation lacks a description of the observed efficiency variations (4%), the VSDD-track contributions (8%), and realistic SDD pulse shapes including artificial hit splitting. The sum of all contributions gives an estimate of the upper limit of about 11% for the relative systematic error.
The centrality of a collision refers to the fraction X of the total geometric cross section :
| (5.8) |
where R and A denote the radius and the mass number of the colliding ions, respectively. The total cross section observed can be related to the detected number of charged particles for a minimum bias event selection:
| (5.9) |
Here , , and are the number of target nuclei per unit area, the number of beam particles, and the number of observed minimum bias events, respectively. Integration of Eq. 5.9 gives the centrality X for a certain cutoff:
| (5.10) |
The resulting relation is plotted in Fig. 5.19.
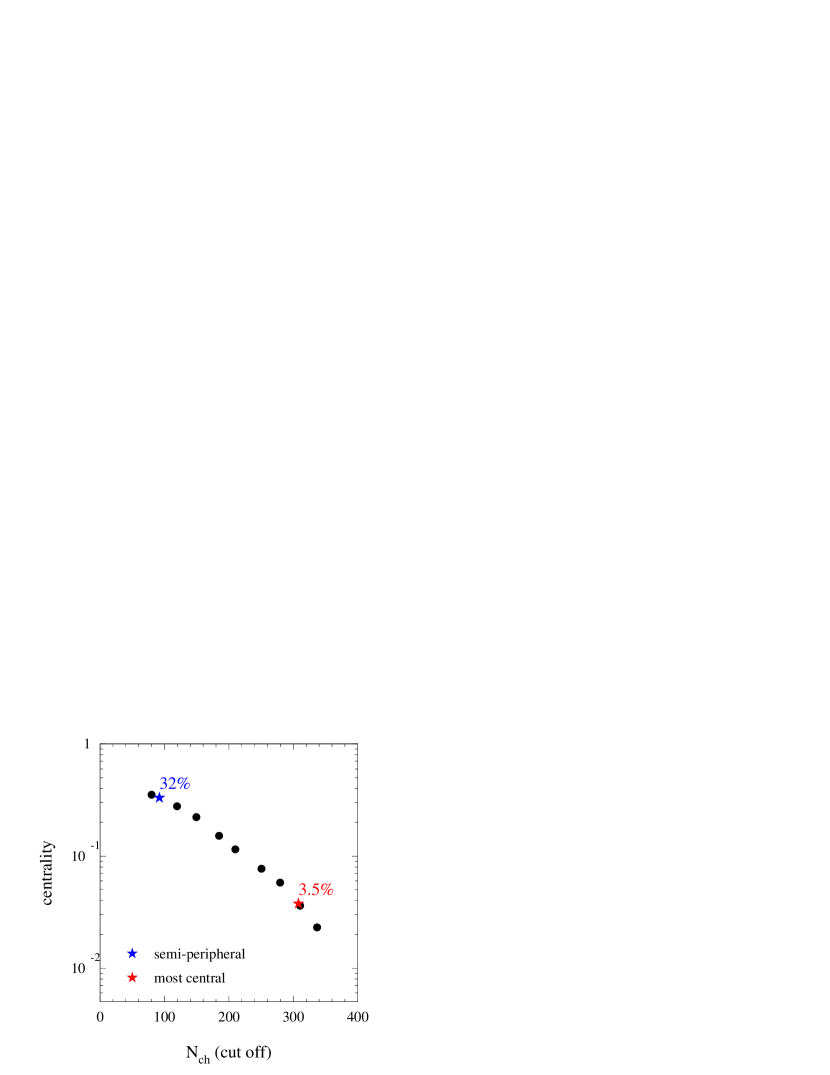
Centrality as a function of the cut on charged-particle multiplicity ( ) [63, 74].
The cutoff of 104 applied in the off-line analysis corresponds to a relative cross section of (326)%. The selection of most central events according to 310 equals a relative cross section of (3.50.6)%. The relative cross section exhibits a large uncertainty because the radius of the colliding nuclei in Eq. 5.8 is not precisely known.
5.6 Simulation of the combinatorial background
5.6.1 Sources of combinatorial background
There are two dominant sources of dilepton in the mass region of : first, leptonic and semi-leptonic decays of scalar and pseudo-scalar mesons [8] and, second, photon conversions in the target and the first silicon drift chamber with being the predominant source of photons.
These decays lead to the production of electron-positron pairs, henceforth referred to as unlike-sign pairs. Production of electron-electron or positron-position pairs, so-called like-sign pairs, requires higher-order processes. The strongest of them is the decay, which is not only suppressed by a factor of 380 [8] relative to the Dalitz decay but also charge symmetric. It is negligible for this analysis.
The experiment measures a certain number of positron tracks n+ and of electron tracks n- in each event. Exclusive measurement is not possible because most dileptons are produced within the collision zone. Considering all combinations of observed electron and positron tracks of an event, it is impossible to decide which unlike-sign pair originates from a single decay and which is an accidental combination of individual tracks of separate decay processes.
Therefore, two classes of unlike-sign pairs can be distinguished: the actual signal of correlated dielectrons and the so-called combinatorial background pairs . The total observed unlike-sign pair distribution can be expressed as:
| (5.11) |
Both signal and background exhibit a continuous spectrum. The combinatorial unlike-sign background can be estimated by the same-event like-sign method or by the mixed-event technique.
The first method is based on the fact that the same-event combinatorial like-sign background is identical to the combinatorial unlike-sign background in the absence of correlated like-sign pairs from physics origin and under the assumption of acceptance and efficiency for electrons and positrons being the same. In the mixed-event technique, tracks from different events are combined to yield the combinatorial unlike-sign background.
All published dielectron invariant mass spectra of the CERES collaboration [57, 123, 124, 125, 126] were obtained with the same-event like-sign background method. Previous attempts to employ a mixed-event background were unsuccessful. The first detailed comparative study of both methods will be presented in Sec. 5.6.2 and 5.6.3. The comparison of both simulated backgrounds can yield valuable insight, test inherent model assumption, and ultimately increase confidence in the background subtraction procedure.
5.6.2 Same-event combinatorial background
The multiplicity of electrons or positrons produced in a collision can be described by a Poisson probability distribution (see Fig. 5.20):
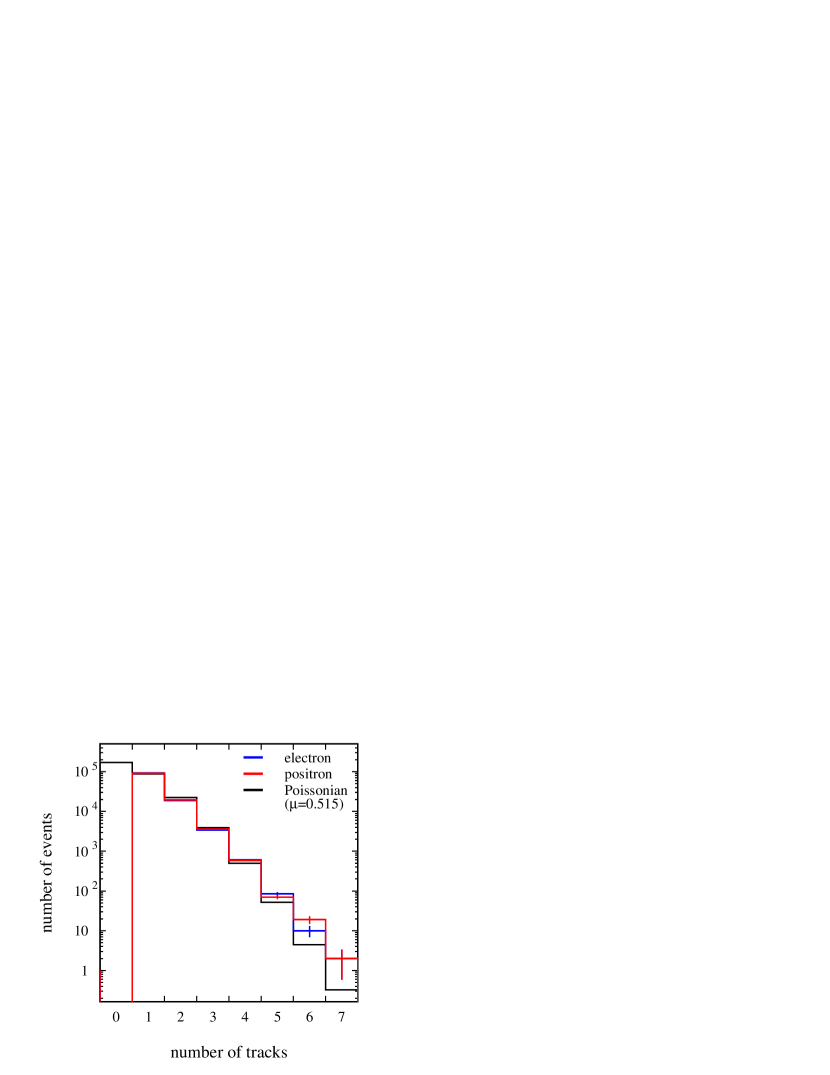
Track multiplicity of run 144. The distributions of electrons and positrons are almost identical. Both are well described by a Poissonian distribution with a mean value of = 0.515. The variation of the track multiplicity distribution within a charged-particle multiplicity bin is neglected [127].
| (5.12) |
The probability B to observe tracks out of initial particles is distributed binomially:
| (5.13) |
The probability to observe a lepton track is a product of the probability of a particle falling into the acceptance and the reconstruction efficiency depending on various single-track selection cuts. and are treated separately to account for possible charge asymmetries of the acceptance or the reconstruction. Making use of Eq. 5.13 one obtains the average number of reconstructed tracks:
| (5.14) | |||||
In first-order approximation, the mean number of pairs per event with positrons and electrons is given by:
| (5.15) | |||||
The factor denotes two-track efficiency, introduced by physics correlation, detector, or analysis for each sort of charged pairs. Making use of Eq. 5.15, the number of pairs averaged over all events becomes:
| (5.17) | |||||
| (5.18) |
Equation 5.18 represents the unknown unlike-sign combinatorial background. By comparison of and with , it becomes obvious that the geometric mean of the like-sign background is an excellent approximation of the unlike-sign combinatorial background:
| (5.19) |
This proposition is fulfilled if the two-track efficiency is pair charge independent. A charge asymmetry of the single-track reconstruction probability , on the other hand, will not alter this result. A more detailed derivation including an extension to the case of the simultaneous occurrence of correlated and independent lepton sources can be found in [128].
For the detector the assumption about the pair charge independence of the efficiency is certainly true for large pair opening angles. In this case, the tracks are well separated in all detectors. It can, however, be contested if the pair-charge symmetry of the detector is broken by the magnetic field. While the like-sign pairs with a small opening angle remain always close in space, the unlike-sign pairs form either a so-called “cowboy” or “sailor” configuration as illustrated in Fig. 5.21. Thus, a finite two-track resolution would affect like-sign and unlike-sign pairs differently.
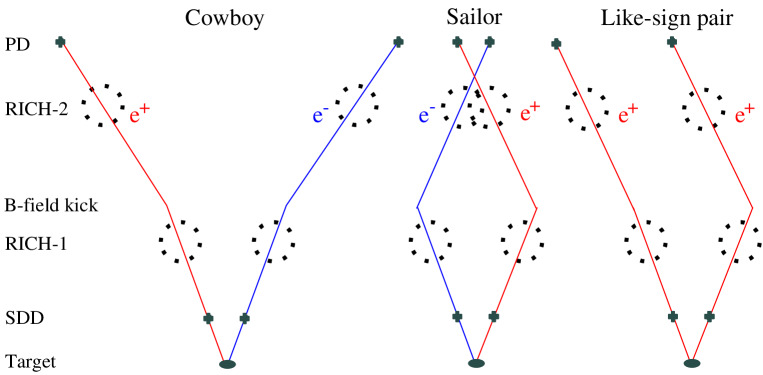
The second disadvantage of the like-sign background estimation method is the large statistical error of the simulated combinatorial background:
A Poissonian distribution for the statistical error and statistical independence of the and pair samples were assumed. By use of Eqs. 5.11 and 5.6.2, the relative statistical error of the correlated dilepton signal can be expressed as:
To circumvent the statistical limitations of the same-event like-sign background, a smoothing procedure was applied in previous analyses [71, 113]. An approximation of the functional shape of the same-event combinatorial background was obtained by sampling the final -, -, and -distribution of single tracks and calculating the invariant mass of each pair of simulated tracks. Using this procedure, a background distribution can be obtained that is basically free of statistical errors. To account for impact parameter dependence, the tracks were divided into four multiplicity and four theta bins. Finally, a mass dependent correction factor was applied to the smoothed invariant-mass background distribution. It is extracted by fitting the ratio of the observed combinatorial like-sign background to the smoothed background while keeping the integral of the measured distribution as shown in Fig. 5.22 (left panel). The resulting invariant-mass distribution of the smoothed background is plotted in the right panel of Fig. 5.22.
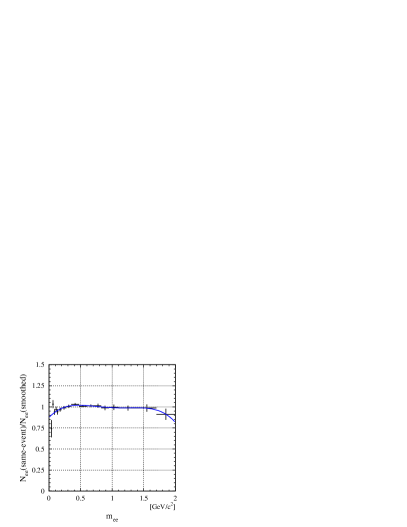
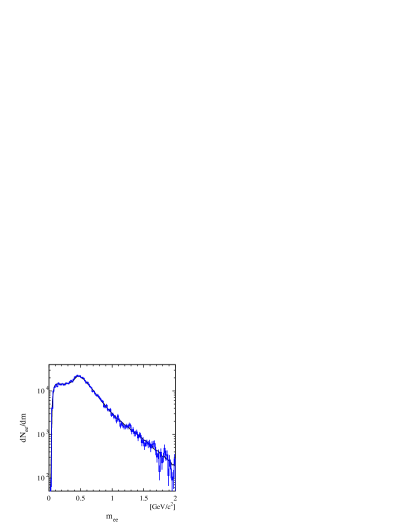
Effectively, this procedure hides the statistical error by shifting it to the systematic error of the background subtraction. An additional drawback of this method results from the fact that any scattering observed between adjacent mass bins is solely attributed to statistical fluctuations. This is a rather weak assumption because artifacts of the RICH-ring reconstruction algorithm are known to alter the touching-ring configuration (see Fig. 5.23). This leads to structures in the pair-opening-angle distribution which are directly translated into localized variation in the invariant-mass spectrum. Any correlation of this type would be masked by the smoothing.
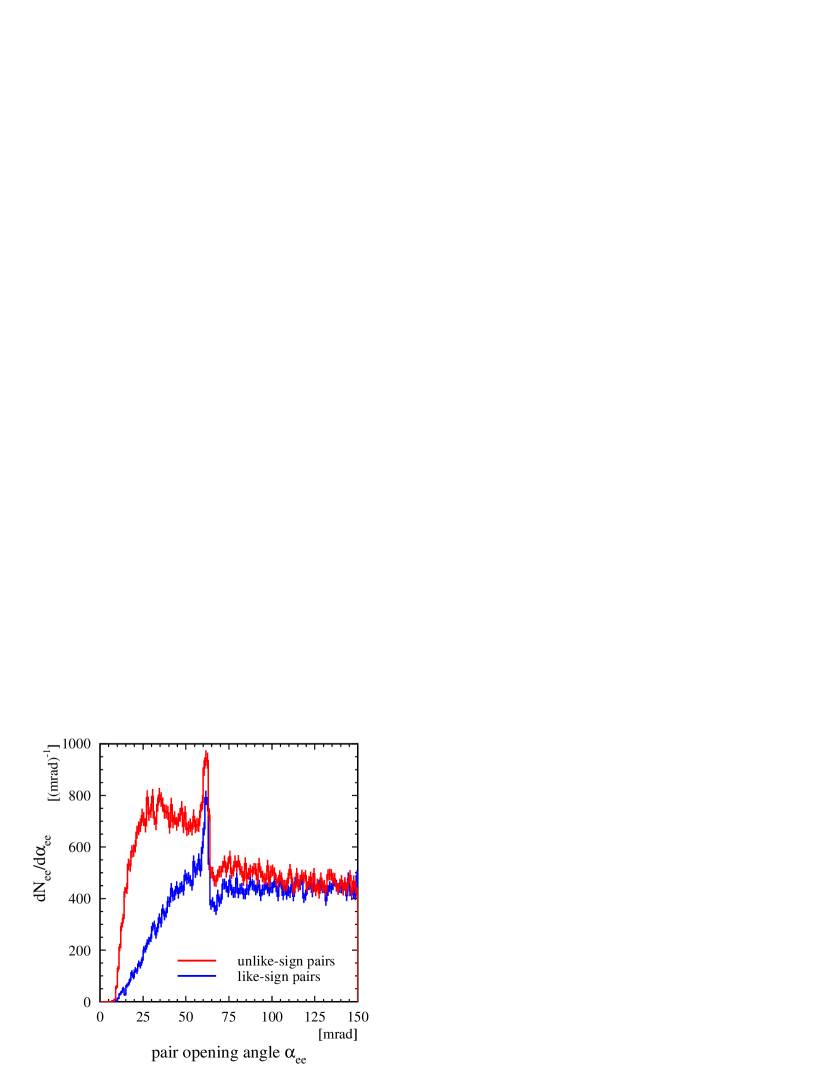
The pair-opening-angle distribution shows nearly touching or slightly overlapping RICH rings to be “pulled” or “pushed” to a touching-ring configuration with an opening angle of 60 mrad. Additionally, the reconstruction efficiency increases as the photon hits of one ring promote the reconstruction of an other touching ring.
To exclude these potentially dangerous effects and to assess the systematic errors involved, it would be of utmost importance to independently verify this method.
5.6.3 Mixed-event technique
Alternatively to the use of the independent like-sign pairs of each event, unlike-sign pairs, obtained by combination of opposite charged tracks of different events, are inherently independent. This procedure is commonly known as the mixed-event technique. The straightforward modification of Eq. 5.15 gives the mean number of observed mixed unlike-sign pairs of two randomly selected events A and B with initial multiplicity and :
| (5.22) |
where each track of event A is combined with all tracks of event B with opposite charge. Again, the averaging of many pairs of events with different initial particle multiplicity yields:
| (5.23) | |||||
It is important to note the single-track events to be contributing to this average. In contrast, the same-event technique requires at least two initial tracks per event. To obtain the mixed-event background, the mixed unlike-sign distribution (see Eq. 5.23) has to be normalized with the number of mixed-event pairs :
| (5.24) |
where Nexp denotes the total number of fully analyzed events including those where no electron track was found. Equation 5.24 defines the mixed unlike-sign background.
All attempts to construct the mixed-event unlike-sign background on the basis of the previous raw data analysis failed because the single-track events have been left out. Furthermore, only events containing at least one dielectron recognized either as a so-called Dalitz or open pair were stored for further analysis (see [71] for detailed description). Inspection of Eq. 5.23 and 5.24 reveals that the complete rejection of single-track events together with a signal pair dependent background discrimination must lead to a biased event sample and, hence, to a potentially distorted mixed background (see Fig. 5.1).
A comparison of Eq. 5.18 and 5.24 shows to be equivalent to the much sought-after independent unlike-sign background:
| (5.25) |
provided:
| (5.26) | |||||
| (5.27) |
Experimentally, the condition 5.26 can be approximated by restricting the event mixing to classes of events with similar properties and subsequent averaging of all classes. Technically, all events were divided into sub-samples of 4 multiplicity bins and 158 time bins. The temporal sub-samples were found to be important because pressure, temperature, and detector parameters changed considerably during the 6 weeks of data recording.
The condition 5.27 means an infinite two-track resolution. While this assumption holds for large pair opening angle (i.e. mrad), it is obviously not fulfilled for close pairs. For those the correlation factor drops below one and, hence, the mean number of background pairs is overestimated by the mixed-event background. Note, that the correlation factor should not depend much on charged-particle multiplicity because the two-track resolution is dominated by the double-ring resolution of RICH-1 and RICH-2 detector, and the observed background in both RICH detectors is related to electronics noise and scattered beam particles but not to the event multiplicity.
In general, there are two main advantages of the mixed-event technique. First, it is also applicable to the deconvolution of like-sign correlated signals (e.g. open charm detection [129]) which, however, is of no importance for this analysis. Second, the statistical error of the mixed-event background distribution can be reduced simply by increasing the number of mixed events in Eq. 5.24. It is important that is chosen in such a way that the probability to select the same-event more than once remains small. Otherwise, the result will be hampered by the auto-correlation of the mixed events. Consequently, the ultimate increase of statistics is limited by the size of the sub-samples used for mixing.
For technical reasons the ratio of the number of mixed pairs to the number of same-event like-sign pairs was fixed rather than the event ratio. A simulation based on a toy model confirmed that a pair-mixing ratio of up to is safe with respect to any auto-correlation [130, 131].
In case of a small pair-mixing ratio, the statistical error of the mixed background can be expressed in terms of the statistical error of the same-event like-sign background:
| (5.28) |
Compared to the same-event like-sign background, the statistical error of the mixed background is reduced by about a factor of 5 for a standard mixing ratio of 20. For this example the statistical error of the signal is reduced by 30% compared to the same-event method. If the background had no statistical uncertainty at all, a maximum reduction of 42% could be achieved according to Eq. 5.6.2.
The mass dependence of the relative statistical error was estimated by the statistical fluctuation of the mixed-event background for randomly selected event sub-samples. Figure 5.24 shows the average deviation of the mixed-background distribution from the mean value.
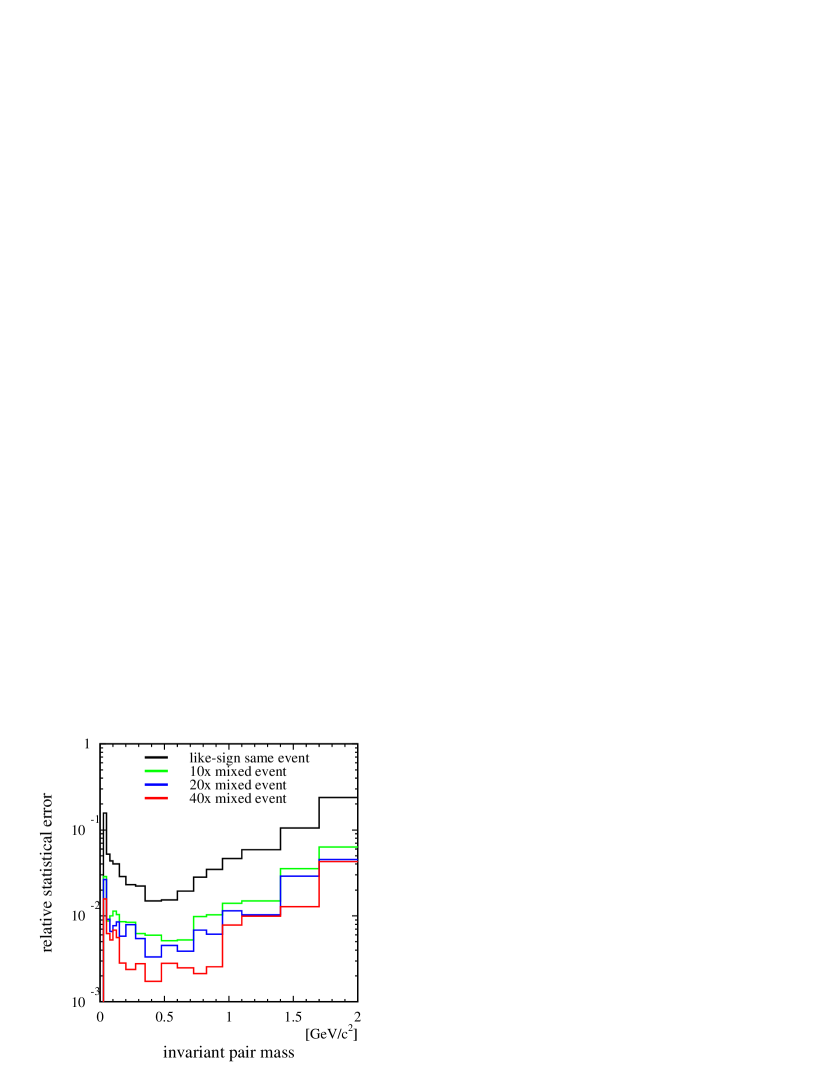
Estimate of the statistical error of the mixed-event background for mixing ratios of 10, 20, and 40.
Taking the example of a mixing ratio of 20 the relative statistical error of the mixed background increases continuously from 0.5% in the mass range of 0.2 1 GeV/c2 to about 5% at 2 GeV/c2.
According to condition 5.26, the shape of the mass distribution of the mixed unlike-sign background is very sensitive to variations of single-track reconstruction efficiency or acceptance with time. It was carefully checked that the properties of the single tracks contained in the mixed-event and the same-event selection match well. The single-track distributions of same-event and mixed-event background agree well with each other, as apparent in Fig. 5.25.
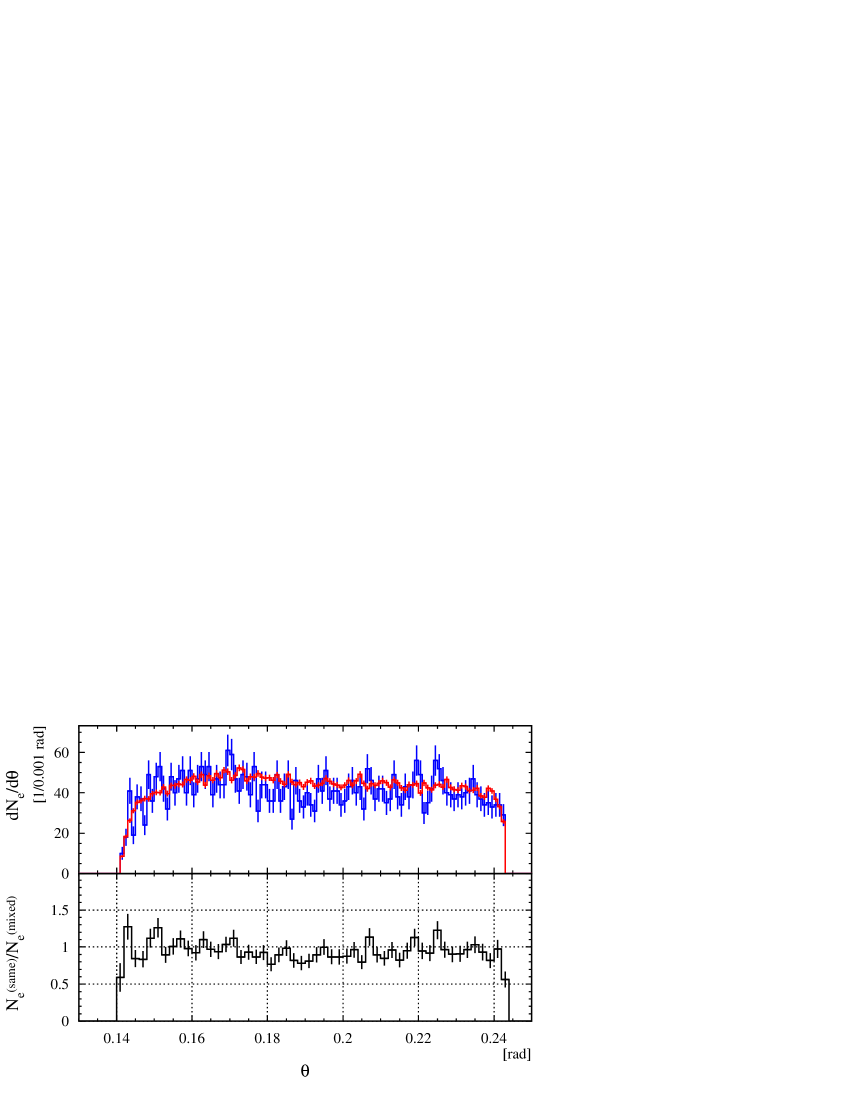
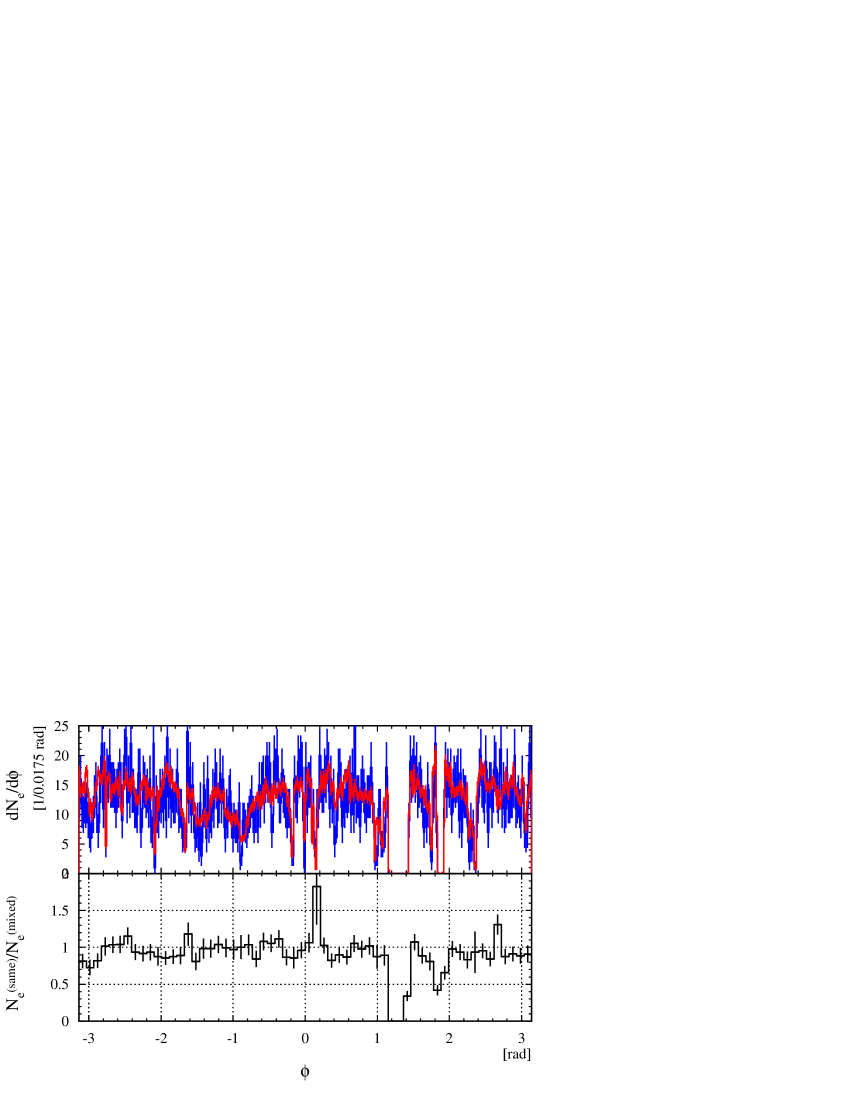
The small differences in the -distribution are restricted to low-efficiency regions in the RICH detectors and acceptance holes of the SDDs. These can be attributed to the inherent averaging of discontinuities by the mixed-event technique. The impact of this effect can be neglected because the occupancy is low in these regions. The close resemblance of both -distributions of mixed and same-event selections, as seen in Fig. 5.26, is proof for local efficiency changes in RICH-2 or PD detector not to alter the momentum determination.
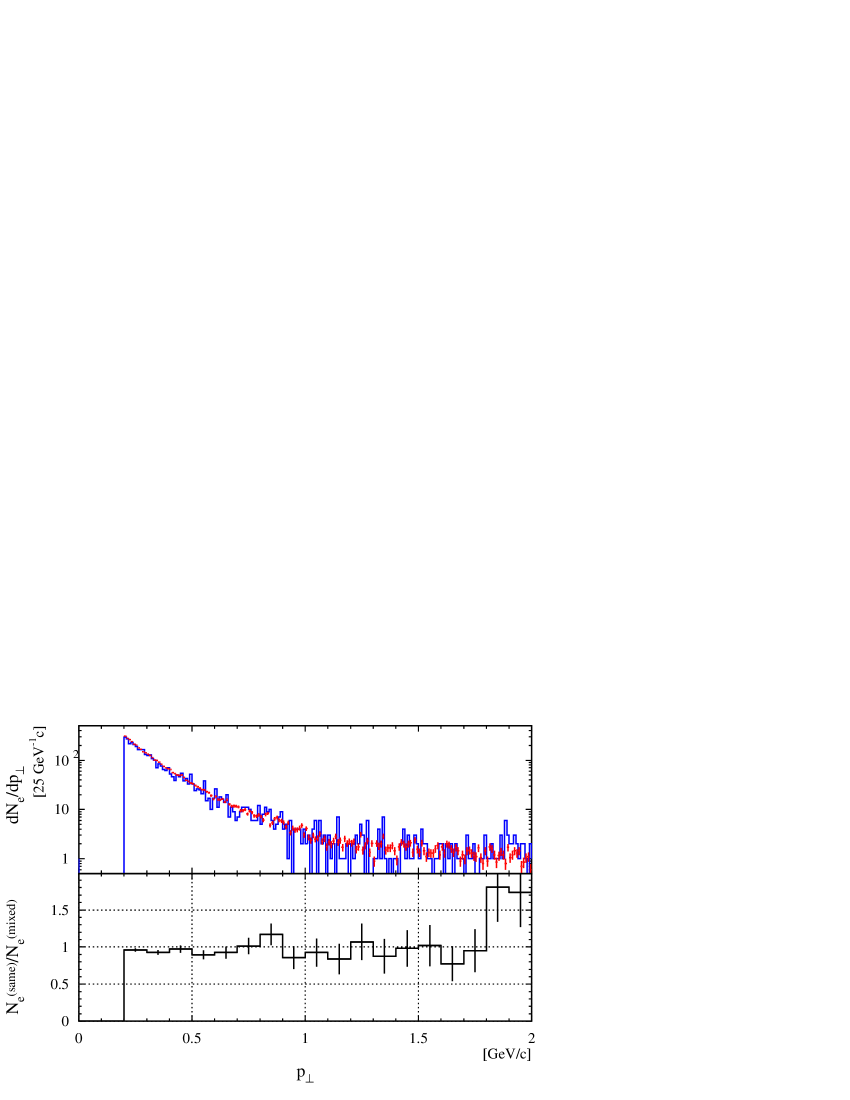
5.6.4 Comparison of mixed-event and same-event background
After the construction of the same-event and the mixed-event background in Sec. 5.6.2 and 5.6.3, the inherent assumptions of both methods can be verified by comparison of the invariant-mass distributions plotted in Fig. 5.28.
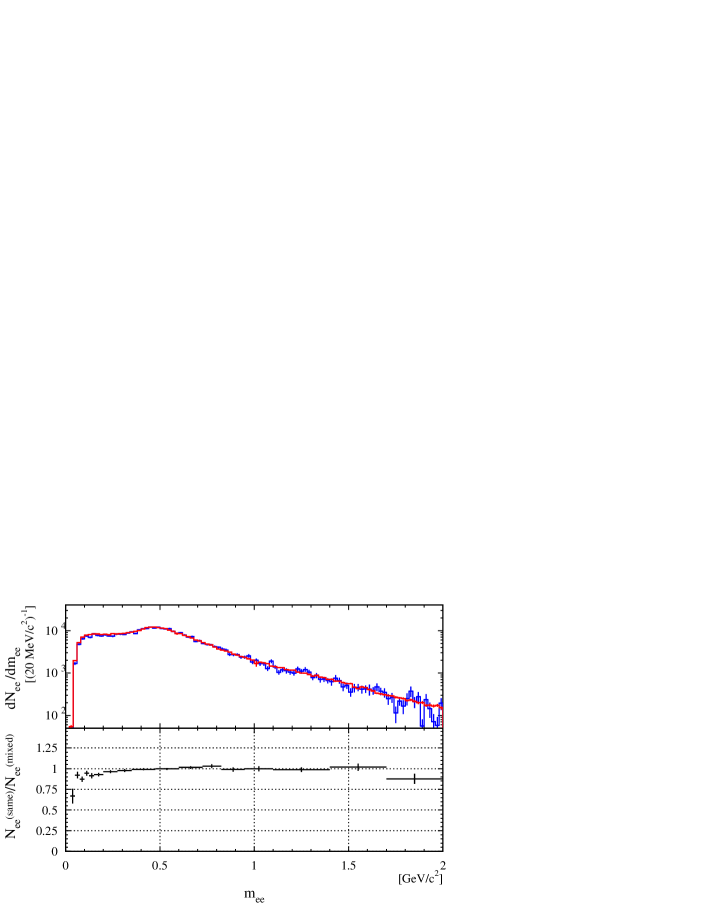
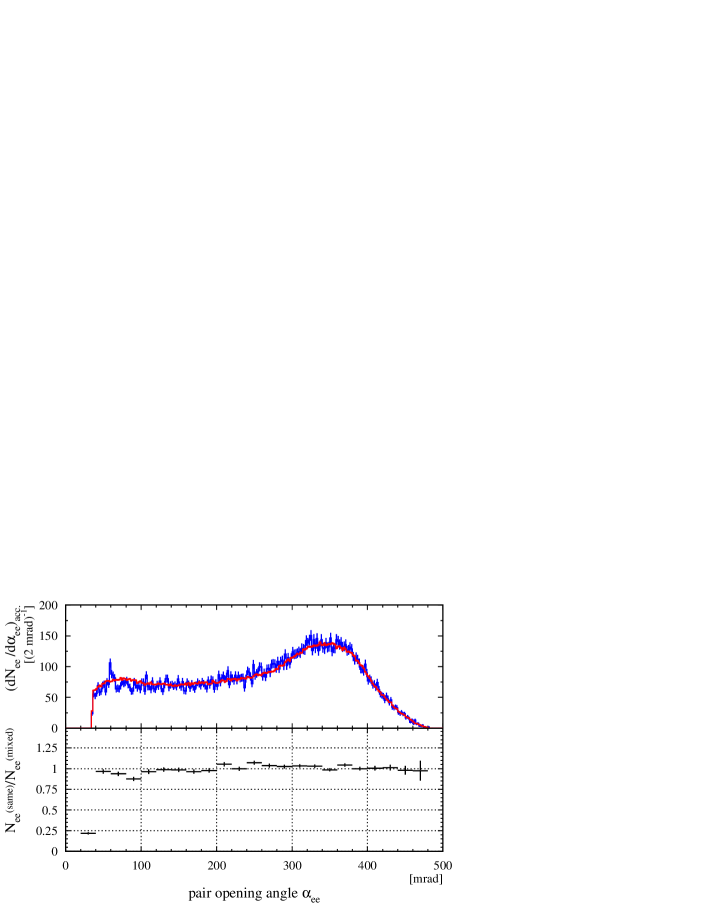
The agreement of the shape of both distributions is striking considering that the number of background pairs varies by more than 2 order of magnitude in the observed mass region. Combining Eqs. 5.19 and 5.24 gives:
| (5.29) |
Thus, the observed equivalence requires that:
| (5.30) |
According to Eq. 5.30, the mixed-event average of the single-particle detection probabilities resembles the same-event average, and the two-track-correlation factor must be very close to one. This is a remarkable result. It proves the particular choice of mixing-sub-sample size to be appropriate to ensure sufficient temporal stability of the track efficiency and of the pair acceptance with respect to pair mass. Note, that the relative error of the mixed- to same-event ratio is dominated by the statistical error of the same-event background as expected for a relative mixing ratio of 20.
The 10% drop of the ratio in Fig 5.28 for pairs with mass below 350 MeV/c2 is caused by the finite two-track resolution of the same-event background. The finite spatial resolution of both RICH detectors [71, 113] and the artifacts of the ring reconstruction for touching rings introduce a correlation for pairs with small opening angles, as seen Fig. 5.28, that depends on the RICH-ring distance.
Although the different behaviour of like-sign and unlike-sign pairs in the magnetic field (see Fig. 5.21) does not allow to directly conclude that:
| (5.31) |
it is still a very good approximation because the pair efficiency is dominated by the RICH-1 detector due to its comparably low spatial resolution (Tab. 5.2). Most important, this effect is limited to the low-mass region. In principle, the double-track reconstruction efficiency can be implemented into the mixed-event background but this procedure is obstructed by the complex experimental conditions (e.g. multiple-anode hits in SDDs and overlapping RICH-rings), eluding a precise description by the Monte Carlo simulation. Not correcting for the double-track efficiency results in a systematic error of the dilepton signal induced by the mixed-background subtraction. However, it is limited to 10% because of the large signal-to-background ratio (S : B 1) in the low-mass region.
It is worth mentioning that the mixed like-sign invariant-mass distributions, namely and , agree very well with each other, as apparent from the ratio plotted in Fig. 5.29.

Ratio of - to -mixed invariant mass distribution.
Rewriting Eq. 5.24 in terms of - and -pairs gives the condition for equivalence:
| (5.32) |
Provided that charge symmetry enforces identical initial multiplicity of and (see Sec. 5.6), the average single-track detection probability must be identical for both charges, exactly as one would expect for the -symmetry of the CERES detector.
While the arguments above were solely based on the shape of the mixed-event invariant-mass distribution, its total normalization is indispensable for a correct background subtraction. As noted in [113], an underestimation of the independent background of about 4% would exhaust the strength of the observed dilepton excess. As already explained in Sec. 5.6.3, the integrated mixed-event background is expected to slightly overestimate the same-event background due to the two-track efficiency losses. In contrast, the ratio plotted in Fig. 5.30 shows that the same-event background overshoots the mixed-event background.
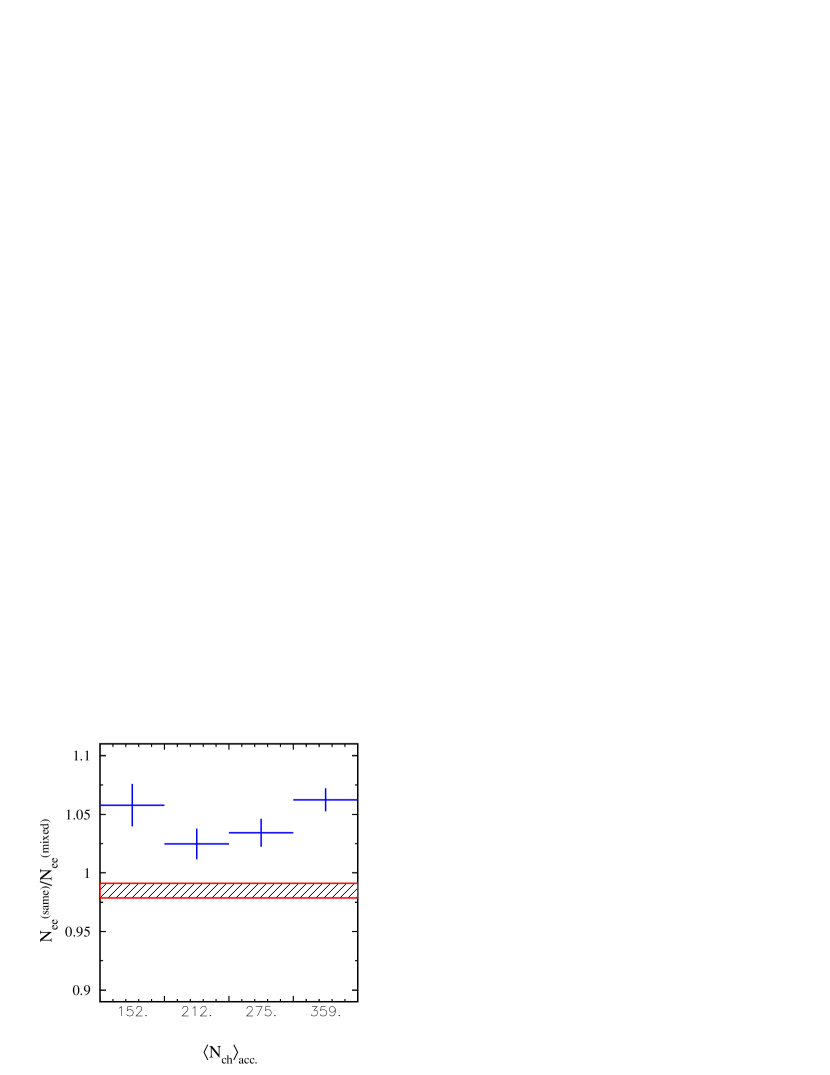
Ratio of the mixed-event unlike-sign background, normalized by the number of mixed-event pairs, to the same-event like-sign background for 4 multiplicity bins. Both spectra were corrected for single-track efficiency.
Correcting both distributions for the single track efficiency determined in Sec. 5.8 is not sufficient to recover the correct total normalization. There is an indication that this effect is related to large localized event-to-event reconstruction efficiency changes in both RICH detectors. If a continuous pad-wise gain calibration could resolve this problem, remains to be seen in future analysis. Unfortunately, a slight multiplicity dependence of the effect (see Fig. 5.30) does not allow for a sufficiently accurate re-normalization. It should be mentioned that, if this effect were an artifact of the same-event background, it would result in a twofold increase of pair signal which can be clearly excluded.
To avoid these difficulties, the normalization of mixed-event background was fixed with respect to the total number of observed same-event background pairs with mass above 0.35 GeV/c2. This selection explicitly excludes the low-mass range, where the mixed-event background is not identical to the same-event background (see Fig. 5.28). As a consequence, 20% of the gain in statistics of the mixed-event background had to be sacrificed. The error of the total normalization is now limited by the statistical error of the same-event like-sign background integrated above GeV/c2.
To summarize, it is demonstrated that the mixed-event background resembles the same-event like-sign background. Theoretical and experimental consideration lead to the conclusion that both accurately simulate the much sought-after independent unlike-sign background. It is worth stressing that the observed likeness excludes the existence of any significant pair correlations and, therefore, strongly supports the validity of the background subtraction procedure.
5.7 Reduction of combinatorial background
5.7.1 Rejection strategy
As set out in Sec. 5.6, the correlated-dilepton signal has to be extracted from the observed number of unlike-sign pairs by the subtraction of the independent combinatorial background pairs (see Eq. 5.11). In fact, the contributions of the Dalitz decay, the conversion decay, and the single tracks of partially reconstructed pairs would overwhelm the number of signal pairs by three orders of magnitude for no further rejection. Moreover, the huge relative statistical error of the signal, given by Eq. 5.6.2, would invalidate any measurement owing to the very small number of expected signal pairs. For this reason the recognition and subsequent rejection of tracks stemming from the above mentioned sources is of utmost importance for the reduction of the combinatorial background.
Any rejection of tracks based on a certain cut criteria must balance the obtained background rejection power and the unavoidable loss of efficiency . Both are related to the relative statistical error of the pair signal by:
where denotes the probability to reject a combinatorial background pair and the pair reconstruction efficiency for a particular set of cuts. According to Eq. 5.7.1, it is possible to optimize the statistical significance of the observed signal by minimization of the ratio with respect to all applied cuts. Carried out on data, this procedure has the inherent danger of selecting a statistical upward fluctuation [80]. Therefore, the reconstruction efficiency was determined independently in a Monte Carlo simulation of the detector system [113].
As already noted in Sec. 5.2, the rejection strategy chosen in the previous analyses [80, 113] involved several correlated multi-parameter cuts. The resulting optimization procedure is very complex and difficult to reproduce. One of the goals of this work was to simplify the rejection strategy by focusing on a few powerful cuts and to gain better understanding of those.
It is useful to contemplate the characteristics of -Dalitz and -conversion decays for the following discussion. The yield of electron tracks originating from the decays is given by:
| (5.34) |
Here and are the branching ratio and the ratio of the expected number of mesons to the number of observed charged particles within the acceptance of the CERES spectrometer, respectively. Equation 5.34 results in an average of 1.4 electrons tracks per event for a mean value of Nch = 138 ( = 2.1–2.65). The additional contributions of the and Dalitz decay are negligible (see Sec. A).
All photons created either by meson Dalitz decay or in the initial collision can convert into dilepton pairs while traversing, first, the target and, then, the downstream detectors. The induced yield is determined by the dominating meson decays:
where is the thickness of the material in terms of its radiation length. The conversions in the target and in the SDD-1 lead to a mean track-multiplicity of 1.5 and 0.6, respectively, for a mean value of Nch = 138. Any conversions occurring downstream of SDD-2 are rejected by requiring a particle hit in both SDDs.
Both conversion and Dalitz pairs are distinguished from all other sources by their very low mass of 0.2 GeV/c2 (see Fig. A.4 in App. A). As the low-momentum tracks with 60 MeV/c cannot be reconstructed in the magnetic field (see Sec. 5.3.5), many of those pair are only partially reconstructed and, hence, the mass remains unknown. Owing to this, the rejection is primarily based on the pair-opening-angle characteristic. Figure 5.32 illustrates that most Dalitz and conversion pairs have an opening angle of less than mrad which makes it an equally distinguishing feature as the pair mass.

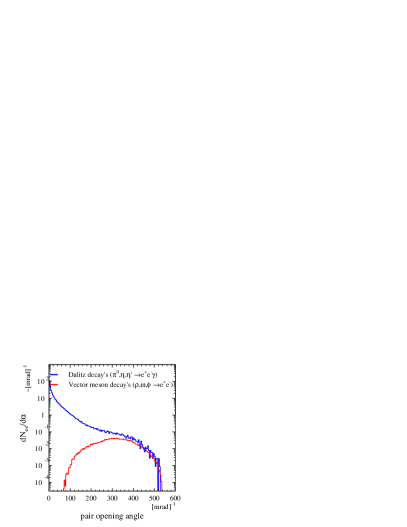
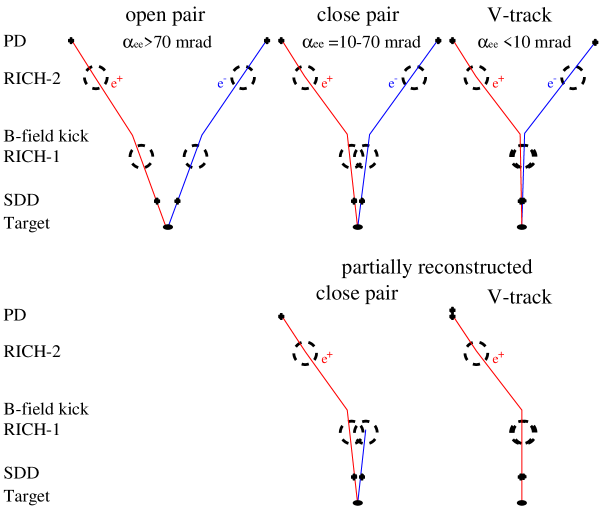
Thus, even partially reconstructed Dalitz and conversion pairs can still be recognized as such, if an additional hit in the SDDs or a ring in the RICH-1 detector was found in the close vicinity of the reconstructed track. Figure 5.32 illustrates the notations for the common pair configurations.
In anticipation of the following detailed study of each rejection cut, a summary of the complete background rejection strategy is already given in Fig. 5.33.
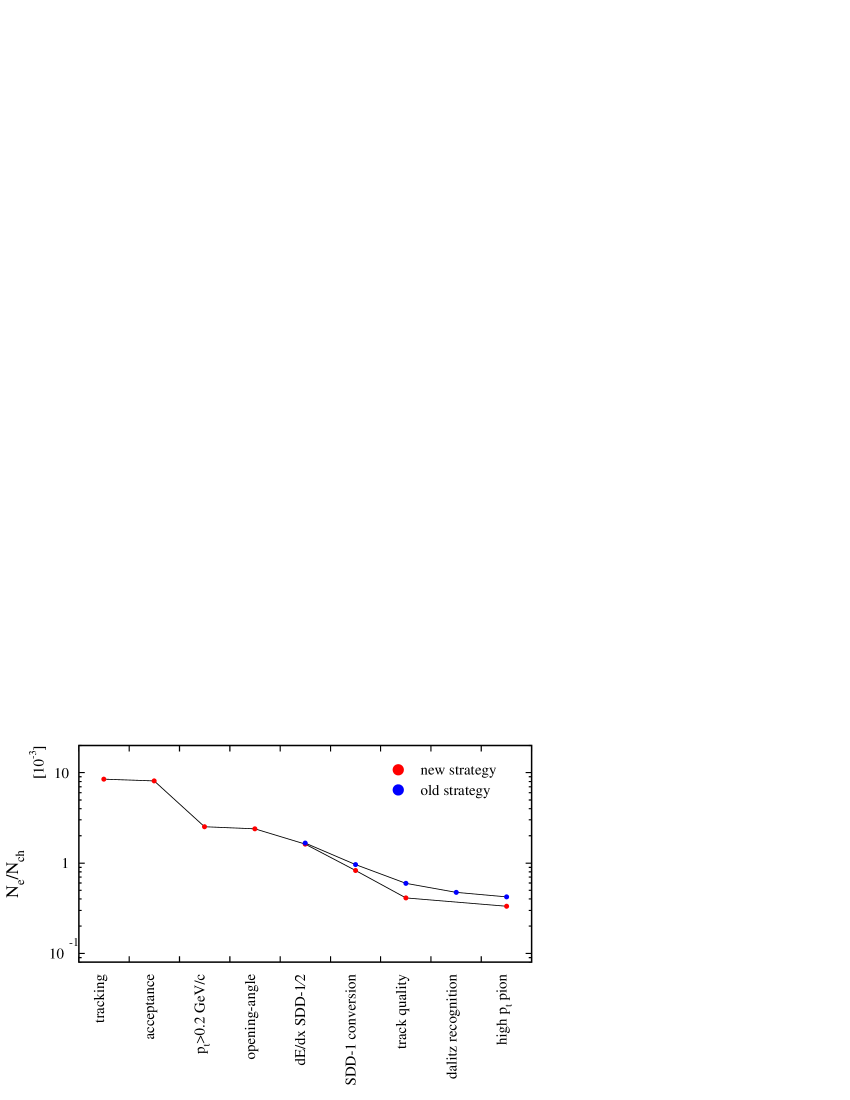
In contrast to the previous analysis (see Fig. 6.5 in [113]), the new strategy encompasses only five rejection cuts discarding two, but at the same time improves the rejection power by a factor of 1.4.
The so-called Dalitz cut was discarded for two reasons. First, it rejected little background and, second, single tracks were rejected relying on the properties of low-mass unlike-sign ”signal” pairs which cannot be simulated by the mixed-event technique because all mixed pairs are uncorrelated by definition. The cut also induces a subtle background correlation explained in the following. All pairs of a given event that share a track with an unlike-sign Dalitz pair, identified by a pair mass below 150 MeV/c2 and an opening angle of less than 50 mrad, are rejected. Only 50% of the identified pairs are truly Dalitz pairs, as the signal-to-background ratio is about 1:1. A misidentified Dalitz pair rejects one unlike-sign and one like-sign pairs in the example of a three-track event. In most cases, the unlike-sign pair rejected must have a larger mass than the misidentified Dalitz pair. However, no such restriction applies to the rejected like-sign pair. As a result, the unlike-sign background is slightly overestimated/underestimated by the like-sign background for large/small mass, respectively. For the second discarded cut, namely the close-partial-track cut, it was found that the gain in rejection power did not offset the decrease in efficiency, thereby, lowering the significance of the signal.
5.7.2 Double-dE/dx rejection in SDD-1 and SDD-2
The energy loss of electrons E in the SDDs can be approximated by a Landau distribution [8]:
| (5.36) |
where E and denote the most probable energy loss and the width of the distribution, respectively. For a thin detector the distribution is skewed towards high energies (the so-called Landau tail) due to the large fluctuations of the number of collisions involving large energy transfer. As apparent in Fig. 5.35, the Landau distribution describes the measured data very well, even though the observed shape is a convolution with various electronics and detector characteristics as described in [74].
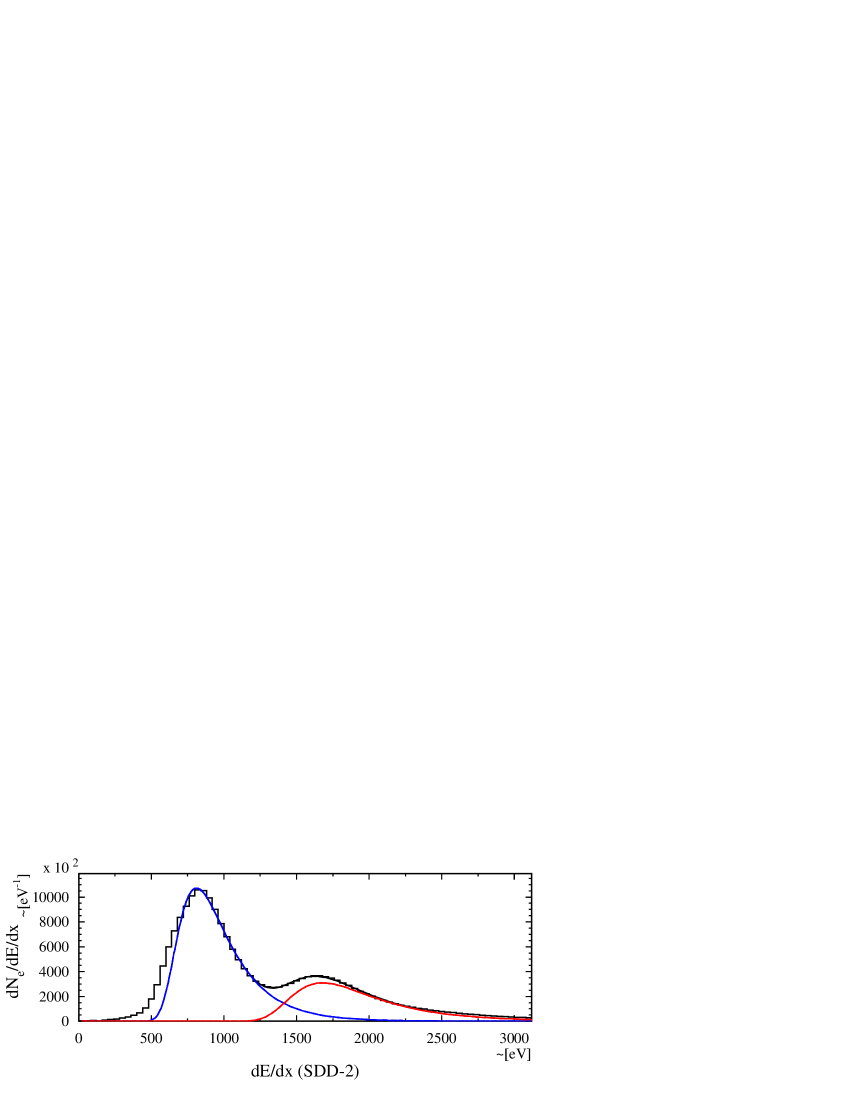
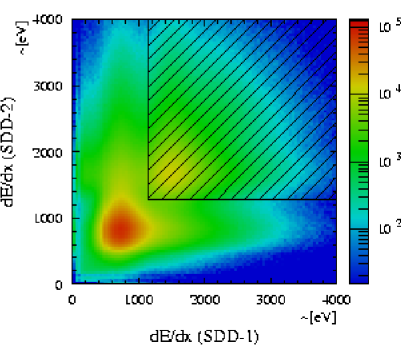
Dilepton pairs with an opening angle of less than 2.5 mrad cannot be resolved in the SDDs and therefore deposite twice the energy of a single track. The corresponding double-amplitude peak is clearly seen Fig. 5.35. The target conversions and close Dalitz pairs distinguished by their small opening angle are most efficiently rejected by a correlated cut requiring high hit amplitude in both SDDs as outlined in Fig. 5.35. In SDD-1, the pair-opening-angle range to be rejected was artificially increased by addition of the amplitude of the next closest hit in a 5 mrad range to further enhance the rejection power.
In view of the fact that in the previous analysis the double-dE/dx peak (in Fig. 5.35) was already rejected at the first stage of the data analysis, it might be conceivable that important calibrations were casuistical or simply overlooked. Most important, the so-called ballistic-deficit correction accounts for the fact that the measured number of FADC counts decreases as a function of the radial position of the hit. The radial width of the electron cloud increases with the drift time due to diffusion according to [132]:
| (5.37) |
where and D are the initial radial width of the hit and the diffusion constant, respectively. The response function of the SDD pre-amplifier depends on the width of the input signal and, therefore, the measured output signal decreases for hits at the lower radius. This effect is further amplified by fact that the amplitude threshold, applied in the hit reconstruction for the noise suppression, introduces a relative amplitude loss that is largest for hits with a large width. This implies that the SDD-hit amplitude has to be re-calibrated inasmuch as the amplitude threshold is changed.
For the previous calibration shown in Fig. 5.36 the mean hit amplitude decreases by as much as 30% towards the outer radius of the SDDs, indicating an over-correction of the ballistic deficit and the amplitude threshold effect.
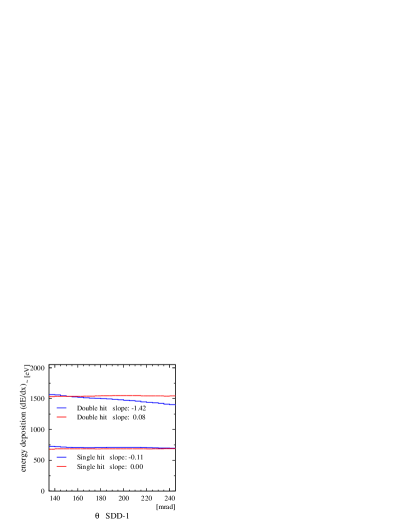
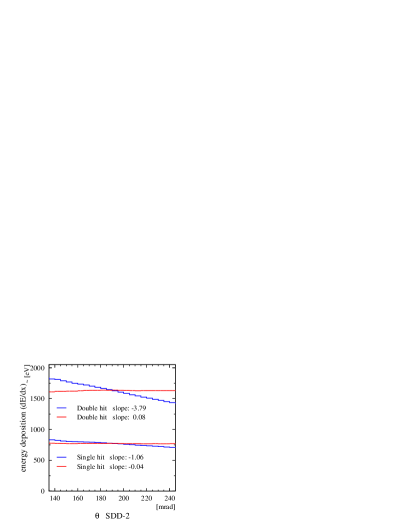
As the relative change in -direction varies also with the absolute amplitude value, the new -dependent calibration function was interpolated for hits with amplitudes between those of single- and double-amplitude hits. An additional correction factor was applied for each anode to account for small amplitude variations illustrated in Fig. 5.37.
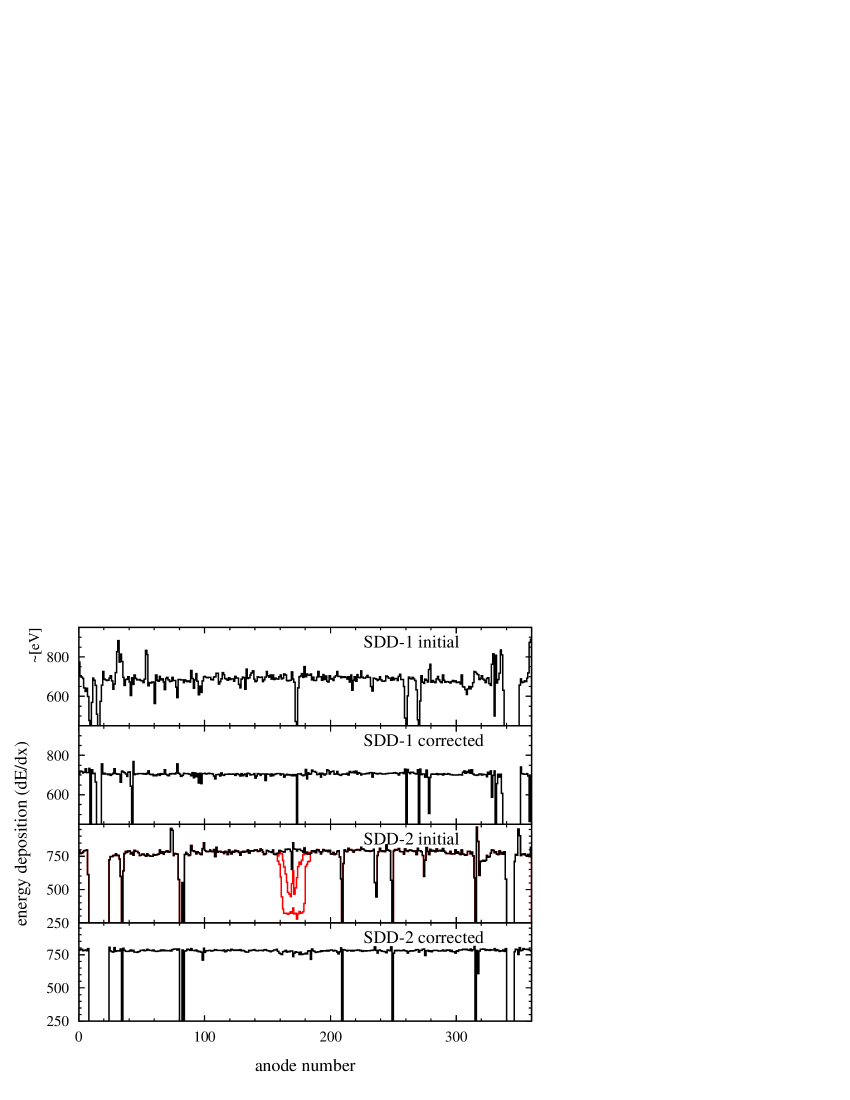
Small temperature variations of the SDD system during the 6 weeks of data acquisition altered the observed mean amplitude by up to 2% [133] and were corrected for each run.
As a result of the recalibration, the width of the Landau distribution decreased by about 30%, thereby improving the separation of single- and double-dE/dx distribution.
To optimize the cut values of the double-dE/dx rejection, a simple method solely based on the track properties was developed. In contrast to the Monte Carlo simulation used in [113], this approach sidesteps the difficulties involved in the simulation of the very complex SDD characteristics. Assuming that the amplitude distributions of single- and double-amplitude hits were exactly known, Eq. 5.7.1 could be employed to find the optimum values of the dE/dx-contour cut as shown in Fig. 5.35. First, the probability to observe a track with single or double amplitude is defined as:
| (5.38) |
Applying the cut, the probability of a single track surviving that cut defines the efficiency and the rejection power is given by the probability to reject a double-dE/dx track:
| (5.39) |
The probability that a signal pair survives the cut can be expressed in terms of the single-track efficiency as:
| (5.40) |
All combinatorial pairs containing at least one double-amplitude track are regarded as background. The probability to find such a pair is given by:
| (5.41) |
Expressing Eq. 5.7.1 in terms of Eqs. 5.38, 5.40, and 5.41 yields the optimization function:
| (5.42) |
Next, the observed dE/dx distribution of Fig. 5.35 was fitted with a two-dimensional double-Landau distribution. The fit result is shown in Fig. 5.38.
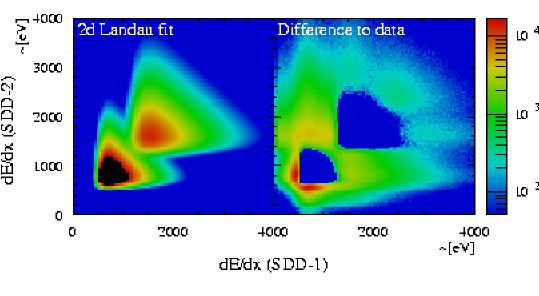
The wide peak at a double amplitude in SDD-2 and about single amplitude in SDD-1, seen in the distribution of the residual difference between the fit and the data, is obviously related to conversion decays in SDD-1. These were excluded from the fit to be treated in a separate rejection cut. Although the fit function underestimates the tails of the data distribution, it was made sure, that the most important region between the peaks of both distributions is described accurately enough and the residual does not affect the optimization.
The contours of cut values with equal efficiency and equal rejection are plotted in Fig. 5.39.
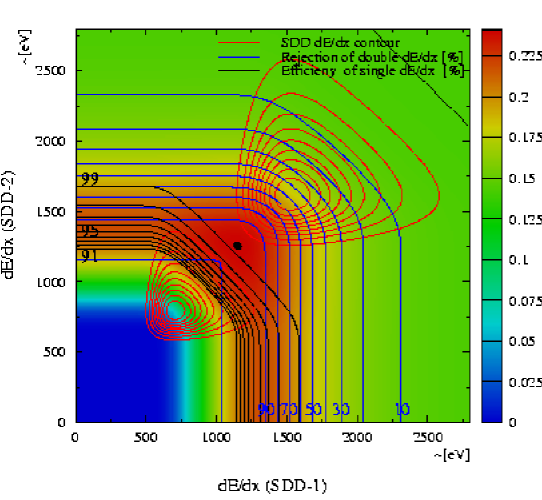
The value of the optimization function (see Eq. 5.42) also shown in Fig. 5.39 peaks at the cut values of dE/dx and dE/dx corresponding to a rejection power of about 95% and an efficiency of 99%, respectively. The maximum is relatively broad and, therefore, the significance of the signal must be insensitive to slight variations of the cut values. Applying the dE/dx rejection cut to the data improves the signal-to-background ratio by a factor of two.
5.7.3 SDD-1 conversion rejection
The main characteristics of SDD-1 -conversions are the following: a single-amplitude hit in SDD-1, a double-amplitude hit in SDD-2 or a second hit in the close vicinity, and an overlapping- or double-ring in RICH-1 detector. Therefore, the SDD-1 conversion cut rejects tracks with a double amplitude in SDD-2 (including a summation of the amplitude of the next closest hit within 7.5 mrad) and a sum amplitude in RICH-1 larger than 1550 counts. An investigation revealed that the rejection power of this cut is limited mainly by the poor separation of isolated- and overlapping-rings in RICH-1 detector (only 50% see Fig. 5.40).
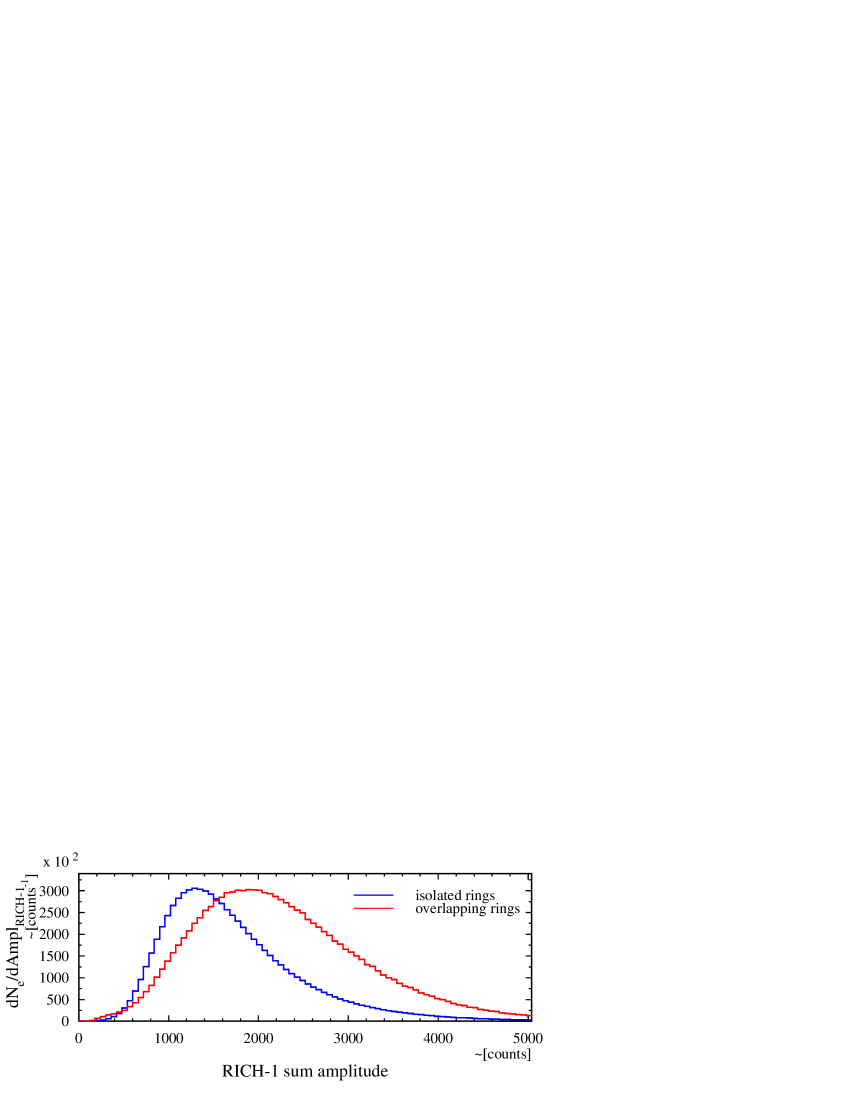
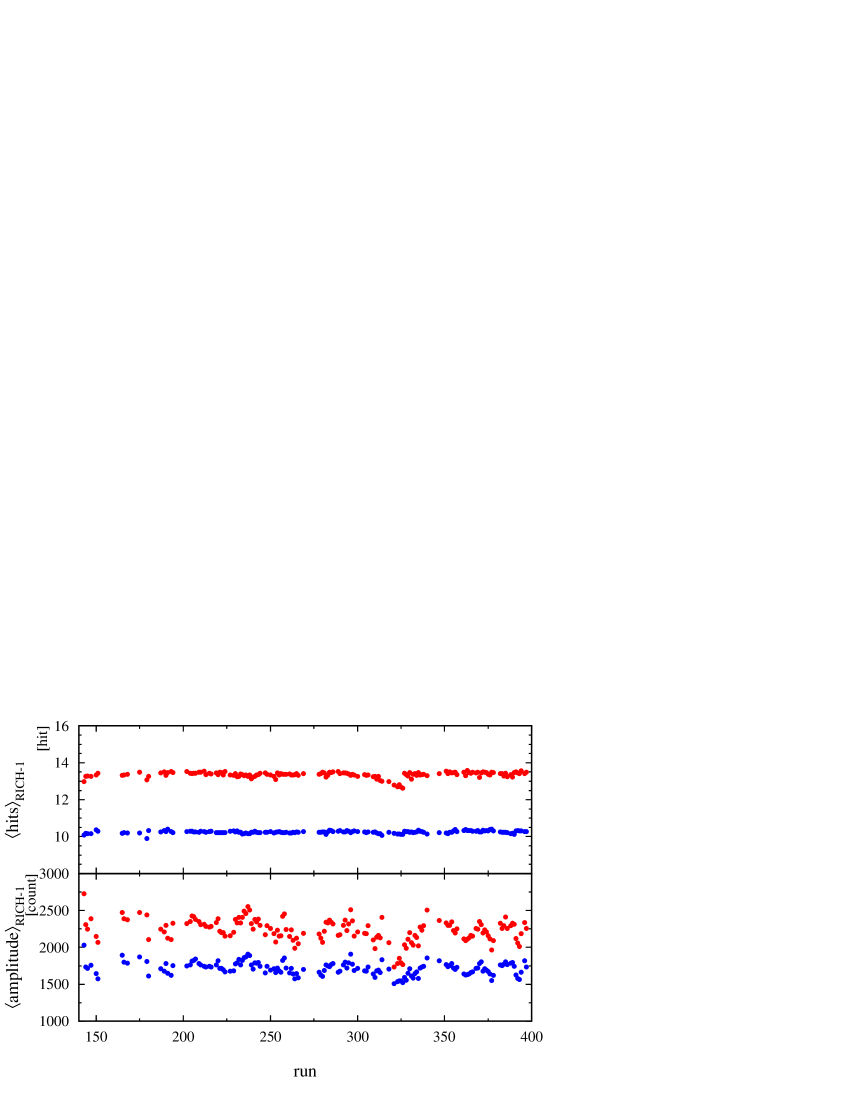
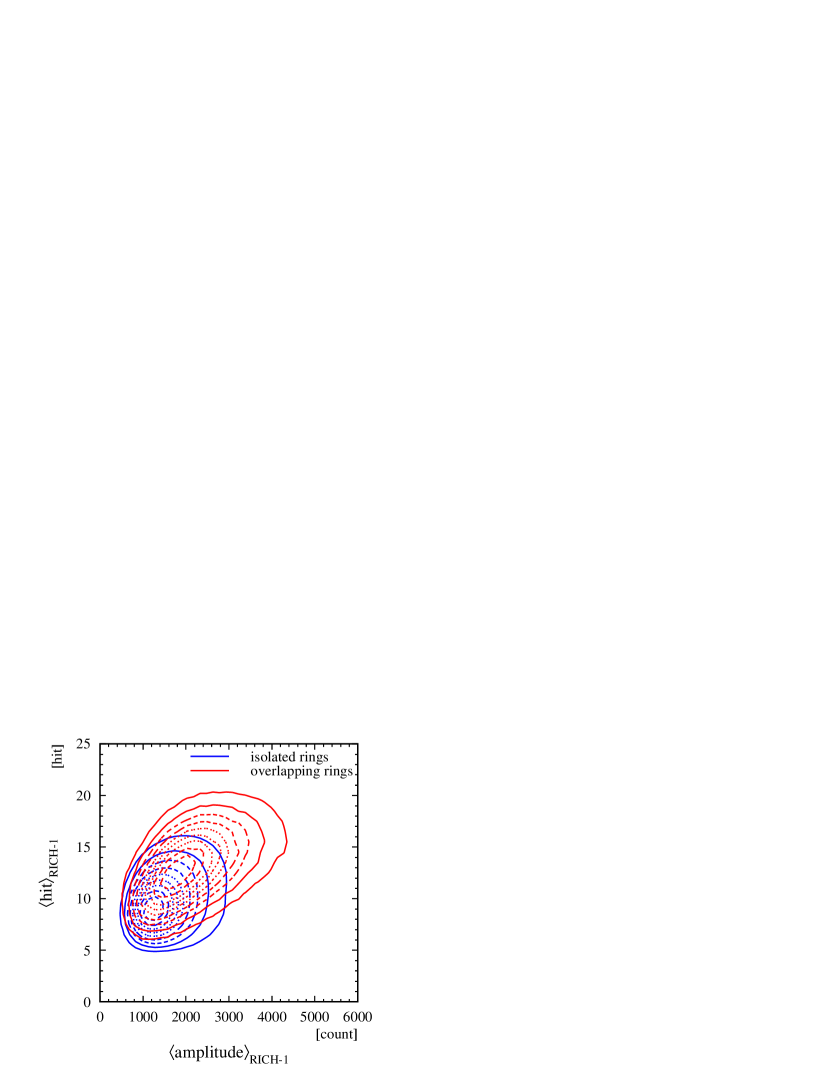
RICH-1 sum-amplitude vs. mean number of hits per ring of isolated- and overlapping-rings. Isolated rings were selected by requiring a single-track dE/dx value in both SDDs and no V-track signature in the RICH detectors (see Fig. 5.32). V-tracks exhibiting a double-track dE/dx value in both SDDs were regarded as overlapping rings.
In parts, this can be attributed to the fact that the selected double rings are indeed only partly overlapping ring with an opening angle of less than about 10 mrad. Depending on the actual center of the reconstructed ring, a certain fraction of the overlapping rings will not be covered by the summation mask, which is a ring with about 6 mrad width. A simple calculation shows the maximum sum-amplitude separation between isolated- and overlapping-rings to be about a factor of 1.7.
The mean amplitude per ring varies by 25% with time as apparent in Fig. 5.42, indicating that the gain of RICH-1 detector was not always properly readjusted to account for variations of atmospheric pressure. The mean number of hits per ring depicted in Fig. 5.42 is an alternative observable to distinguish isolated from overlapping rings. It is much less sensitive to gain variations but the separation of isolated- and overlapping-rings is equally poor. If a correlated cut including the number of hits per ring and the amplitude sum shown in Fig. 5.42 would improve the situation remains to be seen. The above described version of the SDD-1 conversion cut rejects about 60% of the like-sign background.
5.7.4 Track quality
Several track quality criteria help to reject so-called fake tracks reconstructed from accidentally matching hits and rings. A detailed description can be found in [63, 66, 113]. The cut values chosen in this analysis are largely identical to the previous analyses except for those affected by the improved SDD resolution.
Most important, the SDD-1–SDD-2 matching cut was refined to 1.3 mrad including the dependence on z-position of the event vertex [117]. The data plotted in the left panel of Fig. 5.43 shows the 15% resolution increase expected between the first and the last target disk.
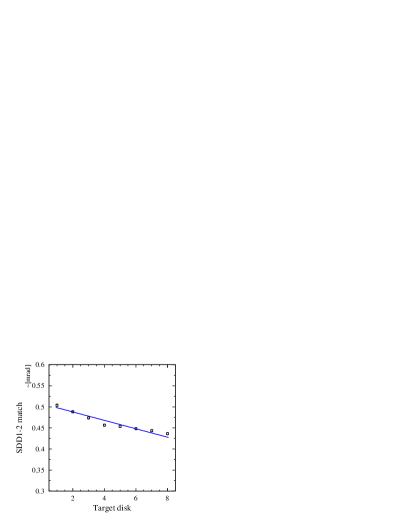
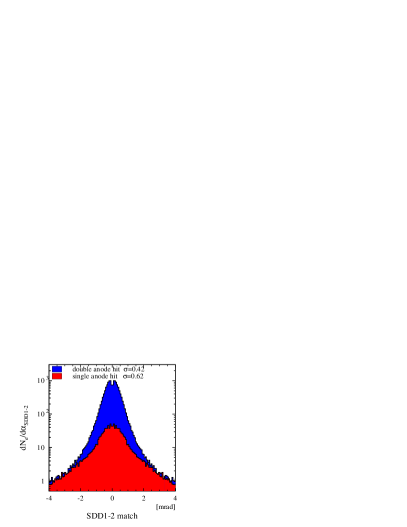
It is worth stressing that the SDD-matching cut plays an important role in the rejection of target conversions and close Dalitz decays because it acts like an opening-angle cut for partially reconstructed pairs (i.e. one SDD hit missed). The great disadvantage of this cut is to reject a substantial fraction of tracks comprising single-anode hits which exhibit a very poor matching resolution (right panel of Fig. 5.43).
The rejection of displaced artificially split hits results in a pair-efficiency loss of about 16% which cannot be recovered without sacrificing rejection power. As a result, the SDD-matching cut had to be loosened by 50% compared to the previous analysis (0.9 mrad) in order to maximize the statistical significance of the open-pair signal.
Additionally, misidentified charged pions contaminating the sample should be rejected. Considering that only pions with a momentum of more than 4.5 GeV/c produce rings in the RICH detectors, high-momentum pions are rejected by the characteristics of a small deflection in the magnetic field in combination with a smaller ring radius compared to electrons. Figure 5.45 shows that the misidentified pions can be clearly distinguish from high-momentum electron tracks.
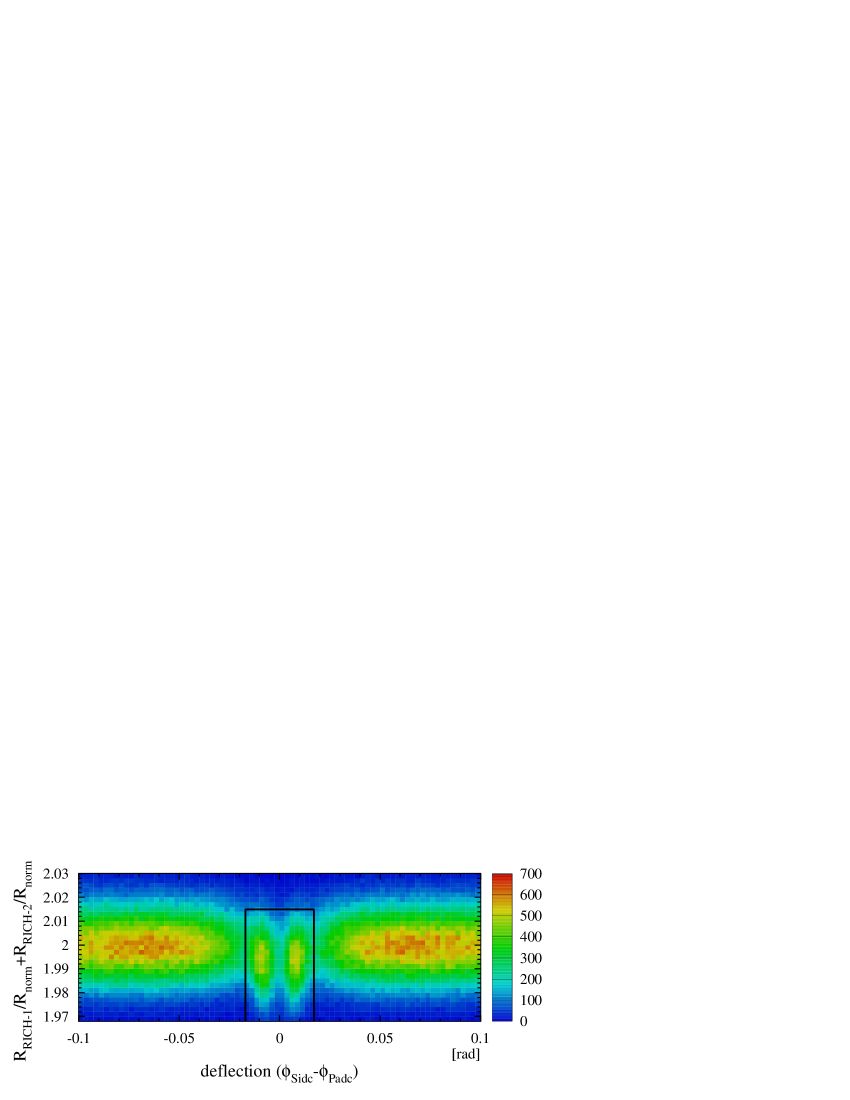
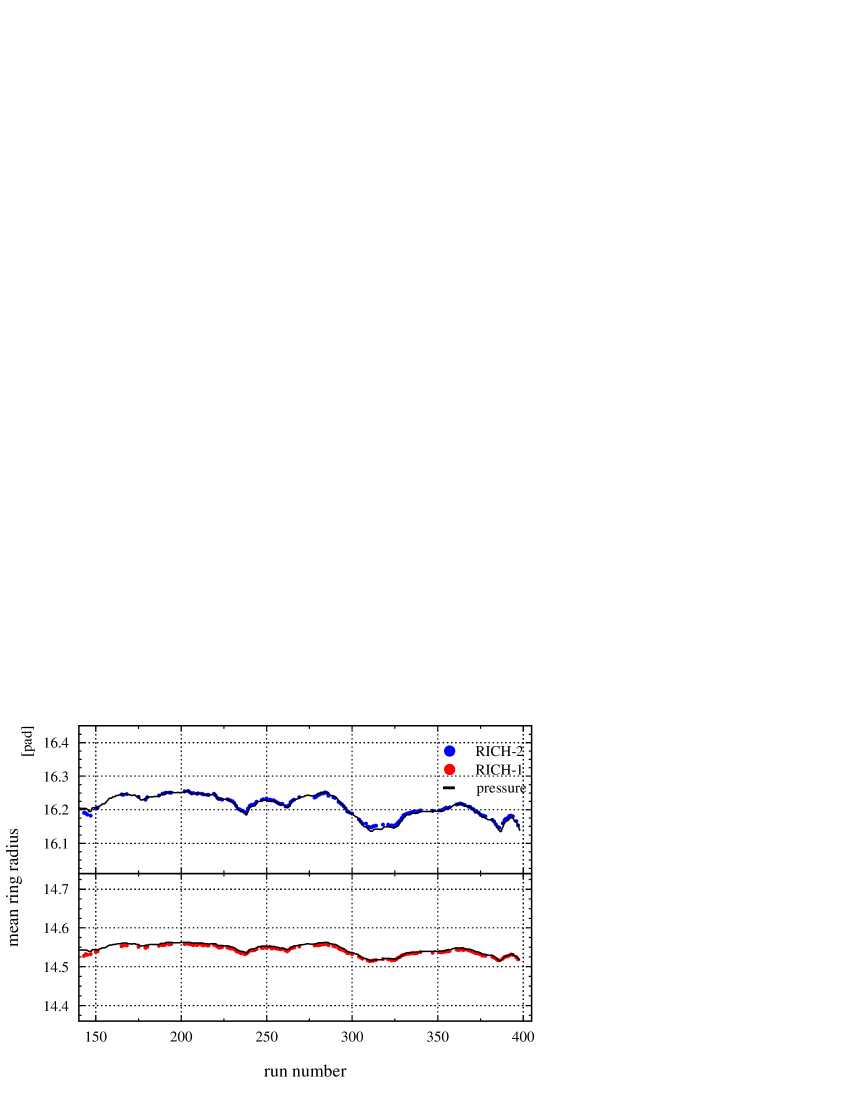
The outline of the applied cut is overlayed in Fig. 5.45.
It was noticed for the first time that the nominal ring radius in both RICH detectors changes by about 0.8% due the variation of the atmospheric pressure as illustrated in Fig. 5.45. The ratio of the measured ring radius to the nominal ring radius of both RICH detectors is added for the rejection cut, thereby amplifying the pressure dependence. If not corrected, this effect reduces the rejections power of the cut by about 12% and the reconstruction efficiency by 1.3%.
5.7.5 Detector acceptance
Table 5.3 summarizes the geometrical acceptance of the individual detectors. Even though the final pair acceptance is limited by the RICH-2 detector to the pseudo-rapidity range of 2.1 to 2.65 (corresponding to a -range of 141 to 240 mrad), the larger acceptance of the SDDs and of the RICH-1 detector is useful for the rejection of conversion and Dalitz pairs that fall only partially into the final acceptance. It is worth mentioning, that the second-order-field effect deflects tracks traversing the magnetic field towards the beam line, i.e. lower theta (see Fig. 3.5 in Sec. 3.5). The resulting momentum-dependent restriction of the pair acceptance becomes significant for tracks with a momentum of less than 150 MeV/c.
| Detector | -min [mrad] | -max [mrad] | -min | -min |
|---|---|---|---|---|
| SDD-1 | 90. | 300. | 1.86 | 3.1 |
| SDD-2 | 90. | 300. | 1.86 | 3.1 |
| RICH-1 | 141. | 290. | 1.90 | 2.65 |
| RICH-2 | 141. | 240. | 2.1 | 2.65 |
| PD | 135. | 252. | 2.05 | 2.69 |
| Combined | 141. | 240. | 2.1 | 2.65 |
The track reconstruction limits the acceptance to a momentum range of GeV/c. The lower limit is imposed by the second-order-field effect, which distorts the RICH-2 rings, and the rapidly rising probability to pick up accidental matches. The high-momentum limit results from two effects: first, the charge determination becomes ambiguous for very small deflection in the magnetic field because of the finite detector resolution and, second, the particle identification is lost due the contamination of high-momentum pions.
A further restriction of the low-transverse-momentum acceptance is the most powerful tool to reduce the combinatorial background. The transverse-momentum distribution of the most interesting vector-meson decays peaks at about 350 MeV/c while the distribution of the trivial Dalitz decays rises exponentially for small momenta as depicted in Fig. 5.46.
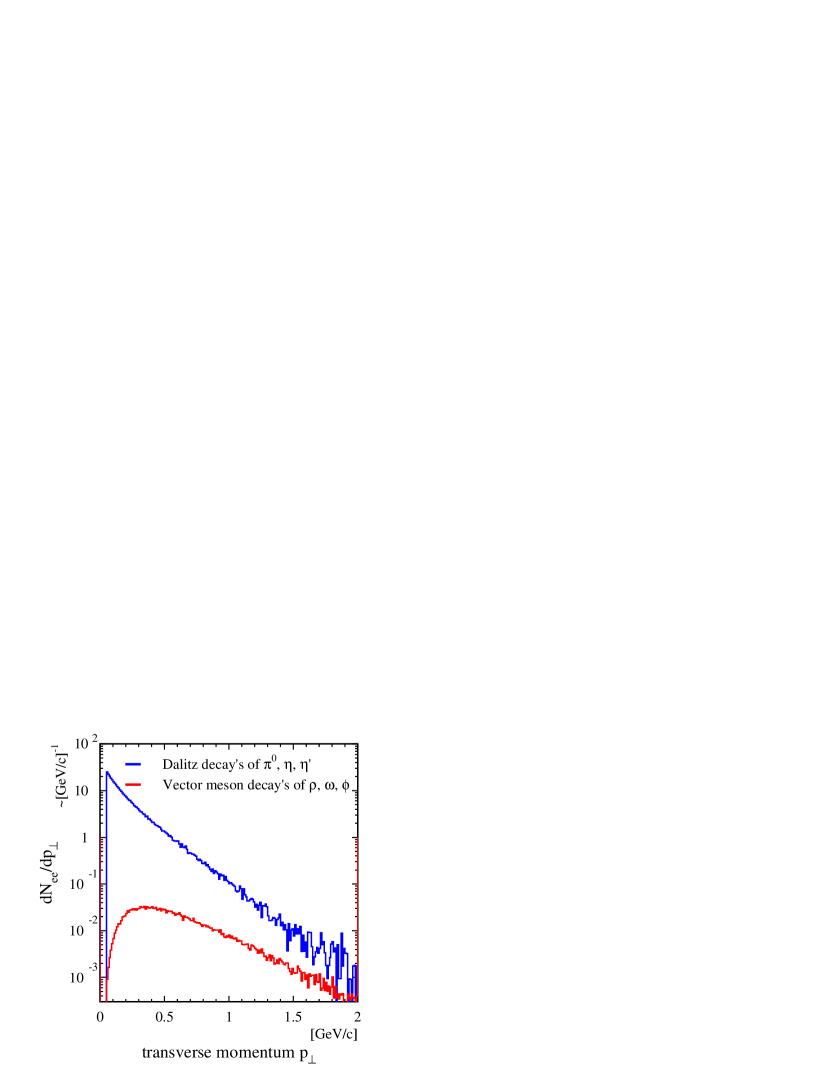
Transverse-momentum distribution of Dalitz decays and vector-meson decays included in the hadronic cocktail simulated by GENESIS [90].
The generally applied transverse-momentum cut of MeV/c rejects more than 60% of the background at a cost of less than 10% efficiency of the vector mesons. To study the low-momentum aspects of the dielectron spectrum, the transverse-momentum cut was lowered to MeV/c.
Finally, pairs with an opening angle of mrad were selected to further suppress dielectrons stemming from -conversion and Dalitz decays. According to Fig. 5.32, the opening angle of these background sources is predominately below 35 mrad.
5.8 Reconstruction-efficiency determination
The probability to observe a collision-produced dilepton is limited by the efficiency of the detection in each detectors, the track reconstruction, and the background reduction. To determine the absolute yield of dileptons, the observed number of correlated unlike-sign pairs given by Eq. 5.11 must be corrected with the actual reconstruction efficiency of each pair:
| (5.43) |
It is worth stressing that the efficiency correction of each pair cannot be generically replaced by the average reconstruction efficiency because:
| (5.44) |
In the following it is assumed, that the pair efficiency can be factorized by the single-track detection probability and a small correction factor accounting for pair correlations as is indirectly proven in the discussion of the mixed-event background in Sec. 5.6.3. In view of the careful calibration of the detector properties with respect to the pressure and temperature variations during the run time, the residual time-dependence of the reconstruction efficiency is neglected. Therefore, the pair reconstruction efficiency can be expressed in terms of the single-track phase space parameters (here , , and ) and the number of observed charged particles which is related to the centrality of the collision:
| (5.45) | |||||
There are two ways to determine the pair reconstruction efficiency. First, it can be estimated by a comparison of expected- and observed-yield of pairs with mass below 200 MeV/c2. The dilepton production in this mass range is dominated by the Dalitz decay of -, -, and ’-mesons. The yield of these contributions was measured with an accuracy of better than 10% [52, 53] and is well described by the simulation of the cocktail of the hadronic sources including the acceptance and the momentum resolution of the CERES detector (see App. A). Although this method does not allow extraction of differential pair efficiency distributions, it is reckoned as a valuable reference for the average pair efficiency.
The second option to determine the pair reconstruction efficiency is a Monte Carlo simulation of the complete detector system, including the track reconstruction and the background rejection. It involves the following steps:
-
•
simulation of a huge number of dielectrons with realistic kinetic properties according to the decays of the known hadronic sources (App. A)
-
•
use of the GEANT software to simulated the passage of the generated pairs through the CERES-detector system. GEANT simulates all particle interactions with detector materials such as multiple scattering and bremsstrahlung. The hit positions of all particles as well as their energy deposition was determined by the response function of the individual detectors taking internal physics and electronics effects into account. For the first time, the emission and subsequent tracking of Cerenkov photons included the optical properties of the RICH detectors.
-
•
embedding of detector responses obtained into the raw data of genuine events
-
•
performance of the first-stage data analysis on so-called overlay events
-
•
application of all background rejection cuts
After the last step, the differential reconstruction efficiency is determined by the probability to identify the simulated track in the vicinity of its original position in each detector.
Extensive study of this method had proven that all relevant detector characteristics are reasonably well described by the simulation [113]. Since then, the simulation was refined in many details. Small inconsistencies between the GEANT detector emulation and the Monte Carlo simulation could be resolved.
As a consequence of the modified tracking strategy and the new SDD-hit reconstruction, the Monte Carlo simulation had to be readjusted to reproduction of the distributions observed in data (see [114] for details).
A number of simulated tracks were embedded into raw data events on a one-to-one basis for the study of the single-track reconstruction efficiency. The raw events were chosen from different parts of the run time to average detector aberrations. A simulated particle was counted as successfully detected, if all hits of a reconstructed track were within a range of three times the detector resolution to the particle’s original direction. Deciding if a particle was truly lost or merely scattered is ambiguous to some extend because genuine and embedded hits cannot be distinguished on the detector level. A comparison of events, analyzed with and without an additional embedded track, showed this systematic error to be in the order of 2%. The statistical error of the expected yield of dielectons being large, a relative error of less than 10% is acceptable for the differential shape of the efficiency distribution.
The projections of the multi-dimensional efficiency function of Eq. 5.45 were plotted for following discussion. The -dependence depicted in the left panel of Fig. 5.47 is almost flat, except for a large hole at 1.3 rad. This is caused by a region of dead anodes in the SDD-2. The -dependence of the efficiency was not corrected apart from the influence of the dead anodes, as the complicated interplay of several effects is not well understood.

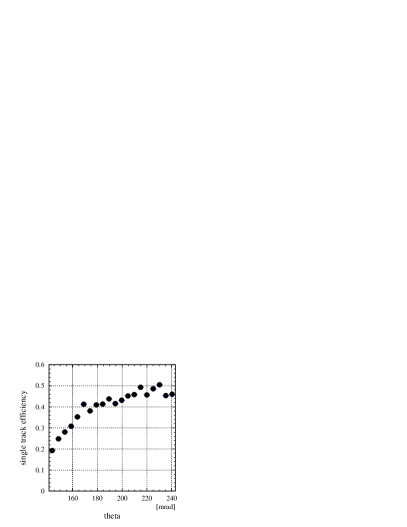
Figure 5.47 (right panel) shows the -dependence to be roughly constant above 170 mrad but to decreases by more than a factor of two towards the inner edge of the acceptance. This efficiency drop reflects the increasing hit/ring density close to mid-rapidity at 110 mrad and the decreasing number of hits per ring in RICH-2 detector. At the inner edge about one third of the area of a RICH-2 ring is already outside of the detector acceptance.
Figure 5.48 (left panel) demonstrates the reconstruction efficiency to be approximately independent of momentum for a deflection smaller than 230 mrad (i.e. GeV-1c).
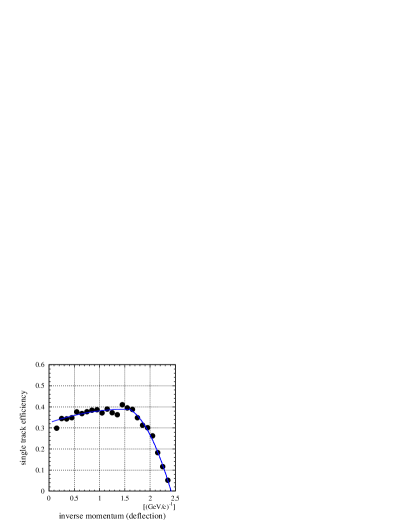
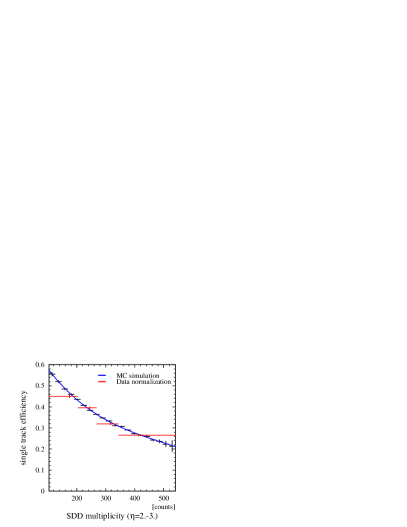
It drops rapidly towards larger deflection corresponding to 200 MeV/c, which however is only important for the 100 MeV/c selection. The slight decrease towards smaller deflection, i.e. larger momentum, can be attributed to the momentum dependence of the butterfly-shaped matching window of the tracking between RICH-1, RICH-2, and PD detector.
The efficiency of the track reconstruction additionally depends strongly on the charged-particle multiplicity as shown in the right panel of Fig. 5.48. The efficiency obtained by the Monte Carlo simulation agrees well with the values extracted with the first method, i.e. the ratio of the observed number of low-mass pairs to the expected hadronic yield of each multiplicity bin.
In general, the multi-dimensional efficiency function Eq. 5.45 cannot be described by a simple product of its single-parameter projections (i.e. , , , and ) discussed above because some of those may not be independent. In the following, the relation between the single-parameter efficiency projections is studied to find a simple representation for the reconstruction efficiency.
Given the finite detector resolution, the reconstruction efficiency of a track is subject to the density of close hits or rings in the respective detectors. The hit density is determined by multiplicity- and -distribution of the charged particles produced in the collision, comprising mostly pions. The rapidity density d/d was observed to be constant in the CERES acceptance [134]. The energy of the pions produced in Pb-Au collisions at 158 GeV/c per nucleon is much larger than their rest mass. Therefore, the rapidity of a particle can be approximated by the pseudo-rapidity which in turn depends on only on the polar angle [135]. As a result, the local hit density per unit area is given by a simple product of two functions of the charged-particle multiplicity and the rapidity, respectively. In general, it is not possible to disentangle multiplicity- and rapidity-dependence of the reconstruction efficiency accordingly because the efficiency is assumed to be a non-linear function of the local hit density. The 2-dimensional contour depicted in Fig. 5.50 (left panel) shows the efficiency to drop more rapidly at the inner edge of the acceptance. This is more clearly seen in Fig. 5.50 (right panel) - the slope of the -dependence increases with rising multiplicity. This effect has the important consequence of the pair efficiency to be increasing with large opening angles because these pairs fall only into the acceptance if both tracks are close to the upper -limit of acceptance.
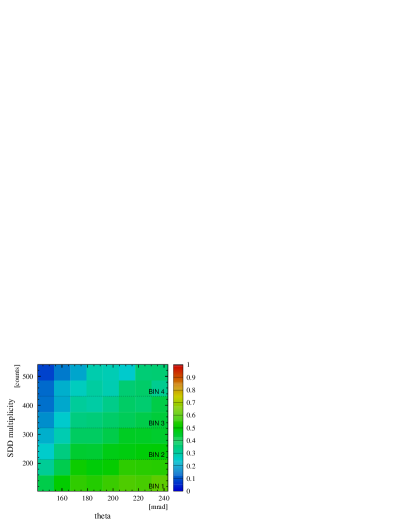
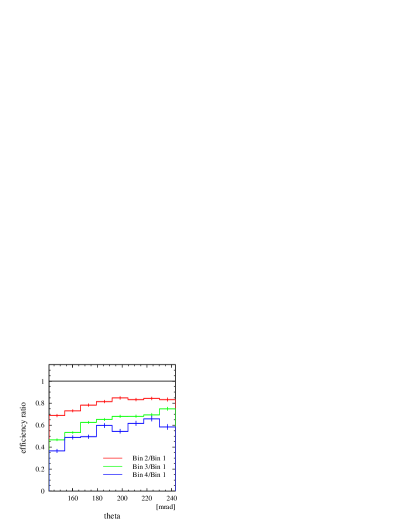


Figure 5.50 (left panel) shows the momentum dependence of the efficiency to be correlated weakly with the charged-particle multiplicity. As a result, the applied single-track efficiency correction can be decomposed as:
| (5.46) |
To investigate the residual pair efficiency (see Eq. 5.45), a number of simulated dielectron pairs, produced in and Dalitz decays, were embedded into genuine events. If two tracks were found according to the criteria mentioned above, the pair was counted as successfully reconstructed. The residual pair efficiency correction was determined as:
| (5.47) |
where was computed by Eq. 5.46.
A residual efficiency correction depending on pair properties is expected to depend at most on the pair opening angle for the case of touching or overlapping RICH rings. However, this effect shown in the right panel of Fig. 5.50 turns out to be small. This was already expected from the discussion of pair correlations in the context of the background subtraction.
The observed yield corrected for Monte Carlo pair efficiency is about lower than the expected yield of all hadronic sources of pairs with mass below 200 MeV/c2. This discrepancy is not surprising. Although the Monte Carlo method allows to study all aspects of the analysis, its benefit to the absolute efficiency determination is limited by the multitude and high complexity of the involved detector and analysis dependencies. Particularly, the RICH-ring reconstruction algorithm and the hit reconstruction in the SDD are sensitiv to marginal changes of the parameters of the read-out electronics and of the environment conditions and are obstructing an adequate description by the Monte Carlo simulation.
A solution was to correct all data first with the Monte Carlo pair efficiency to account for the differential efficiency dependencies and then to normalize the mass spectrum to the expected dielectron yield of pairs with mass below 200 MeV/c2 simulated by GENESIS [90].
5.9 Physics results and discussion
5.9.1 Results of the new analysis of the 1996 data set
Background rejection and subtraction was applied to recorded events, as described in Sec. 5.6 and 5.7. The results were a final data sample comprising 3537103 dielectrons for GeV/c2 and 1305210 dielectrons for GeV/c2, reconstructed with a signal-to-background ratio of 1:0.96 and 1:13.9, respectively. The signal refers to pairs with an opening angle larger than mrad and a minimum transverse momentum of MeV/c of both tracks. The spectrometer acceptance covers the pseudo-rapidity range of .
The resulting invariant-mass spectrum of Pb-Au collisions at 158 GeV/c per nucleon is presented in Fig. 5.51.

The pair yield plotted has been divided by the charged-particle multiplicity in the CERES acceptance. It was measured to be (see Sec. 5.5) for the larger pseudo-rapidity range of which translates into an average multiplicity of for the nominal acceptance. The spectrum was corrected for single-track efficiency as described in Sec. 5.8 and, subsequently, normalized to the expected yield from hadronic decays for GeV/c2 using the GENESIS event generator (see App. A). Comparison of observed and expected pair yield results in an average 6% reconstruction efficiency of low-mass pairs ( GeV/c2), assuming that the total yield is saturated by the contribution of known hadronic decays. This pair efficiency is 30% lower than in the previous analysis [113]. The newly implemented splitting of overlapping hits in the SDD results in an unexpected efficiency loss of pairs estimated to be 16% (see Sec. 5.3.4). The insufficient size of the matching window between RICH-1, RICH-2, and PD detector applied in first-stage analysis caused an additional pair efficiency loss of about 10% (see Fig. 5.48).
The statistical error of the signal includes the combinatorial background contribution which corresponds to the like-sign same-event background for pairs with mass below 0.35 GeV/c2 and to the mixed-event background for pairs with mass above 0.35 GeV/c2 (see Sec. 5.6.4).
Three sources contribute to the systematic uncertainties of the data: the extrapolated low-mass yield of the hadronic cocktail, the average charged-particle density , and the pair reconstruction efficiency.
Uncertainty in the low-mass yield of the hadronic cocktail arises from error of the branching ratios and relative production cross sections of , , and , as well as the error related to the parameterizations of the input distributions estimated to be about 25% in App. A.
The error of the average charged-particle density measurement results from the following factors: the accuracy of the reconstruction efficiency determined by Monte Carlo simulation, the linearity of the rapidity distribution in the range of , the beam pile-up, the production of electrons, and the run-to-run variation of the trigger threshold and of the reconstruction efficiency. All other contributions are absorbed into the error of the relative normalization to the cocktail, except the time variations. The latter is estimated to be about 5%.
The systematic error of the pair reconstruction efficiency is given by the uncertainty of the Monte Carlo description, namely: the detector response functions, the alignment of the overlay tracks to the event vertex, run-to-run variations of the gain in the UV detectors, and run-to-run temperature dependent changes of the SDD and RICH detector properties. As the data is normalized to the low-mass yield of the hadronic cocktail, the uncertainty in the pair reconstruction efficiency affects the results via its variation with invariant mass. This contribution is estimated to be about 10%.
The combined systematic uncertainty of the absolute yield is about 40%. It was verified that this value is in accordance with the systematic error estimated by the change of the dielectron yield with respect to small variations of the rejection cuts. The yields of pairs with mass above MeV/c2 obtained from independent analyses of the two data sets of opposite field direction agree with each other within the limit of the statistical error: and for positive and negative B-field, respectively.
Following previous analyses, the data is compared to the expected yield of hadronic decays as simulated with an improved version of the GENESIS event generator (see App. A). The hadronic cocktail was folded with the experimentally measured spatial and momentum resolution. Note, that for all previous CERES publications, the predicted yield is 30% too low for GeV/c2 due to a heretofore unnoticed computing problem within GENESIS (see App. A).
The most striking feature of Fig. 5.51 is the large excess of observed dielectrons with respect to the contributions of the hadronic decays. Starting at an invariant mass of about twice the pion mass, the data begins to deviate from the cocktail encompassing all the range up to the resonance. For even higher mass the statistical error of the data becomes large, but the observed spectrum seems to concur with the expected decay contribution of the -meson. Integration of the measured yield of pairs with mass above MeV/c2 renders a relative enhancement by a factor of (stat.)(syst.) with respect to the expected hadronic cocktail.
In [71, 113], a strong increase of the dielecton enhancement was reported for small transverse pair momentum ( GeV/c). However, the statistical significance was limited due to the transverse-momentum cut of MeV/c imposed on single tracks. To verify and substantiate this remarkable observation, the data analysis was extended to very low momentum tracks with MeV/c for the first time. This extension also made possible the study of a previously inaccessible region of phase space.
The net signal increases dramatically for a lower transverse-momentum cut of MeV/c: (stat.) and (stat.) for GeV/c2 and GeV/c2, respectively. The signal-to-background ratio, however, deteriorates by almost a factor of two to 1 : 1.74 and 1 : 36 for low-mass and high-mass pairs, respectively. Figure 5.52 shows the efficiency corrected dielectron invariant mass spectrum for MeV/c.

Compared to the MeV/c spectrum, the abundance of low-mass dielectrons, mostly stemming from and Dalitz decays, increases by a tenfold, while the high-mass region of the spectrum remains little affected. The observed excess relative to the hadronic cocktail is similar to the MeV/c selection, as expected for an inclusive spectrum. Integration of the measured yield above GeV/c2 gives a relative enhancement factor of (stat.)(syst.).
Study of the multiplicity dependence provides insight into the dielectron production mechanism. For pairs originating from the decay of hadrons in the final state the yield must scale linearly with the number of particles produced upon freeze out of the fireball. Dielectron production, resulting from annihilations in the hot and dense hadron gas formed in the early stages of nuclear collisions, is expected to increases quadratically with particle density [136]:
| (5.48) |
Other proposed collision scenarios involve a scaling behaviour characterized by values of [137] or [46] for the dependence on charged-particle multiplicity.
The 1996 Pb-Au data sample, encompassing a centrality range of the top 32% of the geometric cross section, was divided into 4 multiplicity bins of equal statistics as shown in Fig. 5.18 of Sec. 5.5. The upper panel of Fig. 5.53 shows the invariant mass spectrum measured for each multiplicity bin.
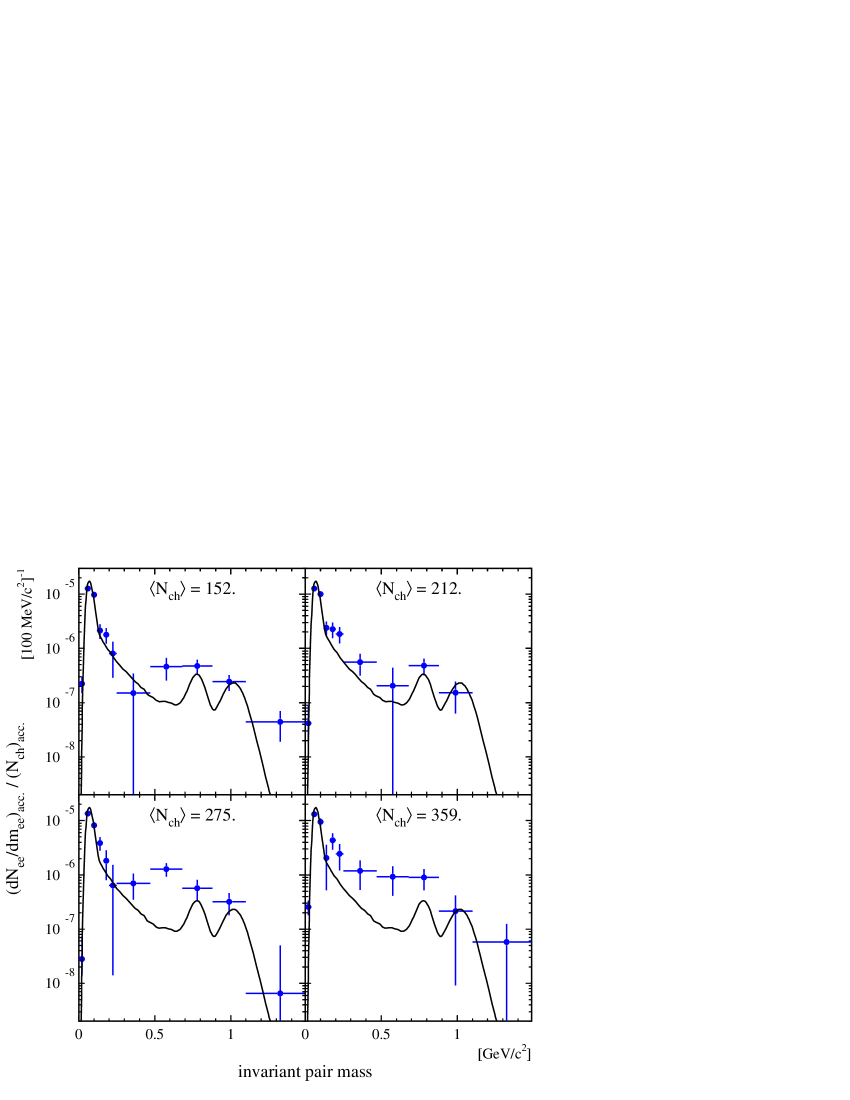
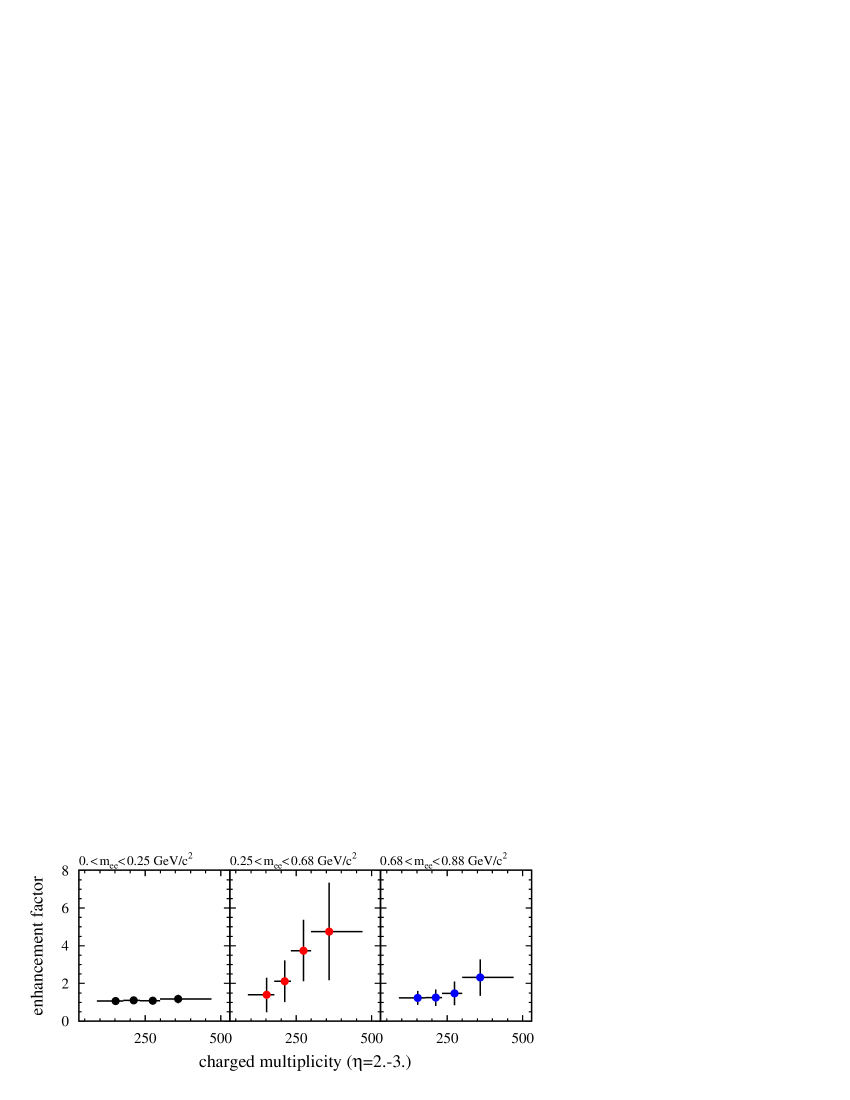
The dielectron yield exhibits a strong increase with multiplicity for the mass range of 200–700 MeV/c2 indicating a non-trivial origin of the enhancement.
To illustrate this dependence more clearly, the relative enhancement factor defined as the ratio of the dielectron yield to the hadronic cocktail is plotted in the lower panel of Fig. 5.53 for three invariant mass bins. The enhancement factor stays constant for pairs with mass below 250 MeV/c2 as expected for dielectrons originating from , , and Dalitz decays. The linear increase (), apparent for the mass range of 250–680 MeV/c2, provides strong evidence for two-body annihilation processes as the major source of the observed pairs. Again, an almost constant enhancement factor is observed for pairs with -meson mass and above, typical of final-state hadron decays. The mass spectra including very low momentum tracks with MeV/c display the same feature (see Fig. 5.54), even though the conclusion of a non-trivial origin of the enhancement is less compelling due to the large statistical errors.
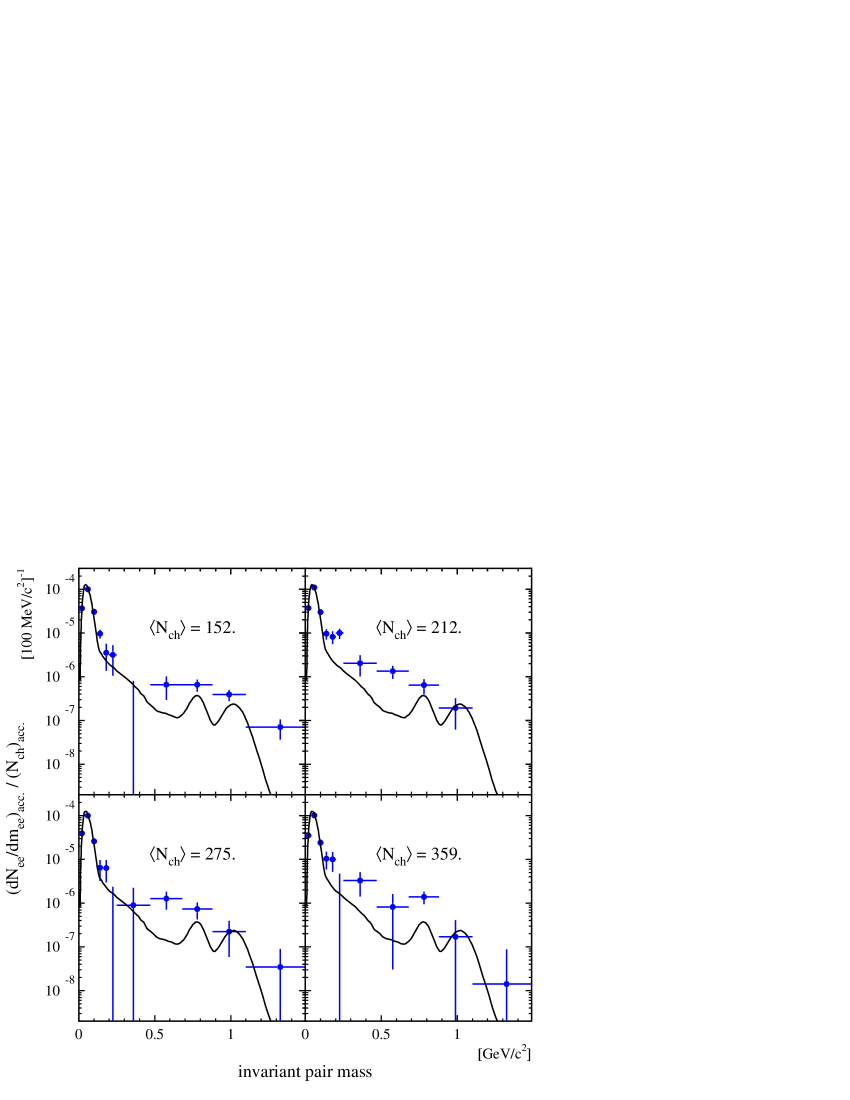
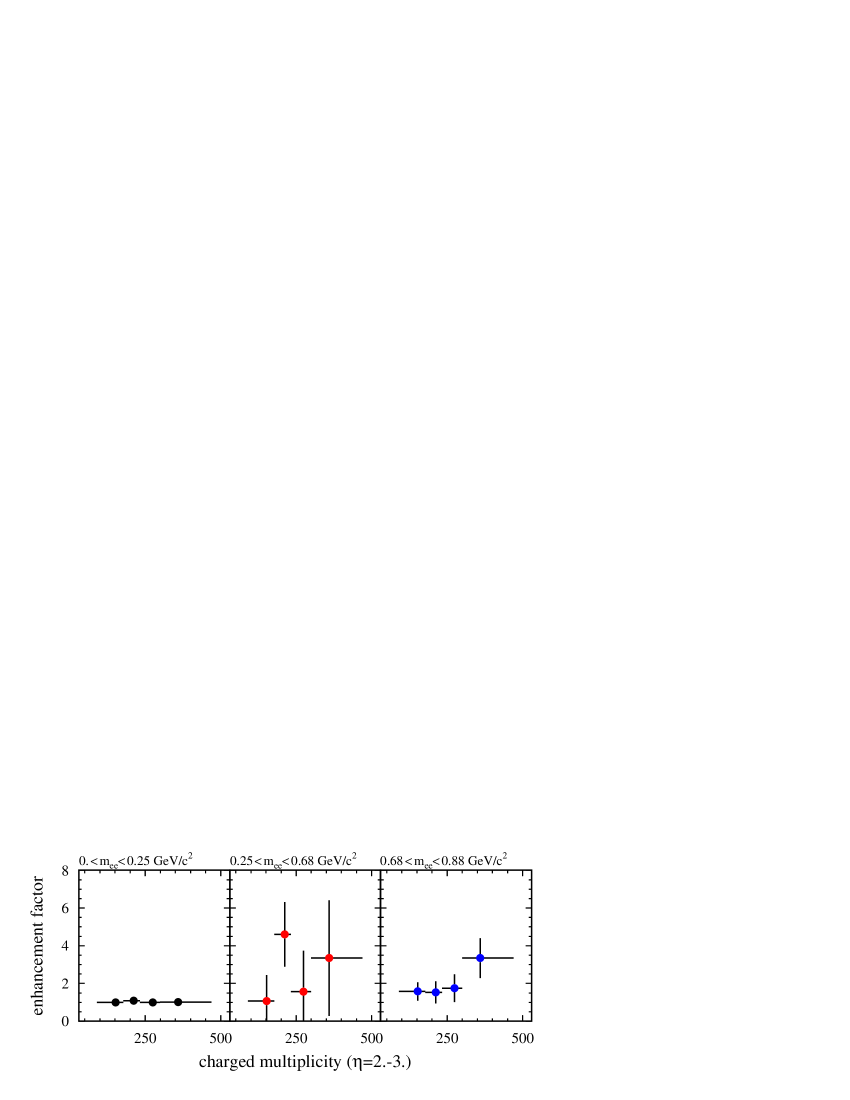
The dielectron transverse momentum , i.e. the total momentum of the pair perpendicular to the beam axis of the colliding nuclei, is an additional observable for discrimination of different production mechanisms. Figure 5.55 presents a comparison of the measured lorentz-invariant spectra with the hadronic cocktail for three invariant mass bins.
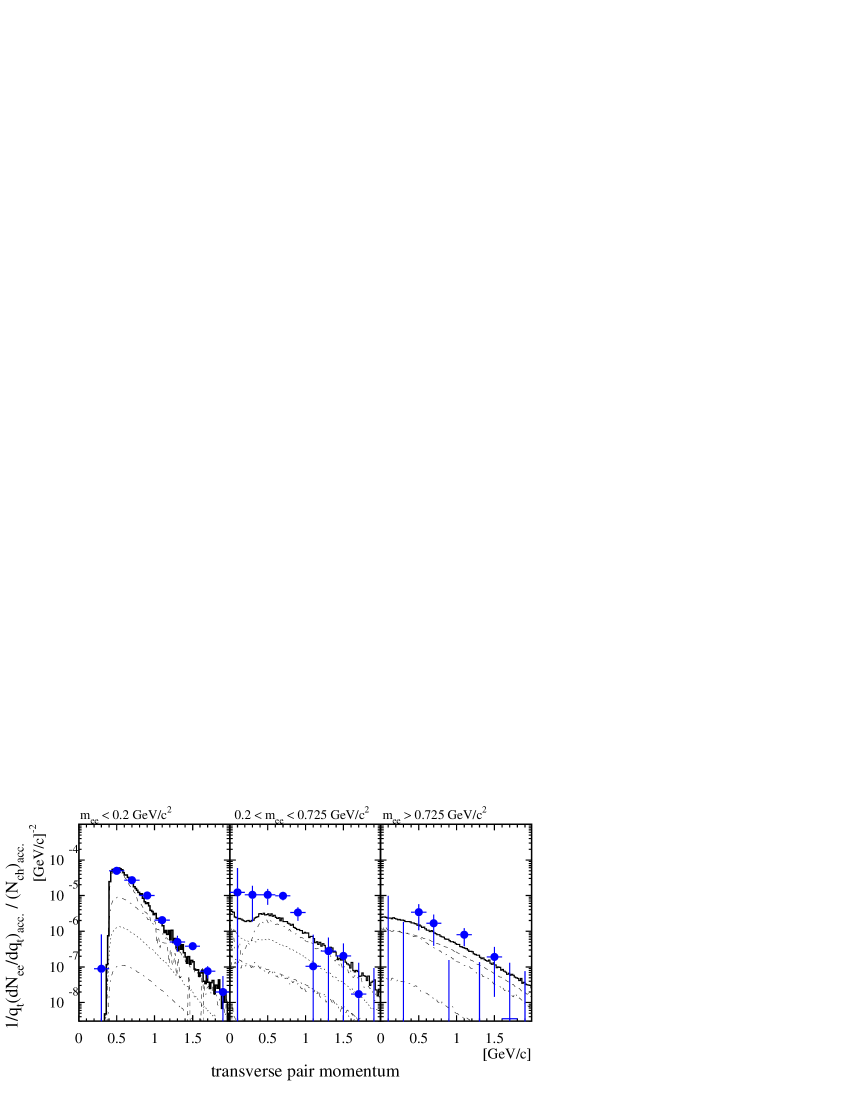
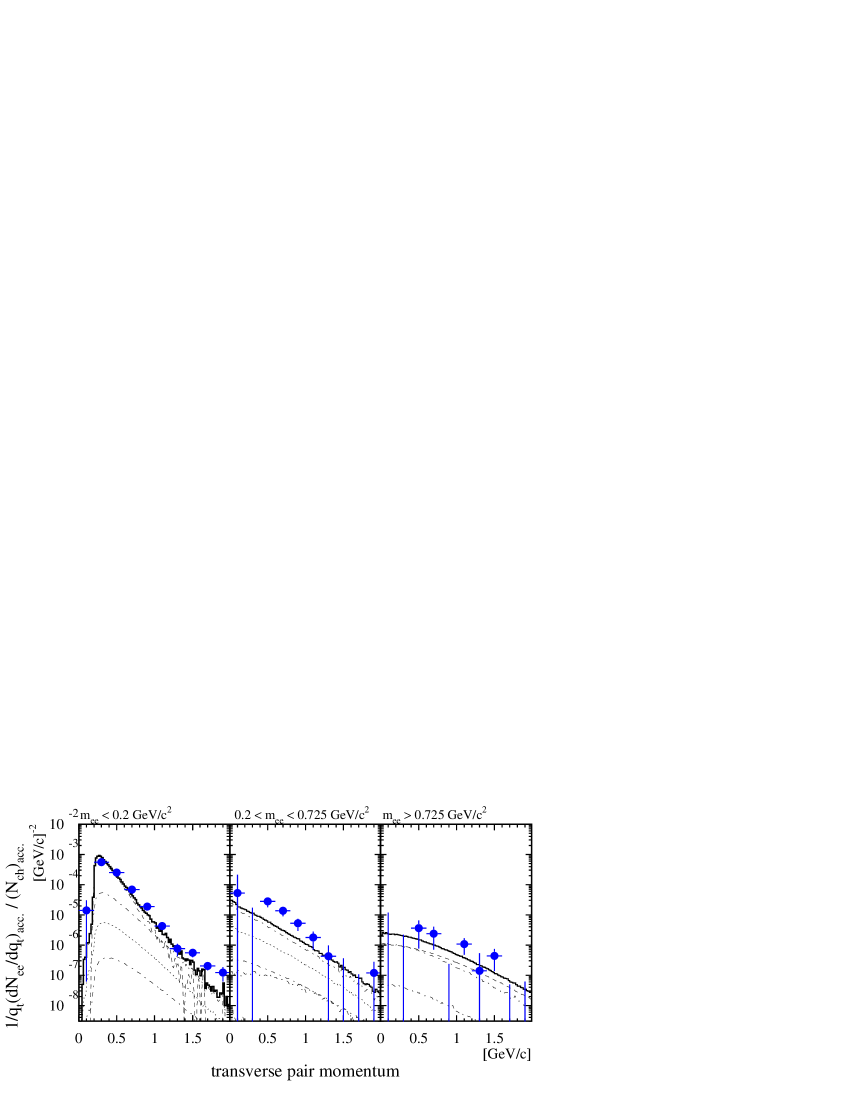
Inspection of the mass range of 200–725 MeV/c2 reveals that the excess is most pronounced for small transverse pair momenta below 1 GeV/c. Most interesting, the limitation of the pair acceptance by the MeV/c cut, as apparent from the dip of the cocktail spectrum at small , is also visible in the data. Given that the excess persists for the extension of the acceptance towards smaller transverse momentum ( MeV/c), it cannot possibly be related to a deficient understanding of the pair acceptance of the spectrometer. No significant deviations from the hadronic cocktail are observed for pairs with lower/higher invariant mass.
For an alternative representation the invariant mass spectrum is presented separately for transverse pair momentum below and above 500 MeV/c. Both spectra plotted in Fig. 5.56 are distinctly different.


The difference between the data and the hadronic cocktail becomes more pronounced for the MeV/c selection - now extending up to the resonance, while the excess is largely reduced for MeV/c - but still significant in the mass region of 500–680 MeV/c2. It is worth stressing that the spectrum for MeV/c is greatly improved by the reduced transverse-momentum cut of MeV/c. Integration of the MeV/c data sample above 250 MeV/c2 invariant mass produces an enhancement factor of (stat.) and (stat.) for MeV/c and MeV/c, respectively.
5.9.2 Comparison to other CERES results
In this section, the results presented in Sec. 5.9.1 will be discussed and compared to the results of previous CERES studies of Pb-Au collisions at 158 GeV/c per nucleon [71, 80, 113, 138].
The most prominent observation of a strongly enhanced dielectron production for invariant mass above 200 MeV/c2 was confirmed by this re-analysis. A collation of all measurements in Fig. 5.57 shows the observed dielectron yields to be consistent within the statistical errors.

The observed yield [71, 126] exceeds the expected contributions of hadronic sources by ca. a factor of 2.5 for mee MeV/c2. As expected, the dielectron yield measured at different stages of the analysis does not depend on the signal-to-background ratio.
The important discovery of a stronger than linear rise of the dielectron production rate with multiplicity was substantiated for the mass range of the largest enhancement (0.25–0.725 GeV/c2). The level of agreement is remarkable given the fact that this new analysis was based on a completely different background subtraction technique, an improved tracking strategy, and a refined efficiency determination.
The following detailed comparison is focused on the latest and most advanced previous study [113] which also served as a starting point of this paper. Subjecting the invariant mass spectra plotted in Fig. 5.58 to direct comparison reveals differences that need to be addressed.
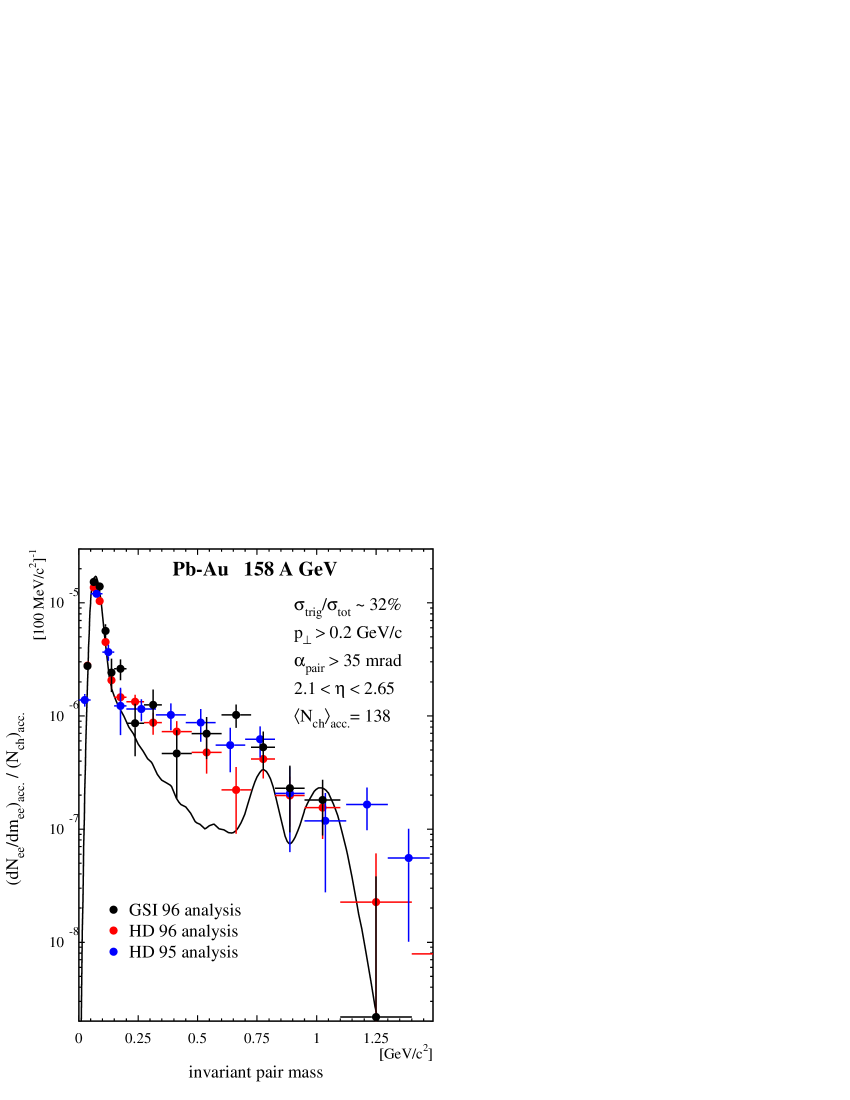
First, the spectra differ by about 35% for low-mass pairs ( MeV/c2). This is because the efficiency used to correct the data in the previous analysis was obtained from a Monte Carlo simulation while in this study the spectrum was normalized to the expected yield at the peak ( MeV/c2). The resulting discrepancy is still within the range of the systematic error of both measurements. The results for pairs with larger mass agree well with each other except for the data points at (650) MeV/c2. The apparent differences are statistically significant. The previous analysis presented in [113] and this paper are based on the same data set; therefore, the observed discrepancy is a measure for the systematic error of the analysis.
Second, the statistical errors plotted are larger for the new analysis because of the lower reconstruction efficiency, but similar to those of the old analysis before applying the background smoothing which involved a certain level of subjectiveness in the choice of the best background fit function.
The factorization of the and efficiency dependence and the 2.5% offset in the momentum determination result in a systematic error of the old analysis which is small compared to statistical uncertainties.
Figure 5.59 (upper panel) compares the transverse pair momentum spectra for MeV/c.
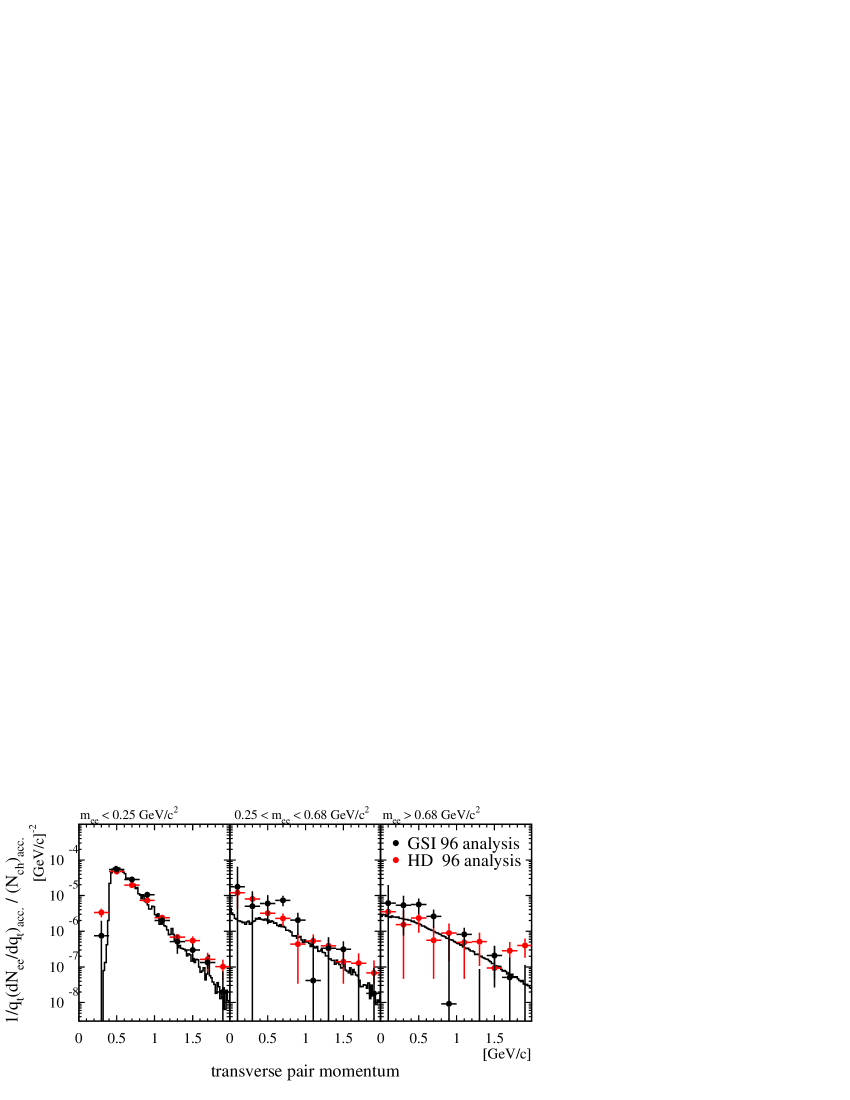
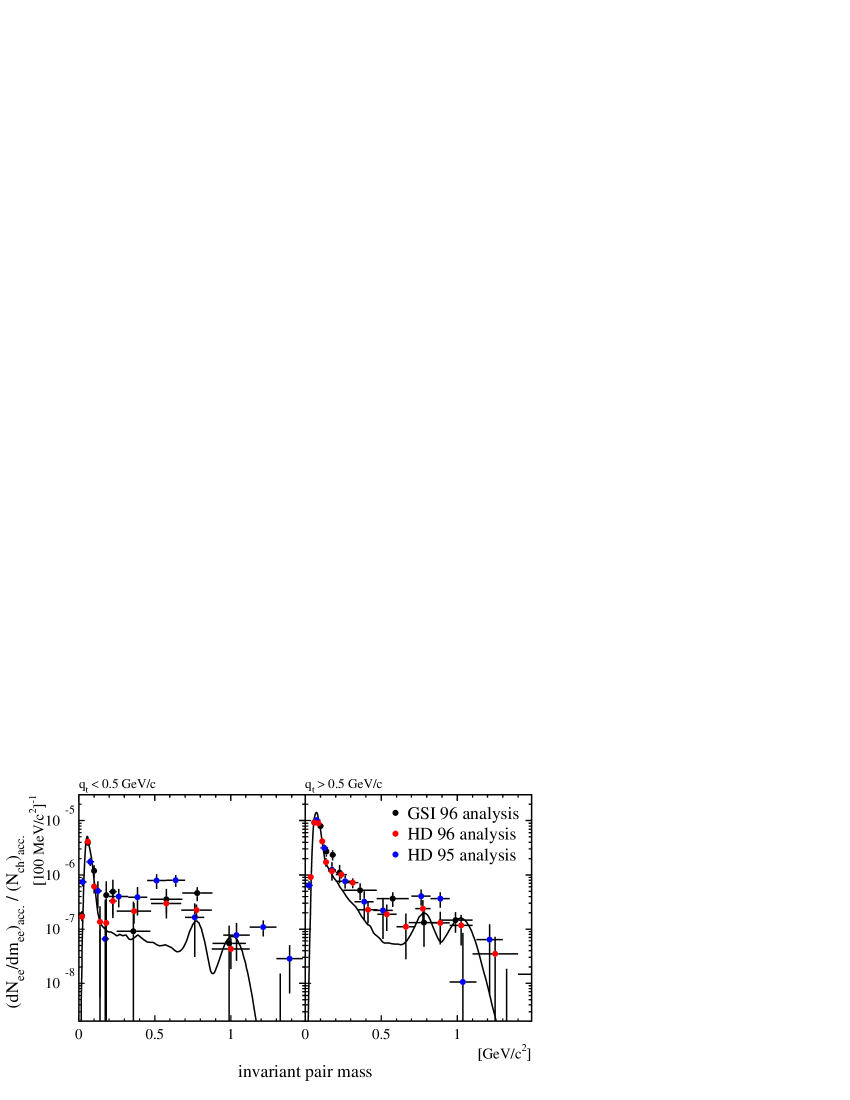
In contrast to the previous analysis, an excess is already observed for a pair momentum of about 1 GeV/c in the mass region of 200–725 MeV/c2 which is even more pronounced for the MeV/c sample. The difference is most likely an artifact of the factorization of the - and -efficiency dependence. In central collisions, where the largest excess is observed, factorizing underestimates the slope of the efficiency dependence (see Fig. 5.50). Therefore, tracks at small theta are suppressed and tracks at large theta are enhanced. Consequently, the pairs contributing to the excess are artificially enhanced for very low transverse pair momentum and suppressed for larger transverse pair momentum.
5.9.3 Theoretical interpretations
In Sec. 5.9.1, it was demonstrated that the hadronic cocktail does not suffice to explain the observed dielectron yield. The stronger than linear rise of the enhancement with the number of charged particles in the final state points to a two-body annihilation process. The high abundance of pions at SPS energies makes pion annihilation the most likely explanation. In a hot and dense hadronic medium, the annihilation process is subject to modifications induced by interactions with surrounding hadrons and/or partial restoration of chiral symmetry as set out in Sec. 2.1. The system spends most of the time in its hadronic phase, even though evidence was found for a phase transition in Pb-Au collisions to a quark-gluon plasma [2]. The expected contribution from quark-quark annihilation is very small compared to conventional sources of dielectrons [139].
A complete description of dilepton production in heavy ion collisions requires modeling of the time evolution of the collision system. In general, theoretical collision models can be divided into hydrodynamical approaches [140, 141, 142, 143], transport models [144, 145, 146, 147, 148], and thermal fireball models [149, 150, 151, 152]. The main advantage of hydrodynamical simulations is the capability of incorporating phase transitions in a well defined way via the equation of state. In contrast, transport models are better at the implementation of rescattering and absorption processes. The phenomenological fireball models allow for simple comparison of underlying microscopic models.
To explain the CERES dielectron data of nucleus-nucleus collisions, various options were proposed including Brown-Rho scaling [19, 153, 154, 155], collision broadening of the -meson spectral function [156, 149], open charm production [157], chiral meson mixing [158, 159, 160], quark-quark annihilation [148], and thermal plasma radiation [161]. A recent review can be found in [21].
The recent version of the thermal fireball simulation by Rapp [162] was chosen as a representative model to compare to the experimental results. It is generally recognized as a comprehensive and reliable simulation of the dilepton production in heavy ion collisions. Several scenarios of in-medium modifications for the annihilation process are among the specifics of the model used. The time evolution is treated in a thermal fireball approach. The experimentally determined initial conditions ( = 190 MeV, = 2.55), the hadro-chemical freezeout ( = 115 MeV, = 0.33), as well as a finite pion chemical potential are included.
Figure 5.60 compares the inclusive invariant mass spectrum for GeV/c with three different theoretical scenarios.
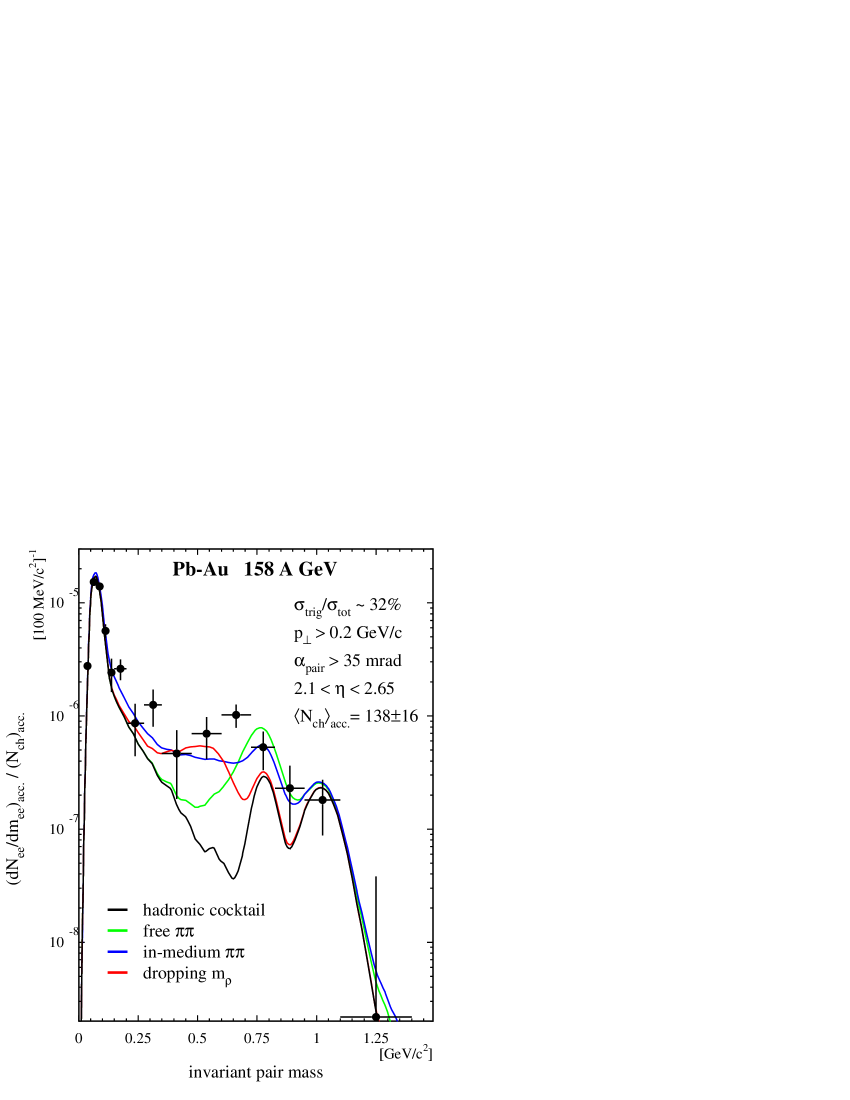
First, the annihilation with vacuum spectral function gives too much yield at the -peak and hardly fills the hole between = 0.2–0.7 GeV/c2. It can be concluded that in-medium modification must play an important role.
Second, the dropping mass scenario according to Brown-Rho scaling (or Hatsuda-Lee sum rules) fits much better to experimental data but underestimates the observed yield at the peak of the free vacuum -meson. This scenario entails a reduction of the -meson width as well as a sharp threshold at twice the pion mass for the onset of the enhancement. Brown-Rho scaling is based on phenomenological implementation of the restoration of chiral symmetry in the framework of an effective field theory. In this case, the dependence of the in-medium mass on temperature and density is given by:
| (5.49) |
with , MeV, and (QCD sum rule estimate).
Third, both and properties are modified in the medium due to rescattering (collisional broadening of the spectral function). The resulting spectrum is very similar to the dropping mass scenario for mass below 600 MeV/c2. However, more strength is expected at the vacuum -meson peak resulting in a better agreement with the data. The ingredients of this model are chiral reduction [49], many-body calculation of the -meson spectral function [149], rhosobar excitations on thermally excited baryon resonances, and a complete assessment of mesonic contributions.
Both the dropping mass scenario and the in-medium broadening give reasonable account of the dielectron enhancement in the 0.3–0.6 GeV/c2 region. This is true also in the case of extension of the acceptance to single track GeV/c as apparent from Fig. 5.61.
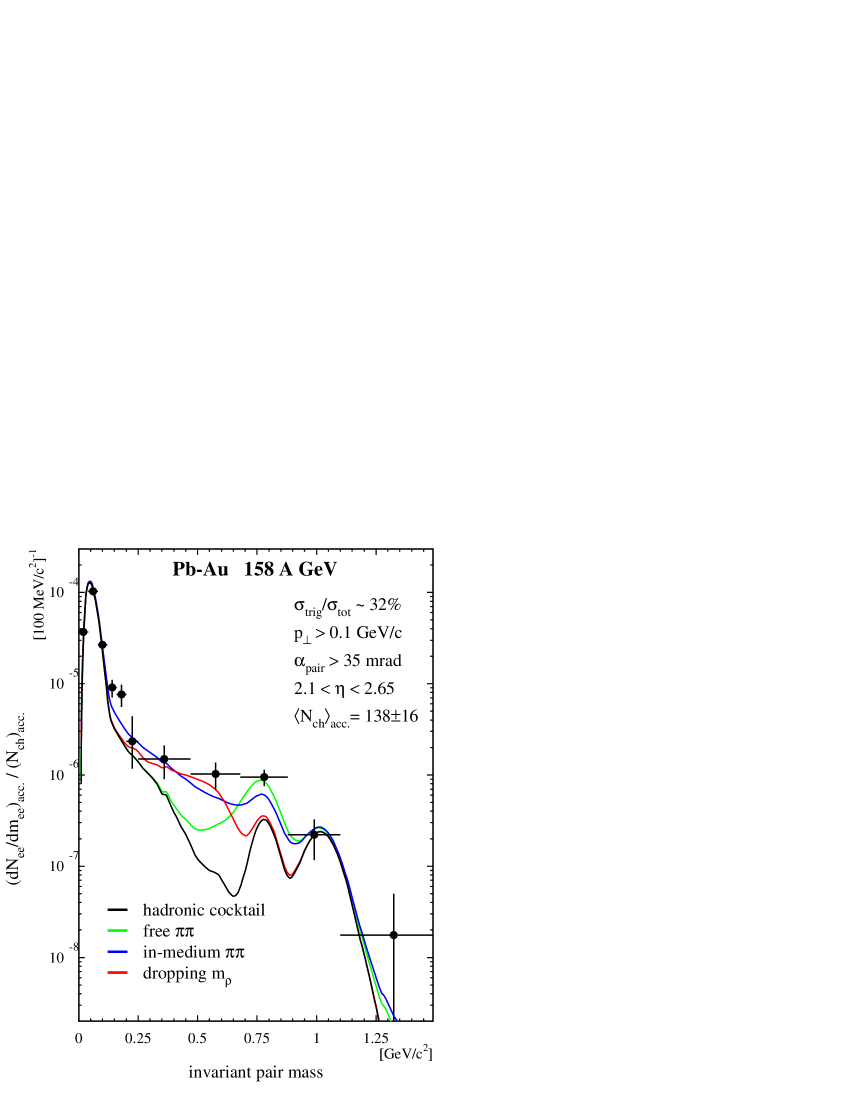
Again, the scenario of in-medium broadening of the spectral function seems more plausible.
Although the first CERES data for the centrality dependence of the mass spectrum was presented several years ago, no systematic theoretical calculations are available yet.
Figure 5.62 compares the invariant mass spectrum for two distinct transverse pair momentum selections with model calculations.
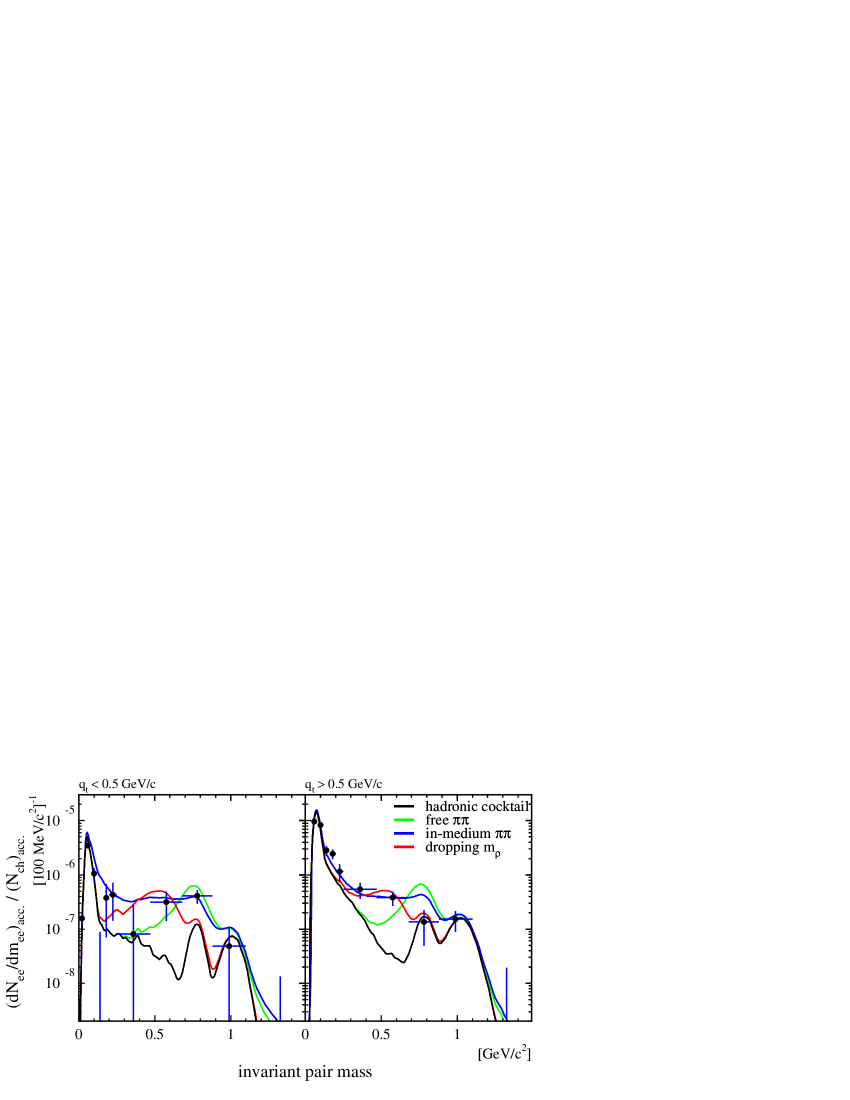
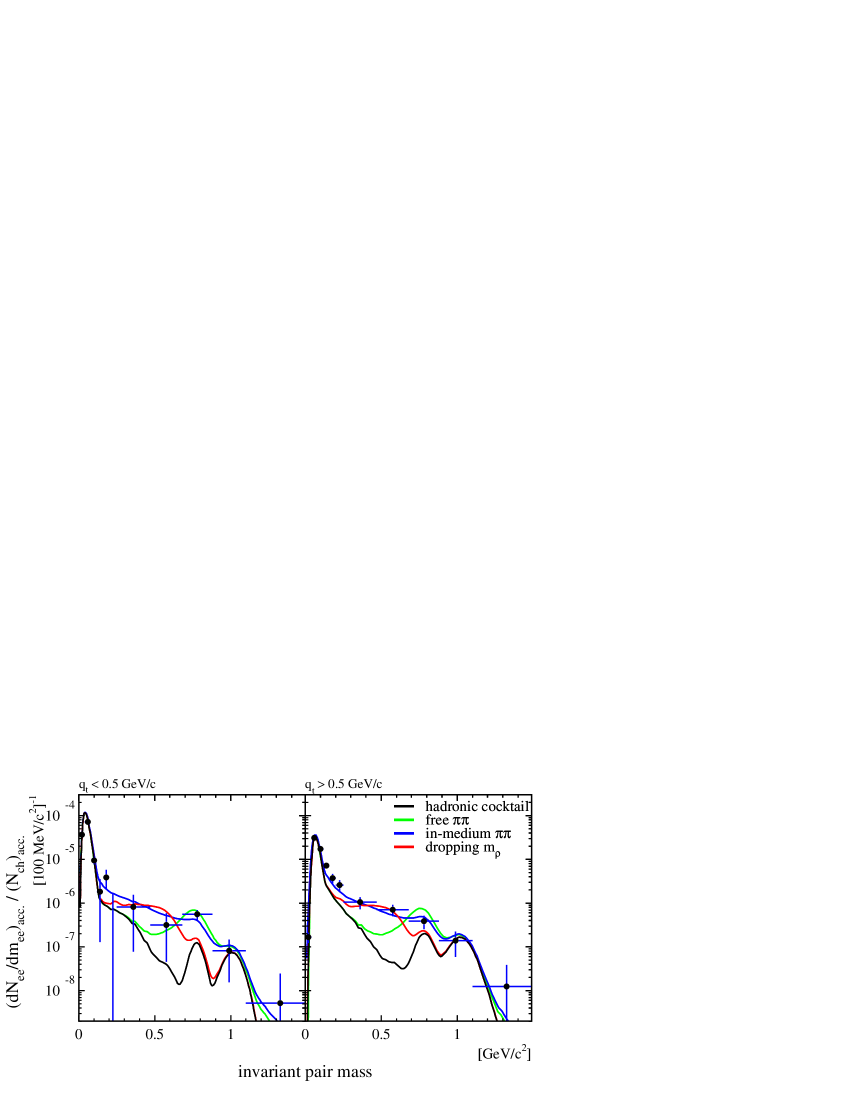
The free scenario without in-medium modifications clearly fails to account for the increase of the dielectron yield for low transverse momenta.
The observed transverse-momentum dependency can arise from the fact that Lorentz invariance is broken in the thermal frame. Therefore, the in-medium propagator, describing the dynamics of the meson, can depend on energy and momentum separately. Transverse and longitudinal modes emerge as polarization states that are no longer isotropic. Moreover, the thermal occupancy is sensitive to a reduction of the -meson mass:
| (5.50) |
The three-momentum dependence becomes more pronounced for smaller in-medium mass. It leads to a relative enhancement of the -meson for small three-momenta or equivalent small .
Although the model predictions for the dropping mass and the collision broadening scenario differ significantly in this particular representation, the large statistical errors of the data do not permit to distinguish both. The apparent difficulties of both scenarios to account for the large yield observed at the free vacuum -peak could also point to an underestimation of the -contribution which is not well determined so far.
Finally, a comparison of the transverse momentum spectra for 0.2 GeV/c with the model calculations is presented in Fig. 5.63.
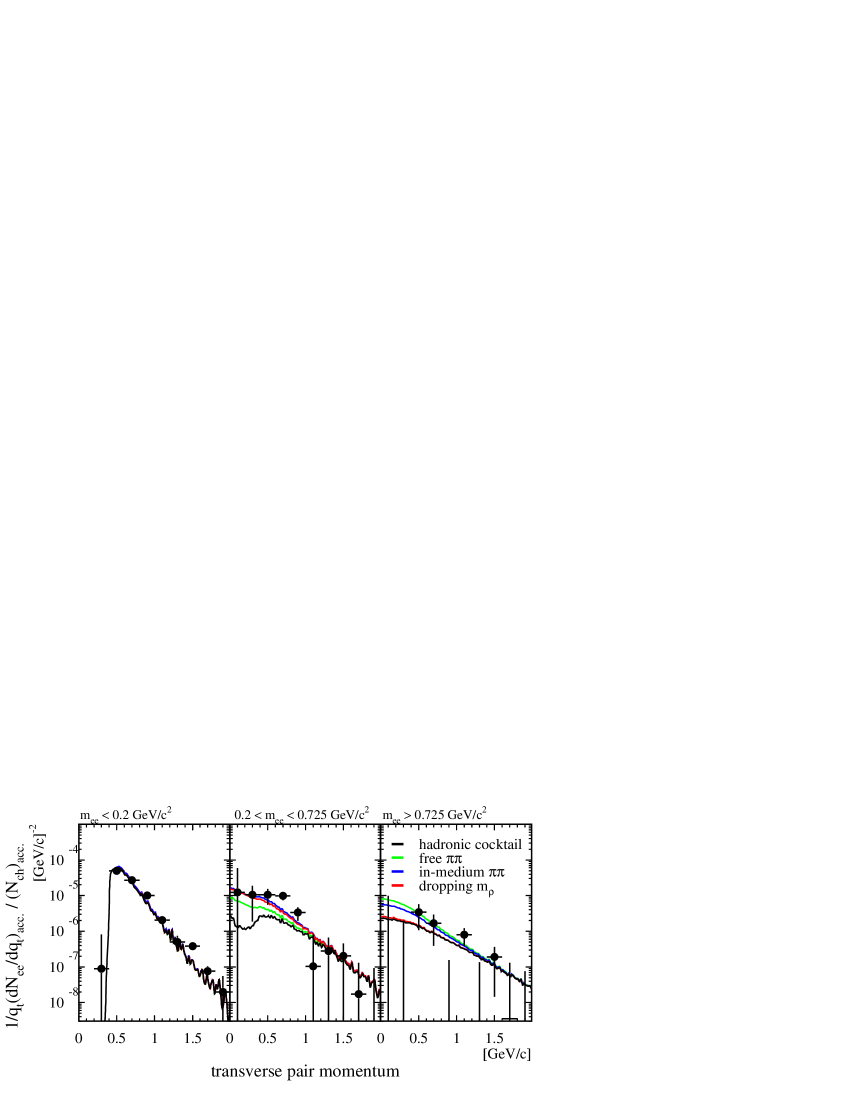
To conclude, the present data excludes the most simple scenario with vacuum -mass. The statistical errors, however, do not permit to distinguish the two approaches which include in-medium modifications.
The difference between both models is most evident in the region of the -resonance, namely a factor of two. Excluding one or the other with a confidence level of 96% would require a relative statistical error of less than 10(15)%. To achieve this level of accuracy for the central Pb-Au collisions recorded in 2000 would require a signal-to-background ratio of larger than 1:5(1:10) assuming a realistic pair-reconstruction efficiency of 22%. This is a very challenging task but the reduction of the systematic errors, i.e. multiplicity and efficiency determination, to same level of accuracy might prove even more difficult.
5.10 Summary and outlook
The most important result of this new analysis of the dielectron production in Pb-Au collisions at 158 GeV/c per nucleon is the independent confirmation of the previous result: a significant excess of dielectrons observed in the mass range of MeV/c2 compared to the expected yield of hadronic sources. In the same mass region, there is evidence for a stronger than linear rise of the yield with charged-particle multiplicity. The transverse-momentum spectra show an enhancement for the transverse pair momentum below 1 GeV/c that increases towards small . The contribution of very low momentum pairs, i.e. single-track momentum of MeV/c, was studied for the first time. It was found that the excess increases towards small transverse pair momentum. The use of the mixed-event technique for background subtractions has ruled out the possibility of artifacts of the same-event background subtraction as a source of the dielectron enhancement. The refined calibration of SDD and RICH allowed a better rejection of the combinatorial background. However, this improvement was partially cancelled by a 30% efficiency loss due to new software for SDD-hit reconstruction and tracking.
The comparison with theoretical model calculations shows that the observed dielectron yield cannot be explained by the known hadronic sources including contributions from free pion annihilation. Indeed, only scenarios invoking in-medium modification of the - and/or -meson can account for the observed yield as well as the spectral shape. Both the dropping mass and the collision broadening scenario are viable for the present data, even though the second option seems more plausible.
A precision measurement of the yield and spectral shape of the heavy vector mesons is indispensable to distinguish the different scenarios. It requires a high statistics data sample combined with a much better momentum resolution. The upgrade of the CERES experiment with a radial TPC is expected to fulfill both requirements. First studies [68] achieved a momentum resolution of for the reconstruction of -mesons. Further improvements are expected after a refined calibration of the TPC.
In the fall of 2000, the upgraded CERES experiment was operated with a very good performance. A sample of central Pb-Au collisions at 158 GeV/c per nucleon was recorded. The progress made so far promises to fulfill the high expectations for a precision measurement of the low-mass dilepton spectrum.
Other regions of the nuclear matter phase diagram will be explored by experiments measuring dilepton production in heavy ion collisions, most notable HADES [82] and PHENIX [163]. Hopefully, the combination of all results will soon allow to conclude about possible restoration of chiral symmetry in hot and dense nuclear matter and its relation to the QGP phase transition.
Appendix A New GENESIS event generator
The GENESIS event generator [71, 90, 113, 164, 165] is a tool to simulate the relative abundance of dielectrons produced by hadron decays in proton-proton (pp), proton-nucleus (pA), and nucleus-nucleus (AA) collisions. The invariant mass range covered by the CERES acceptance ( GeV/c2) is dominated by the decay of light scalar and vector mesons comprising , and [8]. Open charm production is negligible [157]. To create this so-called hadronic cocktail, pA and AA collisions are treated as a superposition of individual nucleon-nucleon collisions. The hadronic cocktail provides a reference for the comparison with the yield observed in pA and AA collisions. Any deviations would indicate a violation of the scaling behaviour and/or in-medium effects.
The simulation requires prior knowledge of the differential production cross section, the widths of all decays including dielectrons in the final state, and a description of decay kinematics for all relevant particles. Differential cross sections are unknown for most light mesons (except , , and ). The absolute meson yield of pA collisions can be inferred from measurements in pp collisions at comparable impact energies (for a compilation see [53]).
Proton-nucleus Collisions are modeled by a superposition of nucleon-nucleon collisions and the yield thereof is assumed to scale with the mean charged-particle multiplicity of a collision system. The relative cross sections () for Pb-Au collisions are taken from a thermal model [166]. The model describes particle production in heavy ion collisions accurately, as demonstrated in Fig. A.1.

The cross sections and branching ratios contained in GENESIS are summarized in Table A.1.
| Particle | Decay | (p+A) | (Pb+Au) | |
|---|---|---|---|---|
| 1 | 1 | |||
| 0.053 | 0.085 | |||
| 0.065 | 0.094 | |||
| 0.065 | 0.069 | |||
| 0.065 | 0.069 | |||
| 0.0033 | 0.018 | |||
| 0.009 | 0.0078 |
For comparison with experimental data, the cocktail is divided by the total number of charged particles within the nominal detector acceptance. It is directly related to number of produced neutral pions via the ratio = 0.44 [90].
The properties of the parent particles are determined by transverse momentum and rapidity distribution. The kinematic distributions of pions were measured by WA98 [167, 168], NA44 [169], and NA49 [170]. The transverse-momentum spectrum of charged pions by NA44 was used to extrapolated the transverse-mass spectrum by WA98 towards small transverse mass including the additional contribution of the decay. The parameterization is documented in [90]. The inverse slope parameter of the NA44 transverse mass spectrum changes by about 5% with centrality. This dependence is not yet implemented in GENESIS and, therefore, contributes 5% to the inherent systematic error. WA98 quotes a systematic error of 10% for pairs with transverse mass above MeV/c2. The systematic error of the combined spectrum is estimated to be about 10%.
The transverse-mass distributions of all other mesons are described by exponential distributions. The inverse slope parameter T increases systematically with particle mass (see Fig. A.2) as a result of collective flow. It is parameterized as:
| (A.1) |
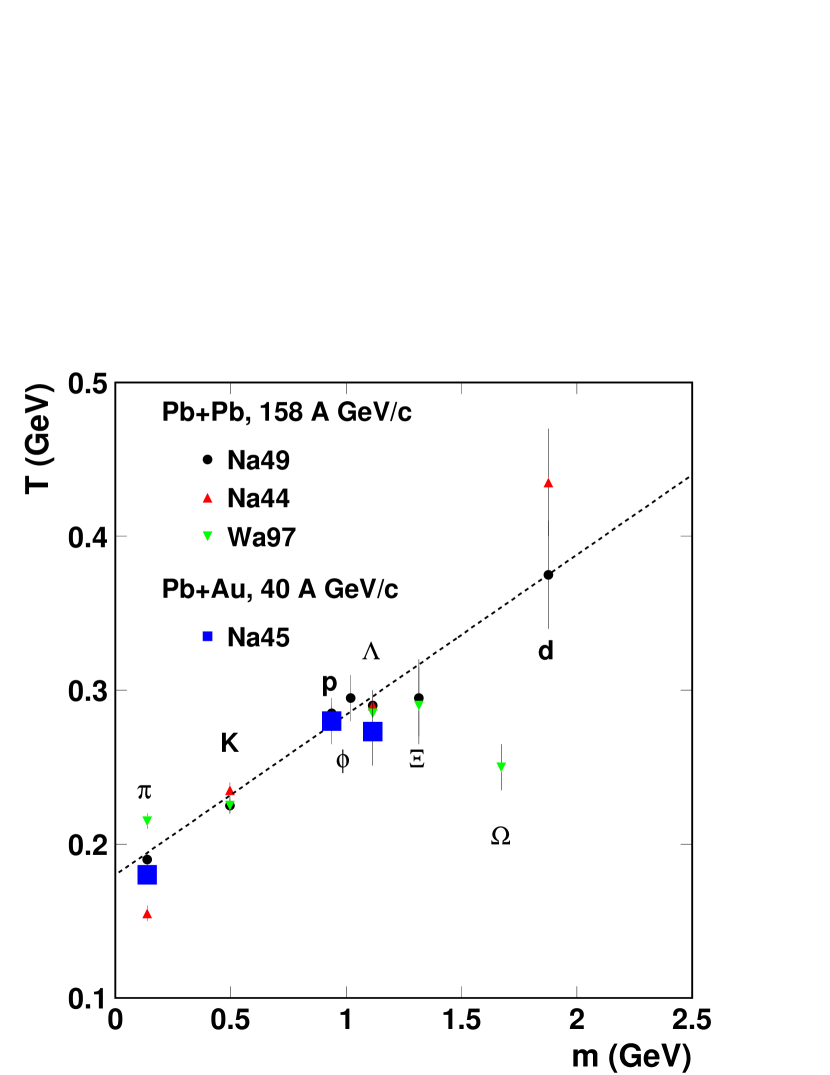
Inverse slope parameter fitted to hadron spectra from central Pb-Pb collisions at the SPS [170, 171, 172, 173, 174, 175, 176].
The rapidity distributions are assumed to resemble those of the negative hadrons measured by NA49 [170]. The width is adjusted according to the maximum kinematic rapidity limit.
The cross section is factorized for calculation of the final decay kinematics into a contribution of a QED point source and an form factor F describing the internal structure of the meson:
| (A.2) |
The shape of the form factors are based on the measurements of the Lepton-G collaboration and theoratical model calculations. An extensive summary of all relevant form factors is presented in [90]. According to the detailed discussion of the systematic errors presented in [52], the uncertainty in the branching ratios and the form factors contribute about 15% below 450 MeV/c2, 30% in the mass range of 450–750 MeV/c2, and 6% above 750 MeV/c2.
Finally, the dielectrons generated are subject to detector acceptance and finite momentum resolution.
A comparison of the invariant mass spectra (see Fig. 2.5 in Sec. 2.2) shows the hadronic cocktail to describe the observed yield in p-Be and p-Au collisions well within the systematic errors of about 20%. As a result of a recent review and extension of the GENESIS code [90], the cocktail has decreased by up to 20% in the mass region of GeV/c2 (see Fig. A.3).
The low-mass yield ( GeV/c2) was previously underestimated by 35% as a result of a problem in the procedure used to apply the momentum resolution.
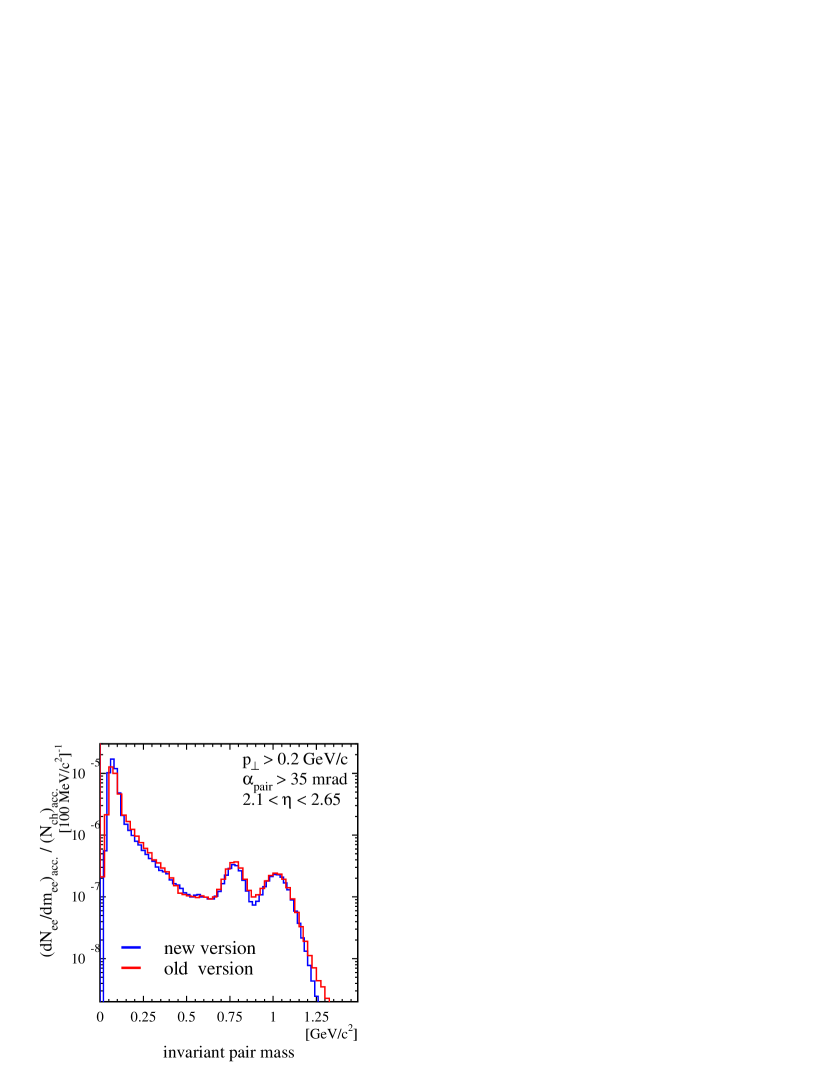
Impact of the corrected GENESIS acceptance filter on the hadronic cocktail. The previously used cocktail [113] underestimates the yield in the low-mass region by 35%.
The cocktail for p-Be and p-Au collisions is much less affected (5%) due to the lower transverse momentum cut ( MeV/c). With hindsight to this fact, the validity of the statement about the total exhaustion of the observed dilepton yield by the known hadronic sources remains sustained.
The new hadronic cocktail for Pb-Au collisions at 158 GeV/c per nucleon is plotted in Fig. A.4.

Integration of spectrum gives a total yield of which divides into for GeV/c2 and for GeV/c2. In contrast to [113], the yield of pairs with very high mass ( GeV/c2) is slightly reduced as result of the upper momentum cut of GeV/c imposed for the discrimination of high-momentum pions.
Appendix B Summary of rejection strategy
| Description | Cut selection | Comment |
| acceptance | SDD-1/2 =141.–299. mrad | |
| RICH-1=141.–299. mrad | 2/3 ring accepantce | |
| RICH-2=141.–258. mrad | 2/3 ring accepantce | |
| double dE/dx | SDD-1 dE/dx 1133 | 5 mrad resummation |
| rejection | SDD-2 dE/dx 1204 | |
| SDD-1 | SDD-2 dE/dx 1204 | 8 mrad resummation |
| conversion | RICH-1 sum amplitude 1550 | |
| track quality | SDD-12 1.3–1.5 mrad | target disk dependence |
| SDDRICH-1 | ||
| RICH-12 | ||
| RICH-2 Hough-2 amplitude 360 | ring candidate quality | |
| RICH-2 1.3 | ring fit quality | |
| 300 mrad | max. B-field deflection | |
| mrad | min. B-field deflection | |
| high- pion | pressure dependence | |
| rejection | of nominal radius | |
| mrad | ||
| final acceptance | =2.1–2.65 (single track) | eq. =141.–243. mrad |
| 0.2(0.1) GeV/c (single track) | ||
| 35 mrad | pair opening angle |
Bibliography
- [1] E. V. Shuryak. Quark-gluon plasma and hadronic production of leptons, photons and psions. Phys. Lett., B78:150, 1978.
- [2] Ulrich Heinz and Maurice Jacob. Evidence for a new state of matter: An assessment of the results from the CERN lead beam programme. nucl-th/0002042, 2000.
- [3] Mark G. Alford, Jurgen Berges, and Krishna Rajagopal. Magnetic fields within color superconducting neutron star cores. Nucl. Phys., B571:269–284, 2000.
- [4] Henning Heiselberg, Sangyong Jeon, Larry McLerran, and Hua-Bin Tang. Hot neutron stars as a source for gamma ray bursts at cosmological distance scales. astro-ph/9711169, 1997.
- [5] T. Maruyama and S. Chiba. Equation of state of neutron-star matter and the isovector nucleon optical model potential. J. Phys., G25:2361–2369, 1999.
- [6] C. Itzykson and J. Zuber. Quantum Field Theory. McGRAW-HILL, 1980.
- [7] Michael Schmelling. Status of the strong coupling constant. hep-ex/9701002, 1996.
- [8] D.E. Groom and M. Aguilar-Benitez. Review of Particle Physics. The European Physical Journal, C15:1+, 2000.
- [9] F. Klingl and W. Weise. Vector mesons in medium. 1998.
- [10] C. Vafa and Edward Witten. Restrictions on symmetry breaking in vector - like gauge theories. Nucl. Phys., B234:173, 1984.
- [11] J. Goldstone. Field theories with ’superconductor’ solutions. Nuovo Cim., 19:154–164, 1961.
- [12] Murray Gell-Mann, R. J. Oakes, and B. Renner. Behavior of current divergences under SU(3)SU(3). Phys. Rev., 175:2195–2199, 1968.
- [13] Iian Jameson, A. W. Thomas, and G. Chanfray. The pion - nucleon sigma term. J. Phys., G18:L159–L165, 1992.
- [14] Murray Gell-Mann and M Levy. The axial vector current in beta decay. Nuovo Cim., 16:705, 1960.
- [15] Yoichiro Nambu and G. Jona-Lasinio. Dynamical model of elementary particles based on an analogy with superconductivity. I. Phys. Rev., 122:345–358, 1961.
- [16] J. D. Walecka. A theory of highly condensed matter. Annals Phys., 83:491–529, 1974.
- [17] M. Lutz, S. Klimt, and W. Weisef. Meson properties at finite temperature and baryon density. Nucl. Phys., A542:521–558, 1992.
- [18] B. Friman, W. Norenberg, and V. D. Toneev. The quark condensate in relativistic nucleus nucleus collisions. 1997.
- [19] G. E. Brown and M. Rho. Scaling effective Lagrangians in a dense medium. Phys. Rev. Lett., 66:2720–2723, 1991.
- [20] M. Dey, V. L. Eletsky, and B. L. Ioffe. Mixing of vector and axial mesons at finite temperature: an indication towards chiral symmetry restoration. Phys. Lett., B252:620–624, 1990.
- [21] R. Rapp and J. Wambach. Chiral symmetry restoration and dileptons in relativistic heavy-ion collisions. Adv. Nucl. Phys., 25:1, 2000.
- [22] Z. Aouissat, G. Chanfray, P. Schuck, and J. Wambach. A non-perturbative treatment of the pion in the linear sigma-model. Nucl. Phys., A603:458–470, 1996.
- [23] Bernd-Jochen Schaefer and Hans-Jurgen Pirner. The equation of state of quarks and mesons in a renormalization group flow picture. Nucl. Phys., A660:439–474, 1999.
- [24] G. Papp, B. J. Schaefer, H. J. Pirner, and J. Wambach. On the convergence of the expansion of renormalization group flow equation. Phys. Rev., D61:096002, 2000.
- [25] Frithjof Karsch and Edwin Laermann. Susceptibilities, the specific heat and a cumulant in two flavor QCD. Phys. Rev., D50:6954–6962, 1994.
- [26] Claude W. Bernard et al. The equation of state for two flavor QCD at N(t)=6. Phys. Rev., D55:6861–6869, 1997.
- [27] T. Blum, Leo Karkkainen, D. Toussaint, and Steven Gottlieb. The beta function and equation of state for QCD with two flavors of quarks. Phys. Rev., D51:5153–5164, 1995.
- [28] E. V. Shuryak and J. J. M. Verbaarschot. Random matrix theory and spectral sum rules for the Dirac operator in QCD. Nucl. Phys., A560:306–320, 1993.
- [29] J. J. M. Verbaarschot and T. Wettig. Random matrix theory and chiral symmetry in QCD. Ann. Rev. Nucl. Part. Sci., 50:343–410, 2000.
- [30] T. Bertrand, P. Schuck, G. Chanfray, Z. Aouissat, and J. Dukelsky. Selfconsistent random phase approximation in a schematic field theoretical model. Phys. Rev., C63:024301, 2001.
- [31] A. Rabhi, P. Schuck, R. Bennaceur, G. Chanfray, and J. Dukelsky. Restoration of broken symmetries in self-consistent RPA. nucl-th/0106064, 2001.
- [32] E. V. Shuryak. Probing the boundary of the non-perturbative QCD by small size instantons. hep-ph/9909458, 1999.
- [33] R. Rapp, T. Schafer, E. V. Shuryak, and M. Velkovsky. Diquark Bose condensates in high density matter and instantons. Phys. Rev. Lett., 81:53–56, 1998.
- [34] T. Schafer and E. V. Shuryak. Instantons in QCD. Rev. Mod. Phys., 70:323–426, 1998.
- [35] Santo Fortunato and Helmut Satz. Percolation and deconfinement in SU(2) gauge theory. Nucl. Phys., A681:466–471, 2001.
- [36] Santo Fortunato. Percolation and deconfinement in SU(2) gauge theory. hep-lat/0012006, 2000.
- [37] Lisa J. Randall, R. Rattazzi, and E. Shuryak. Implication of exact SUSY gauge couplings for QCD. Phys. Rev., D59:035005, 1999.
- [38] Johanna Stachel. Towards the quark-gluon plasma. Nucl. Phys., A654:119c–135c, 1999.
- [39] Peter Braun-Munzinger. Towards the quark-gluon plasma. Nucl. Phys., A663:183–190, 2000.
- [40] Krishna Rajagopal and Frank Wilczek. The condensed matter physics of QCD. hep-ph/0011333, 2000.
- [41] Helmut Satz. Colour deconfinement in nuclear collisions. Rept. Prog. Phys., 63:1511, 2000.
- [42] T. Matsui, B. Svetitsky, and L. D. McLerran. Strangeness production in ultrarelativistic heavy ion collisions. 1. chemical kinetics in the quark - gluon plasma. Phys. Rev., D34:783, 1986.
- [43] Helmut Satz. Hard probes of dense matter. Nucl. Phys., A590:63c–80c, 1995.
- [44] C. Lourenco. Hard probes in nucleus nucleus collisions. Nucl. Phys., A610:552c–566c, 1996.
- [45] Xin-Nian Wang. Hard probes in high-energy heavy-ion collisions. Prog. Theor. Phys. Suppl., 129:45–60, 1997.
- [46] E. L. Feinberg. Direct production of photons and dileptons in thermodynamical models of multiple hadron production. Nuovo Cim., A34:391, 1976.
- [47] L. D. McLerran and T. Toimela. Photon and dilepton emission from the quark - gluon plasma: Some general considerations. Phys. Rev., D31:545, 1985.
- [48] E. V. Shuryak. Correlation functions in the QCD vacuum. Rev. Mod. Phys., 65:1–46, 1993.
- [49] James V. Steele, Hidenaga Yamagishi, and Ismail Zahed. Dilepton and photon emission rates from a hadronic gas. ii. Phys. Rev., D56:5605–5617, 1997.
- [50] R. Rapp. Signatures of thermal dilepton radiation at RHIC. Phys. Rev., C63:054907, 2001.
- [51] U. Goerlach. Results of the HELIOS collaboration on low mass dilepton and soft photon production in p Be, p W and S W collisions. Nucl. Phys., A544:109c–124c, 1992.
- [52] G. Agakishiev et al. Systematic study of low-mass electron pair production in p Be and p Au collisions at 450-GeV/c. Eur. Phys. J., C4:231–247, 1998.
- [53] G. Agakishiev et al. Neutral meson production in p-Be and p-Au collisions at 450 GeV beam energy. Eur. Phys. J., C4:249, 1998.
- [54] M. C. Abreu et al. Low mass dimuon production in proton and ion induced interactions at the SPS. Eur. Phys. J., C13:69–78, 2000.
- [55] K. Ozawa et al. Observation of rho / omega meson modification in nuclear matter. Phys. Rev. Lett., 86:5019–5022, 2001.
- [56] G. Agakishiev et al. Enhanced production of low mass electron pairs in 200-GeV/u S - Au collisions at the CERN SPS. Phys. Rev. Lett., 75:1272–1275, 1995.
- [57] G. Agakishiev et al. CERES results on low-mass electron pair production in Pb Au collisions. Nucl. Phys., A638:159, 1998.
- [58] G. Agakishiev et al. Low-mass electron pair production in Pb-Au collisions at 158 GeV per nucleon. to be published, 2001.
- [59] A. L. S. Angelis et al. Study of vector mesons in dimuon production in a large kinematic region in p W and S W interactions at 200- GeV/c/nucleon. Eur. Phys. J., C5:63–75, 1998.
- [60] H. Appelshäuser. New results from CERES. Nucl. Phys., A698:253c–260c, 2002. Quark Matter 01, Proc. Int. Conf. on Ultra-Relativistic Nucleus-Nucleus Collisions, Stony Brook, 2001.
- [61] S. Damjanovic. Low Mass Electron Pair Production in Pb-Au Collisions at 40 AGeV. to be published, 2002.
- [62] H. O’Connell et al. SLAC-SPIRES HEP database. http://www.slac.stanford.edu/spires/hep/.
- [63] F. Ceretto. Charged Hadron Production in Pb-Au Collisions at 158 A GeV. PhD thesis, Ruprecht-Karls-Univertität Heidelberg, 1998.
- [64] G. Agakishiev et al. High-pt charged pion production in Pb-Au collisions at 158-A-GeV/c. 2000.
- [65] D. Irmscher. Search for direct thermal photons in the NA35/CERES experiment. Nucl. Phys., A566:347C, 1994.
- [66] M. Messer. Photons in Pb-Au collisions at 158 A GeV. PhD thesis, Ruprecht-Karls-Univertität Heidelberg, 1998.
- [67] G. Agakishiev et al. Hadron physics with CERES: Spectra and collective flow. Nucl. Phys., A638:467–470, 1998.
- [68] W. Schmitz. Lambda-Produktion in Pb-Au-Kollisionen bei 40 A GeV. PhD thesis, Ruprecht-Karls-Univertität Heidelberg, 2001.
- [69] H. J. Specht. CERES/NA45 Collaboration, status report and outline of future plans: Memorandum. 1992. CERN-SPSLC-92-47.
- [70] I. Tserruya. The CERES spectrometer. Nucl. Phys., A553:857C, 1993.
- [71] C. Voigt. Produktion von e+e--Paaren in ultrarelativitischen Pb-Au-Kollisionen bei 160 A GeV. PhD thesis, Ruprecht-Karls-Univertität Heidelberg, 1998.
- [72] P. Rehak et al. Study of electron pair production in hadron and nuclear collisions at the CERN SPS: Addendum II to Proposal SPSC-P- 237. 1992. CERN-SPSLC-92-48.
- [73] W. Chen et al. Performance of the multianode cylindrical silicon drift detector in the CERES NA45 experiment: First results. Nucl. Instrum. Meth., A326:273–278, 1993.
- [74] C. Weber. Multiplizitätsverteilung geladener Teilchen in ultrarelativistischen Pb+Au Kollisionen gemessen mit Siliziumdriftdetektoren. Master’s thesis, Ruprecht-Karls-Univertität Heidelberg, 1997.
- [75] N. Ashcroft, I. Mermin, and N. David. Solid state physics. Saunders College Publishing, 1976.
- [76] Robert T. Rewick, Mary L. Schumacher, Stephen L. Shapiro, Thomas B. Weber, and Matteo Cavalli-Sforza. Tetrakis(dimethylamino)ethylene: Identification of impurities and compatability with common metal, polymer, and ceramic laboratory materials. Anal. Chem., 60:2095–2099, 1988.
- [77] R. Baur et al. The CERES RICH detector system. Nucl. Instrum. Meth., A343:87–98, 1994.
- [78] R. Baur et al. The Pad readout of the CERES RICH detectors. Nucl. Instrum. Meth., A355:329–341, 1995.
- [79] App. Software Group Computing and Networks Division. Possion. Technical report, CERN Program Library, 1993.
- [80] E. Sokol. Dilepton production in Pb-Au collisions at 158 GeV per nucleon using the CERES detector. PhD thesis, The Weizmann Institute of Science Rehovot, Israel, 1999.
- [81] G. Agakishiev et al. First results from the CERES radial TPC. Nucl. Phys., A661:673, 1999.
- [82] C. Muntz. The di-electron spectrometer HADES at GSI: A status report. Nucl. Phys. Proc. Suppl., 78:139–144, 1999.
- [83] G. Agakishiev et al. Cherenkov ring fitting techniques for the CERES RICH detectors. Nucl. Instrum. Meth., A371:243–247, 1996.
- [84] D.G. Coyne. Anal. Chem., 60:2095, 1989.
- [85] H. Ries and R. Maenner. Transmission of thick quartz windows. Technical Report 29, CERES collaboration, 1988.
- [86] A. Braem et al. Development of transparent windows for a new generation of Cherenkov counters sensitive in the EUV range, 1994. CERN-AT-94-33.
- [87] P. Glassel. The limits of the ring image Cherenkov technique. Nucl. Instrum. Meth., A433:17, 1999.
- [88] App. Software Group Computing and Networks Division. GEANT-Detector Description and Simulation Tool. Technical report, CERN Program Library W5013, 1993.
- [89] C. Esumi. Momentum resolution of CERES. Technical Report 50, CERES collaboration, 1999.
- [90] H. Sako. Development of New GENESIS. Technical Report 03-24, CERES collaboration, 2000.
- [91] Eldon P. Kasl and Dave Crowe. A critical review of ultralightweight composite mirror technology. 2000.
- [92] A. Braem and M. E. Kostrikov. Radiation transparent mirrors for RICH detectors. IFVE-93-129.
- [93] George Hass. Reflectance and preparation of front-surface mirrors for use at various angles of incidence from the ultraviolet to the far infrared. J. Opt. Soc. Am., 72:27, 1982.
- [94] H. Ries. CFK mirror tests. Technical Report 41, CERES collaboration, 1989.
- [95] K. Zeitelhack et al. The HADES RICH detector. Nucl. Instrum. Meth., A433:201–206, 1999.
- [96] P. Maier-Komor, R. Gernhauser, J. Wieser, and A. Ulrich. Experience with the uhv box coater and the evaporation procedure for vuv reflective coatings on the hades rich mirror. Nucl. Instrum. Meth., A438:152–162, 1999.
- [97] A. Braem, 1999. privat communication.
- [98] EADS Deutschland GmbH (Space Services). Willy-Messerschmitt-Stra e, 85521 Ottobrunn, Germany.
- [99] Y. Akiba et al. Ring imaging Cherenkov detector of PHENIX experiment at RHIC. Nucl. Instrum. Meth., A433:143, 1999.
- [100] OPTICON Corporation. 76 Treble Crove Rd, N. Billerica, MA 01862, USA.
- [101] Division of Spacecraft MAN Technologie AG. P.O. Box 1347, D-85751 Karlsfeld, Germany.
- [102] Whitaker A. et al. Environmental effects on composites. In S. Peters, editor, Handbook of Composites, chapter 37. Chapman and Hall, second edition, 1997.
- [103] Advance Ratio Design Corporation Inc. 2540 Green Street, Chester, PA 19013, USA.
- [104] Société Européenne de Systèmes Optiques. Pôle d’Activités d’AIX-les-MILLES, 305 rue Louis Armand, 13792 AIX EN PROVENCE cédex 3, France.
- [105] Composite Optics Inc. 9671 Distribution Avenue, San Diego, CA 92121, USA.
- [106] J. Friese, 2000. privat communication.
- [107] Hexcel Corporation. Two Stamford Plaza, 281 Tresser Blvd., Stamford, CT 06901, USA.
- [108] M. Djobadze and G. Ager. Solid membrane isogrid stiffend reflectors. In 19. AIAA International Communications Satellite Systems Conference, 2000.
- [109] A. Clark, R. Clark, J. Thomas, and J. Hylton. Optical measurements of CERES mirror. Technical Report 1, Composite Optics, Inc., 2000.
- [110] D. Di Bari et al. A large area CsI RICH detector in ALICE at LHC. Nucl. Phys. Proc. Suppl., 78:337–341, 1999.
- [111] G. Baum et al. The COMPASS RICH project. Nucl. Instrum. Meth., A433:207–211, 1999.
- [112] G. Hering and P. Braun-Munzinger. Development of an ultra-thin mirror for RICH detectors. to be published, 2002.
- [113] B. Lenkeit. Elektron-Positron-Paar Emission in Pb-Au-Kollisionen bei 158 A GeV. PhD thesis, Ruprecht-Karls-Univertität Heidelberg, 1998.
- [114] J. Slivova. Azimuthal Correlations of High-pt Pions in 158 AGeV/c Pb-Au Collisions at CERES/NA45 Experiment. to be published, 2002.
- [115] G. Agakishiev et al. A new robust fitting algorithm for vertex reconstruction in the CERES experiment. Nucl. Instrum. Meth., A394:225–231, 1997.
- [116] V. Petracek. Status of charm analysis. Technical Report 16-06, CERES collaboration, 2001. CERES collaboration meeting.
- [117] J. Rak. Silicon Drift Detector calibration. Technical Report 02-05, CERES collaboration, 2000.
- [118] G. Agakishiev, O. Yu. Barannikova, V. V. Belaga, G. A. Ososkov, and Yu. A. Panebratsev. Alignment of detectors at CERES/NA45. 1998. JINR-E10-98-277.
- [119] J. Stachel. Systematics of global observables in relativistic heavy ion collisions. Nucl. Phys., A525:23c–38c, 1991.
- [120] J. Stachel and G. R. Young. Relativistic heavy ion physics at CERN and BNL. Ann. Rev. Nucl. Part. Sci., 42:537, 1992.
- [121] S. A. Bass et al. URQMD: A new molecular dynamics model from GANIL to CERN energies. 1996. Prepared for International Conference on Nuclear Physics at the Turn of Millennium: Structure of Vacuum and Elementary Matter, Wilderness / George, South Africa, 10-16 Mar 1996.
- [122] S. Damjanovic. Dielectron production in Pb-Au collisions at 40 A GeV. Technical Report 16-06, CERES collaboration, 2001. CERES collaboration meeting.
- [123] A. Drees. Low mass electron pair production in p Be, p Au and S Au collisions observed in the CERES experiment at the CERN SPS. 1995. In *Hirschegg 1995, Proceedings, Dynamical properties of hadrons in nuclear matter* 151-162.
- [124] T. Ullrich et al. First results from CERES/NA45 on low mass electron pair production in Pb Au collisions. Nucl. Phys., A610:317C, 1996.
- [125] G. Agakishiev et al. Low-mass e+ e- pair production in 158-A-GeV Pb Au collisions at the CERN SPS, its dependence on multiplicity and transverse momentum. Phys. Lett., B422:405–412, 1998.
- [126] B. Lenkeit et al. Recent results from Pb Au collisions at 158-GeV/c per nucleon obtained with the CERES spectrometer. Nucl. Phys., A661:23, 1999.
- [127] Sandor Hegyi. KNO scaling 30 years later. Nucl. Phys. Proc. Suppl., 92:122–129, 2001.
- [128] Marek Gazdzicki and Mark I. Gorenstein. Background subtraction from the dilepton spectra in nuclear collisions. 2000.
- [129] P. Crochet and P. Braun-Munzinger. Investigation of background subtraction techniques for high mass dilepton physics. 2001.
- [130] S. Voloshin. Fluctuations in the mixed event technique. 1994.
- [131] D. Miskowiec, 2000. privat communication.
- [132] A. Woerner. Master’s thesis, Ruprecht-Karls-Univertität Heidelberg, 1990.
- [133] G. Hering. Calibration of the dE/dx measurement. Technical Report 16-06, CERES collaboration, 2001. CERES collaboration meeting.
- [134] G. E. Cooper. Stopping: From peripheral to central nuclear collisions at the SPS. Nucl. Phys., A661:362–365, 1999.
- [135] P. Braun-Munzinger. Physics with relativistic heavy ions, 2000. Lecture, TU Darmstadt.
- [136] V. Cerny, P. Lichard, and J. Pisut. A clear cut test of low mass dilepton production mechanism in hadronic collisions. Z. Phys., C31:163, 1986.
- [137] Jean Cleymans, Krzysztof Redlich, and Dinesh Kumar Srivastava. Equation of state of hadronic matter and electromagnetic radiation from relativistic heavy ion collisions. Phys. Lett., B420:261–266, 1998.
- [138] N. Raičević. Electron-positron pair emission in Pb-Au collisionen at 158 A GeV. PhD thesis, Ruprecht-Karls-Univertität Heidelberg, 1998.
- [139] Ralf Rapp and Edward V. Shuryak. Thermal dilepton radiation at intermediate masses at the CERN-SPS. Phys. Lett., B473:13–19, 2000.
- [140] Dinesh Kumar Srivastava and Bikash Chandra Sinha. A second look at single photon production in S + Au collisions at 200-A-GeV and implications for quark hadron phase transition. Eur. Phys. J., C12:109–112, 2000.
- [141] C. M. Hung and Edward V. Shuryak. Dilepton/photon production in heavy ion collisions, and the QCD phase transition. Phys. Rev., C56:453–467, 1997.
- [142] R. Baier, M. Dirks, and K. Redlich. Thermal dileptons from pi rho interactions in a hot pion gas. Phys. Rev., D55:4344–4354, 1997.
- [143] J. Murray, W. Bauer, and K. Haglin. Revisiting lepton pairs at the SPS. 1998.
- [144] E. L. Bratkovskaya and W. Cassing. Dilepton production from AGS to SPS energies within a relativistic transport approach. Nucl. Phys., A619:413–446, 1997.
- [145] M. Bleicher, A. K. Dutt-mazumder, C. Gale, C. M. Ko, and V. Koch. Baryonic contributions to the dilepton spectra in relativistic heavy ion collisions. 2000.
- [146] G. Q. Li, C. M. Ko, G. E. Brown, and H. Sorge. Dilepton production in proton nucleus and nucleus nucleus collisions at SPS energies. Nucl. Phys., A611:539–567, 1996.
- [147] G. E. Brown and Mannque Rho. On the manifestation of chiral symmetry in nuclei and dense nuclear matter. 2001.
- [148] R. A. Schneider and W. Weise. Thermal dileptons from quark and hadron phases of an expanding fireball. Eur. Phys. J., A9:357–364, 2000.
- [149] R. Rapp, G. Chanfray, and J. Wambach. Rho meson propagation and dilepton enhancement in hot hadronic matter. Nucl. Phys., A617:472–495, 1997.
- [150] Ralf Rapp and Jochen Wambach. Low mass dileptons at the CERN-SPS: Evidence for chiral restoration? Eur. Phys. J., A6:415–420, 1999.
- [151] C. H. Lee, H. Yamagishi, and I. Zahed. Dilepton and photon emission rates from a hadronic gas. III. Phys. Rev., C58:2899–2906, 1998.
- [152] K. Gallmeister, B. Kampfer, and O. P. Pavlenko. Is there a unique thermal source of dileptons in pb (158- a-gev) + au, pb reactions? Phys. Lett., B473:20–24, 2000.
- [153] G. E. Brown, G. Q. Li, R. Rapp, Mangue Rho, and J. Wambach. Medium dependence of the vector-meson mass: Dynamical and/or Brown-Rho scaling? Acta Phys. Polon., B29:2309–2321, 1998.
- [154] Chungsik Song, Volker Koch, Su Houng Lee, and C. M. Ko. Thermal effects on dilepton production from pi - pi annihilation. Phys. Lett., B366:379–384, 1996.
- [155] C. Song. Chiral Lagrangian with BR scaling for dense nuclear matter. AIP Conf. Proc., 494:471–474, 1999.
- [156] B. Friman and H. J. Pirner. P-wave polarization of the rho meson and the dilepton spectrum in dense matter. Nucl. Phys., A617:496–509, 1997.
- [157] P. Braun-Munzinger, D. Miskowiec, A. Drees, and C. Lourenco. Open charm contribution to the dilepton spectra produced in nuclear collisions at SPS energies. Eur. Phys. J., C1:123–130, 1998.
- [158] O. Teodorescu, A. K. Dutt-Mazumder, and C. Gale. The effects of meson mixing on dilepton spectra. Phys. Rev., C63:034903, 2001.
- [159] W. Florkowski and W. Broniowski. In-medium modifications of hadron masses and chemical freeze-out in ultra-relativistic heavy-ion collisions. Phys. Lett., B477:73–76, 2000.
- [160] M. Herrmann, B. L. Friman, and W. Norenberg. Properties of rho mesons in nuclear matter. Nucl. Phys., A560:411–436, 1993.
- [161] B. Kampfer, K. Gallmeister, O. P. Pavlenko, and C. Gale. Dileptons and photons from central heavy-ion collisions at CERN-SPS. 2001.
- [162] R. Rapp, 2001. private communication.
- [163] D. P. Morrison et al. The PHENIX experiment at RHIC. Nucl. Phys., A638:565–570, 1998.
- [164] D. Irmscher. Suche nach direkten Photonen in ultrarelativistischen S-Au-Kollisionen bei 200 GeV pro Nukleon. PhD thesis, Ruprecht-Karls-Univertität Heidelberg, 1993.
- [165] T. Ullrich. Produktion von -Paaren in ultrarelativistischen S-Au-Kollisionen bei 200 GeV/u. PhD thesis, Ruprecht-Karls-Univertität Heidelberg, 1994.
- [166] P. Braun-Munzinger, I. Heppe, and J. Stachel. Chemical equilibration in Pb + Pb collisions at the SPS. Phys. Lett., B465:15–20, 1999.
- [167] M. M. Aggarwal et al. Centrality dependence of neutral pion production in 158-A-GeV Pb-208 + Pb-208 collisions. Phys. Rev. Lett., 81:4087–4091, 1998.
- [168] M. M. Aggarwal et al. Transverse mass distributions of neutral pions from 208-Pb induced reactions at 158-A-GeV. nucl-ex/0108006, 2001.
- [169] M. Kaneta. Thermal and Chemical Freeze-out in Heavy Ion Collisions. PhD thesis, Hiroshima University, 1999.
- [170] H. Appelshauser et al. Recent results on central Pb + Pb collisions from experiment NA49. Nucl. Phys., A638:91–102, 1998.
- [171] I. G. Bearden et al. One-, two- and three-particle hadron spectra: Recent results from CERN/SPS experiment NA44. Nucl. Phys., A638:103–114, 1998.
- [172] I. G. Bearden et al. Kaon and proton ratios from central Pb + Pb collisions at the CERN SPS. Nucl. Phys., A638:419–422, 1998.
- [173] H. Appelshauser et al. Xi and Antixi production in 158-GeV/nucleon Pb + Pb collisions. Phys. Lett., B444:523–530, 1998.
- [174] E. Andersen et al. Enhancement of central Lambda, Xi and Omega yields in Pb Pb collisions at 158-A-GeV/c. Phys. Lett., B433:209–216, 1998.
- [175] E. Andersen et al. Strangeness enhancement at midrapidity in Pb-Pb collisions at 158-A-GeV/c. J. Phys., G25:181–188, 1999.
- [176] M. M. Aggarwal et al. Recent results on Pb + Pb collisions at 158-A-GeV from the WA98 experiment at CERN. Nucl. Phys., A638:147–158, 1998.
Resume
| Name: | Hering, Gunar |
| Date of Birth: | February 2, 1972 - Chemnitz, Germany |
| Address: | Friedensstraße 23 |
| D-69121 Heidelberg, Germany | |
| Tel.: (49)6221-474904 | |
| Email: Gunar.Hering@gsi.de | |
| Education: | |
| 5/97 - present | Technical University of Darmstadt |
| Ph.D. in Physics | |
| Thesis on “Dielectron production in heavy ion collisions | |
| at 158 GeV/c per nucleon”, adivsor: Prof. Peter Braun-Munzinger | |
| Ph.D. scholarship of German Scholarship Foundation | |
| 3/98 - 3/00 | Karl Ruprechts University, Heidelberg |
| Major: Economics | |
| 2/99 - 3/99 | Universidad del la Frontera Temuco, Chile |
| Internship at Department of Economics | |
| 9/91 - 12/96 | Friedrich Schiller University, Jena |
| Major: Physics, Minor: Mathematics, Ecology | |
| Diploma in Physics, grade “very good” | |
| Intermediate examination, grade “very good” | |
| Scholarship of German Scholarship Foundation | |
| Scholarship of The Melton Foundation | |
| 8/94 - 8/95 | State University of New York at Stony Brook ,USA |
| Masters of Arts, Major: Physics | |
| Thesis on “Hexadecapole deformations in actinide and | |
| trans-actinide nuclei”, adivsor: Prof. Peter Paul | |
| Fulbright scholarship | |
| 9/86 - 7/90 | Special school for natural sciences at Chemnitz (senior high school) |
| Abitur, grade “very good” | |
| 2. Prize federal contest “Jugend forscht” for the | |
| development of an electronic cardiological model | |
| Work history: | |
| 5/97 - present | Gesellschaft für Schwerionenforschung, Darmstadt |
| Developed particle detector and analyzed experimental data | |
| 12/99 | Hanse Institute for Advanced Study, Bremen |
| Organized conference on “Problems of applied ethics” | |
| 2/99 - 3/99 | Centro de Gestion Empresarial - Project manager, Temuco Chile |
| Conducted market study for start-up micro-credit | |
| project “Mujeres del sur del mundo” | |
| 1/97 - 5/97 | The Boston Consulting Group - Visiting Associate, Frankfurt/M. |
| Performed a strategy review for a software systems provider | |
| 9/92 - 7/94 | FSU Physics department - Teaching assistant, Jena |
| Trained students in physics labs | |
| 9/90 - 9/91 | Rettungsamt Chemnitz - Paramedic (civil service) |
Heidelberg, January 21, 2002