The 8Li Calibration Source For The Sudbury Neutrino Observatory
Abstract
A calibration source employing 8Li (t1/2 = 0.838 s) has been developed for use with the Sudbury Neutrino Observatory (SNO). This source creates a spectrum of beta particles with an energy range similar to that of the SNO 8B solar neutrino signal. The source is used to test the SNO detector’s energy response, position reconstruction and data reduction algorithms. The 8Li isotope is created using a deuterium-tritium neutron generator in conjunction with a 11B target, and is carried to a decay chamber using a gas/aerosol transport system. The decay chamber detects prompt alpha particles by gas scintillation in coincidence with the beta particles which exit through a thin stainless steel wall. A description is given of the production, transport, and tagging techniques along with a discussion of the performance and application of the source.
keywords:
Sudbury Neutrino Observatory , Solar Neutrinos , Radioactive Source , Energy Calibration , Cherenkov Detector , Event Reconstruction , Gas Transport , 8B SpectrumPACS:
26.65.+t Solar Neutrinos , 29.25.Rm Sources of Radioactive Nuclei , 29.40.Mc Scintillation Detectors, , , , , , ,
1 Introduction
The Sudbury Neutrino Observatory (SNO) is a 1 kilotonne mass heavy water Cherenkov detector designed for detection of neutrinos from the 8B reaction in the Sun. Neutrinos interact in D2O by elastic scattering on electrons (ES), and the charged current (CC) and neutral current (NC) interactions on deuterons. The ES and CC interactions both result in Cherenkov light from an energetic electron, and the NC interaction results in the disintegration of the deuteron which is observed by -rays from the capture of the free neutron. Cherenkov light from these interactions is detected by a spherical array of 9500 photomultiplier tubes surrounding the D2O volume, which is contained in a 12 meter diameter acrylic vessel. The detector is immersed in 7 kilotonnes of light water to provide support and shielding. The detector is located in a cavity in INCO’s Creighton mine near Sudbury, Canada. A general description of the SNO detector and its subsystems can be found in Reference [1].
Cherenkov light measurements in SNO are based upon coincident phototube signals registered within an event (i.e. within 400 ns). Energy information is largely associated with the number of tubes hit (Nhit), and the event position can be reconstructed using the relative phototube timings within the event. The hit pattern can be used to determine direction information and discriminate against instrumental backgrounds. Use of these signals requires an understanding of the detector response both through the use of Monte Carlo techniques, and through analysis of calibration sources (also discussed in Reference [1]).
The SNO detector is calibrated using a variety of sources, including an isotropic light source, -rays, neutrons, and -particles. This work describes a source which provides a high-endpoint energy spectrum of -particles created by the decay of 8Li. The source can be used to assist in energy calibrations, position reconstruction studies, and evaluation of instrumental background discrimination.
The 8Li isotope is of interest for several reasons. The isotope decays with a Q-value of 16.003 MeV and the main beta-decay branch is an allowed decay with a central end-point energy of 12.96 MeV [2]. The energy spectrum produced is similar to that of the 8B charged-current neutrino signal, [3, 4] both in endpoint and shape, as 8Li -decay is the isospin mirror to the 8B -decay (see Figure 1). Both isotopes decay to the same broad excited state of 8Be which in turn promptly decays to -particles that can be used to identify (“tag”) an event in the 8Li source.
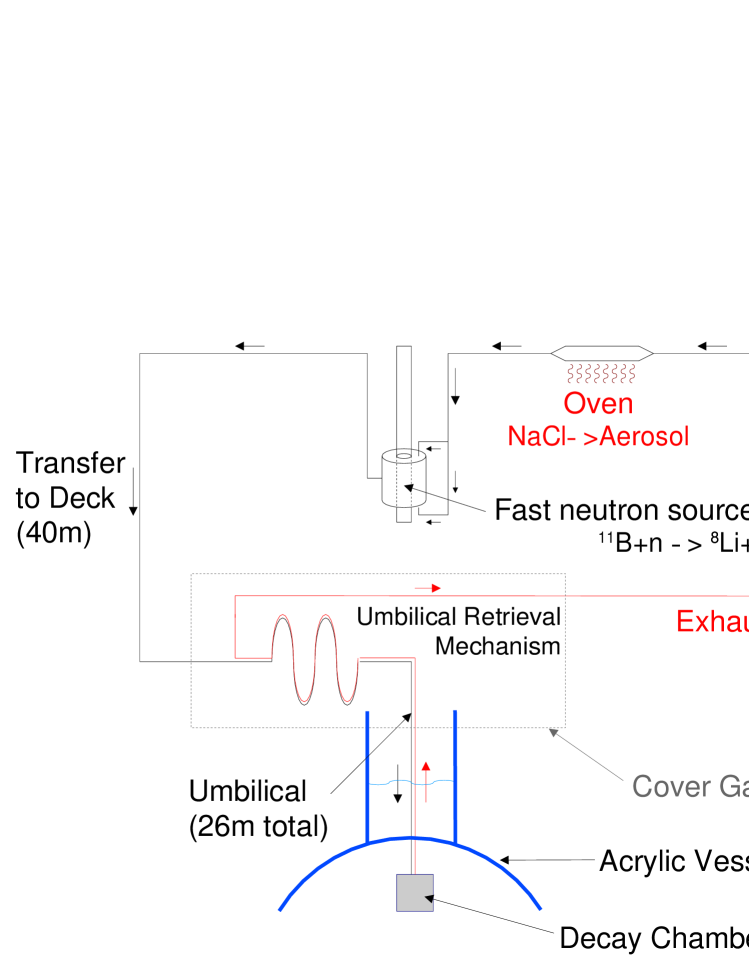
The 8Li calibration source [5] consists of several subsystems, illustrated in Figure 2 and described in this paper. Radioisotope production and transport are described in sections 2 and 3. (Proof-of-principle and design tests of these mechanisms have been reported seperately [6]). The design of the decay chamber is described in section 4. The decay chamber is positioned using the SNO manipulator system, described in Reference [1]. The performance of the source and its application are discussed in section 5.
2 8Li Production
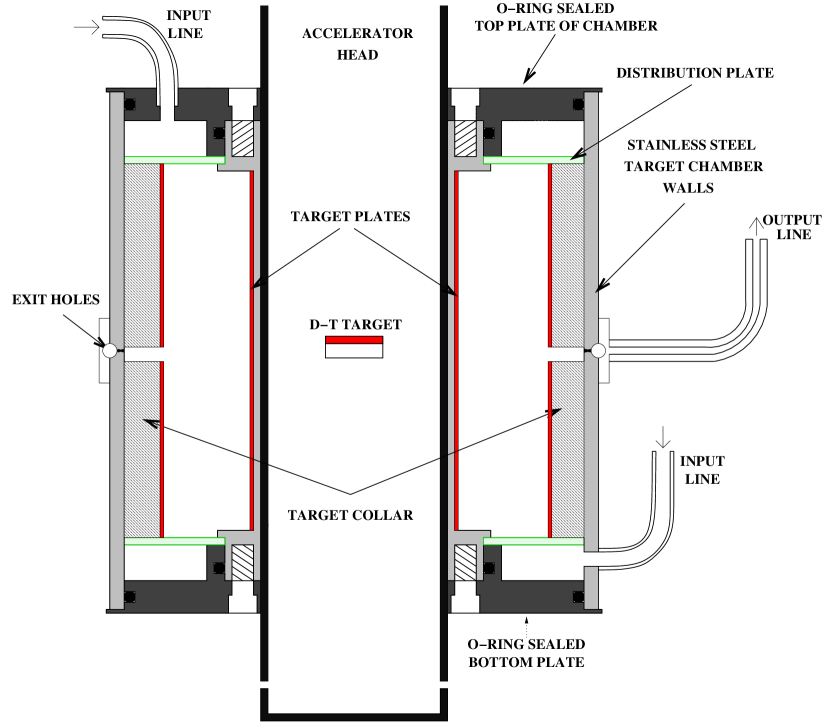
The 8Li isotope is produced by the 11B(n,) reaction (Q=-6.63 MeV, =30.5 mb [8]) using a deuterium-tritium (DT) generator to provide approximately 108 14-MeV neutrons per second. This DT generator (MF Physics model A-320) and its environment are described more thoroughly in Reference [9]. The primary production target consists of enriched 11B boron powder suspended in a polyethylene matrix. The target lines the inner wall of an annular target chamber that surrounds the DT generator (see Figure 3). The outer wall of this chamber is lined with a polyethylene collar whose inner surface is coated with boron nitride.
The 8Li atoms recoil from the target into a laminar gas stream moving through the chamber. Helium is used as the transport gas, with sodium chloride aerosol added to provide an affinity for the charged lithium atoms. The aerosol is introduced to the gas stream using a tube oven containing a quartz tube with NaCl heated to approximately 610∘C, just below its melting point.
The chamber dimensions have been optimized to allow the recoiling 8Li atoms just enough room to stop in the gas before hitting a wall, but minimize the gas volume in the chamber so that the residence time of the gas is short. Because 8Li recoils in the direction of the incident neutrons, it is primarily the inner target which is responsible for 8Li production.
Although the total rate of isotope production in the target can be readily calculated, the recoil and uptake by the salt aerosol are not accurately predicted. Direct measurement of the collection rate is complicated because corrections based on the gas transport efficiency (see following section) are needed. Because of the many assumptions made in the gas transport model, it is difficult to separate 8Li collection from transfer efficiency when measuring yields. If the gas model described below is assumed correct then the 8Li recoil and capture rates (i.e. collection rate) can be estimated by correcting yield data with measurements from different transfer configurations. The estimated rate at which 8Li atoms are collected is (31) 8Li atoms per 14-MeV neutron.
3 Gas Transport System
The isotope is transported from the shielded neutron generator pit to the detector by two sets of transfer lines. One set, a conduit approximately 40 meters long, connects the production chamber in the pit to the source manipulator system on a deck above the SNO detector. The second set is an umbilical approximately 26 meters long that runs through an umbilical retrieval mechanism, and down into a decay chamber immersed in the D2O. This umbilical length is sufficient to deploy the chamber in most of the top half of the D2O volume.
The construction of the umbilical is similar to that used for the SNO 16N source [9] but with larger overall dimensions. The design consists of a 3.38 mm inner diameter PTFE capillary used to flow gas into the decay chamber, and an 8.0 mm inner diameter polyethylene tube that is used to exhaust the gas from the decay chamber. The inlet capillary is inside the outlet tube. A signal line and low-voltage DC power lines are wrapped in a helix around the outer tube, and the whole assembly is covered with a clean, flexible silicone sheath acting as a water seal. Silicone potting gel is used to seal the space between sheath and outlet tube. This design allows robust manipulation of the umbilical and protects the radioactively pure D2O against contamination.
Because of the low production rate and short half-life of the 8Li isotope, the characteristics of the gas system (i.e. gas pressures, flow rates, capillary dimensions) were designed for optimization of the 8Li yield. The gas flow was designed to operate at the limit of laminar flow through the conduit and umbilical. Faster delivery of the radioisotope is possible through the use of near-supersonic gas flow speeds, but is deemed impractical in this case due to considerations of safety, complications such as salt buildup inside the decay chamber, and the difficulties of high pressure engineering.
The yield of 8Li may be taken as the product of the rate of radioisotope production (), the efficiency with which the isotope can be extracted from the production chamber (), the efficiency for transport (), and the fraction of atoms that decay while inside the decay chamber (). These properties are estimated using gas transport dynamics as described in References [10, 11].
The production chamber was designed for approximately 200-250 kPa absolute gas pressure to optimally range out 8Li recoils. Although the chamber was designed to promote laminar flow of gas, calculations were done for the pessimistic case of full mixing. The rate of change of the number of atoms of 8Li in the production chamber is described by Equation (1) for the case of full mixing,
| (1) |
where is the number of 8Li atoms in the chamber, is the rate of isotope pickup on the salt in the chamber, is the decay rate of 8Li (ln2/t1/2), and E is the rate of 8Li atoms flushed from the chamber, such that , with as the volume of the production chamber.
We define the mass flow rate as . The mean time to completely flush the production chamber, , is determined by this flow rate.
| (2) |
The steady state solution of Equation (1) allows us to define the efficiency as the fraction of produced 8Li which escapes the target chamber, .
| (3) |
The mean time for the gas to move from the production chamber through the transfer line to the decay chamber, is:
| (4) |
where is the pressure at point along the line, is the cross-sectional area of the transfer line, and is the total distance. For laminar flow this is calculable using Poisseuille’s law for mass flow, Equation (5). In this equation, is the gas viscosity, is the diameter of the transfer line, and and are the pressures of the production and decay chambers respectively.
| (5) |
For given pressures and , Equation (4) can be computed to give the mean transfer time, Equation (6).
| (6) |
The fraction of 8Li atoms that reach the far end defines the transfer line efficiency, Equation (7).
| (7) |
The decay chamber efficiency is the complement of the production chamber efficiency. Maximal gas mixing is assumed (now the optimal case) so that the efficiency is given by Equation (8).
| (8) |
where , given the pressure and volume of the decay chamber as and respectively.
The net yield of the system is computed as the product of the above efficiencies.
| (9) |
The system design is constrained by both practical considerations and by the desire to maximize this yield. To begin with, the volume of the decay chamber was chosen in order to get the best signal (see Section 4). The decay chamber pressure was determined by the conductance of the umbilical outlet tube, which was exhausted to laboratory atmospheric pressure, 125 kPa (absolute) at 2000 m below surface.
Arbitrarily high gas flow rates could not be used, because the resulting turbulent flow would not be efficient in transporting the radioisotope. Turbulent currents could increase the time it takes for a given particle to transit the transfer line, and could also deposit salt aerosol on the walls of the transfer line, both of which impair efficiency. Laminar flow occurs only when the flow rate is such that the Reynold’s number is less than a critical value of approximately 1000 [10, 11]. The Reynold’s number, is a dimensionless quantity defined as:
| (10) |
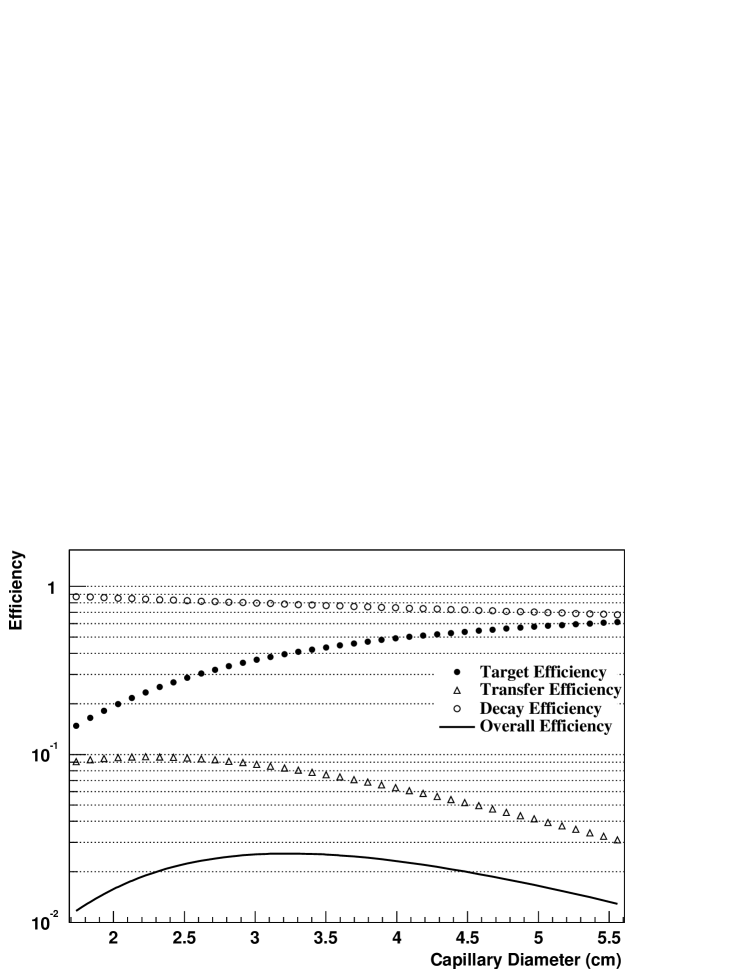
Here, is the molecular weight of the gas, is Boltzmann’s constant, and is the absolute temperature. Low molecular weight is desirable, making helium a good choice for the transport gas. To get maximum laminar flow rate for a given capillary diameter , Equation (10) is solved, using the estimated Reynold’s number of 1000:
| (11) |
Taking minimizes the transport time. Using the flow rate as a function of , the head pressure needed to drive the gas flow can be determined from Equation (5). The efficiencies for each component of the system are computed for a given value of in order to find the optimum diameter, as shown in Figure 4. This figure illustrates that the optimal transport capillary diameter is approximately 3.25 mm if the decay chamber is at 125 kPa(absolute), giving an approximate total efficiency of 2.5%. Higher efficiencies may be achievable if the decay chamber pressure can be lowered using an exhaust pump, but this has not been tested in SNO.
The final system configuration, described in Table 1, provided a workable compromise between overall efficiency and robust operation.
4 Decay Chamber Design
The decay chamber is designed to fulfill three criteria: it must (a) be capable of detecting 8Li decays with a high efficiency for event identification during analysis, (b) provide the best possible electron spectrum to the SNO detector, and (c) it must be clean, safe, and robust to protect the ultrapure SNO detector media. These last two criteria are somewhat in competition, since the best electron spectrum requires a thin-walled chamber to minimize energy loss of the escaping beta, while safety demands that the wall be thick enough to resist buckling when the chamber is under pressure underwater (at a maximum depth of 18 meters of D2O). The main volume of the decay chamber is made of spun stainless steel in a sphere, which provides excellent resistance to compressive forces, good cleanliness for exposure to the water, and elastic properties such that a mechanical failure will tend to deform but not rupture the container. The sphere has a radius of 6.35 cm, with a wall thickness of 0.06 cm, corresponding to an electron energy loss of approximately 1 MeV for the electron energies of interest.
A diagram of the decay chamber is shown in Figure 5. Above the spherical decay volume is a conical ‘neck’ which contains the in- and out-flow gas ports that are connected to the umbilical (described in Section 3). Also in this neck is a thin acrylic window atop which sits a 1.5” Hamamatsu R580 photomultiplier tube (PMT) viewing the decay volume. The PMT, voltage supply, and gas fixtures are contained inside a sealed stainless steel endcap sitting atop the neck.
Event identification is performed by utilizing the scintillating properties of the helium transport gas. The 2 decay following the 8Li beta decay creates two alpha tracks nearly back-to-back with a mean energy of 1.6 MeV per particle. In the helium gas, each of these particles has a range of about 4 cm, so a large proportion of the alpha energy is deposited in the gas.
The scintillation signal is not large [13] and consists mostly of UV light which is outside the acceptance of the PMT photo-cathode. Moreover, the PMT photo-cathode coverage is a small fraction of the decay volume, so measures were taken to enhance the signal. The inside of the sphere is painted with a reflective white titanium oxide based paint (Bicron BC620), and has a thin coating of tetraphenyl butadiene (TPB) which acts as a wavelength shifter. In addition, a small admixture of N2 gas () is added to the helium gas stream to act as an additional wavelength shifter.
The scintillation light from helium is known to be prompt [13] and the TPB and N2 wavelength shifters are also fast, so the scintillation signal was fast enough to be included in the 400 ns coincidence window in the SNO electronics. The tagging PMT signal pulse height was digitized and recorded in a spare SNO electronics channel.
Decay tagging by gas scintillation has several advantages over other detection methods (e.g. proportional counters, ZnS scintillation). The decay volume need not assume a specific shape, which allows construction of a thin-walled design. (Cylindrical shapes, such as those required for proportional counters, require a larger wall thickness for the same volume container.) Gas scintillation is much faster than many other methods, allowing the decay tag to be measured in coincidence with the associated (SNO detector) event, and making subsequent analysis simple and robust.
5 Source Performance And Application
The 8Li source has been successfully tested and deployed in the SNO detector. Calculations using the described gas model and data from short-transfer line bench tests yield a prediction for the final 8Li yield of 0.75 0.25 decays per second. A yield of approximately 0.5 decays per second was observed with the source deployed within the D2O volume of the SNO detector. An unexpected feature of the system behaviour was that the source took 2 hours to climb to the maximum yield. This is likely due to the salt temperature reaching equilibrium, increasing the pickup efficiency of the aerosol by the helium gas stream. This equilibration was not observed in short run bench tests. The yield provided by the source allowed a collection of some 50 000 tagged 8Li events to be observed.
Bench tests, using coincidences of external scintillators to identify 8Li electrons, allowed a measurement of the tagging efficiency of the decay chamber. This efficiency was estimated at 925% of all 8Li decays in the ball. This tagging efficiency remained quite robust with changes in decay chamber pressure. The tag signal was prompt (150 ns after the decay), sufficient to record the signal within the 400 ns coincidence window of the SNO electronics. The PMT tagging signal from each 8Li decay was approximately 10-20 photoelectrons.
The 8Li system generated signals created by contaminant radioisotopes. Evidence of these contaminants was indicated in bench tests, and was confirmed during deployment in the SNO detector. In addition to 0.5 8Li decays, approximately 8 of 5 MeV events were observed. Analysis of the signal indicated that the majority of this contamination was likely to be 16N, an isotope that decays by beta-gamma decay with a 6.13 MeV gamma and a half-life of 7.13 s. This isotope was likely produced by neutron reactions such as 19F (n,) and 16O (n,p) on Teflon and plastic components in the target chamber, and then carried to the decay chamber by the gas stream.
This contamination signal, however, did not interfere with the 8Li signal, because the majority of these events generated no tag pulse. The beta-gamma contaminants have only a small chance (0.6%) for the beta particle to interact with the acrylic window at the top of the decay volume, generating 1-2 photoelectrons in the PMT by Cherenkov radiation. (The gas scintillation signal created by gammas or betas is much too small to be detected.) This contamination was reduced even further by using the time and integrated charge of the tagging signal to discriminate against the contaminant events. The PMT anode pulses are much smaller than those due to alpha particles from 8Li decays, allowing a clear separation of signals. In addition, the PMT timing is different (i.e. has a faster rise time) for detection in the chamber. These properties were tested by running CO2 gas through the system, generating large quantities of 16N isotope directly (in a manner completely identical with that described in Reference [9]). This test showed that the decay chamber detected 16N in a fashion consistent with the observed contaminant activity.
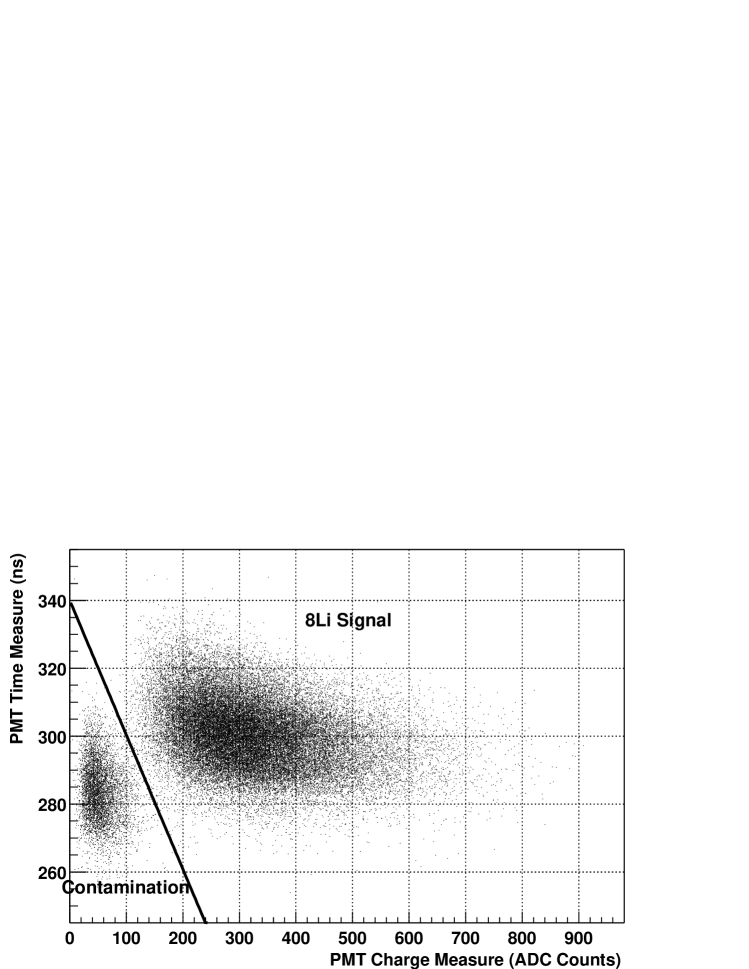
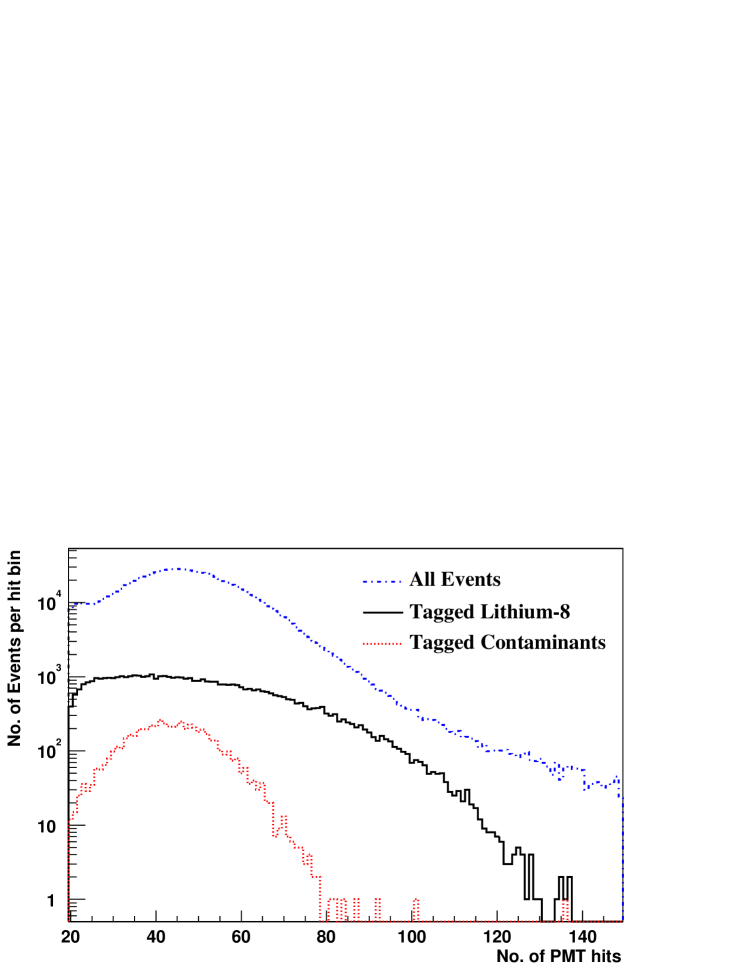
Event discrimination is illustrated in Figure 6, a scatter plot of PMT time and charge for the 8Li runs in the SNO detector. The -tagged contaminant events are clearly distinguishable from the 8Li signals. Figure 7 shows the Nhit distribution for position reconstructed events of all 8Li runs. It also shows Nhit distributions for the remaining events with a tag requirement and additional software cuts on PMT charges and times to distinguish 8Li from -tagged contaminant events such as 16N. Using event discrimination, we estimate that the total probability of a single contaminant event to be misidentified as an 8Li event to be less than 0.005%. With the observed event rates, we conservatively estimate that events due to contaminants make up less than 0.1% of the final 8Li data set.
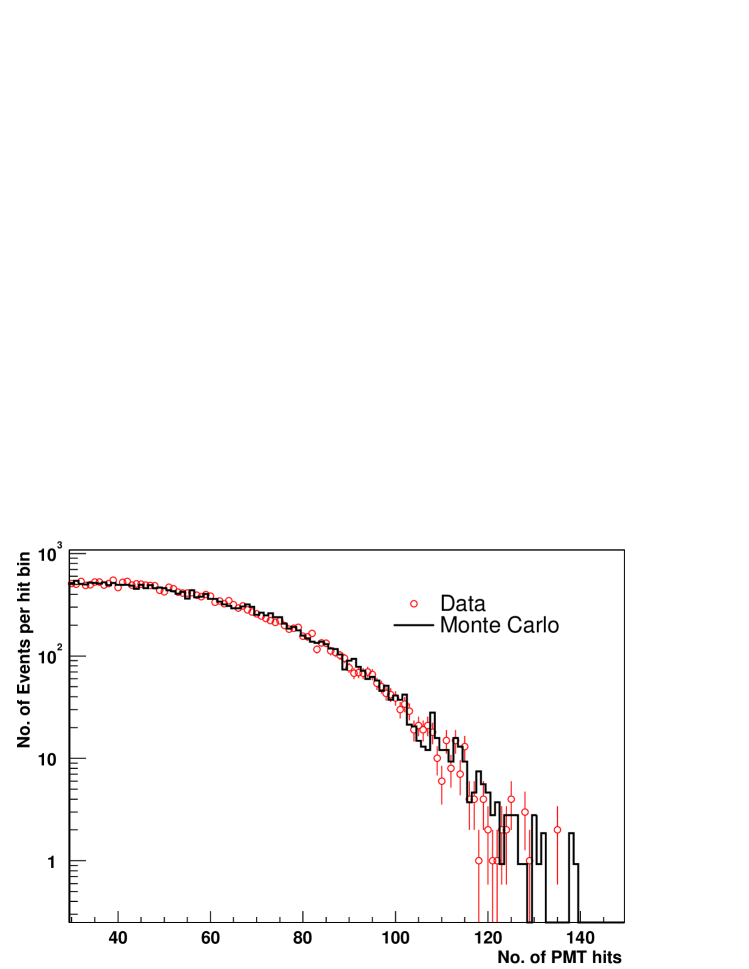
The Nhit response of the SNO detector to tagged 8Li decays is shown in Figure 8 for a run with the source situated at the center of the SNO detector. The Nhit distribution is shown to agree well with a simulation of the source using the SNO Monte Carlo code and an energy scale established with the 16N source [9, 14]. This comparison forms one of the suite of calibrations used to test energy response in the full SNO analyses [14]. Important systematic uncertainties associated with such a comparison are uncertainties in the energy loss through the stainless steel wall and optical properties (shadowing and reflectivity) of the chamber. These uncertainties are on the order of 2% for the energy scale, with further investigation underway. An intriguing application of these data is direct comparison with the observed SNO 8B neutrino spectrum. Such a comparison has significant potential [4] to reduce systematic uncertainties associated with 8Be states common to both the 8B and 8Li decay channels.
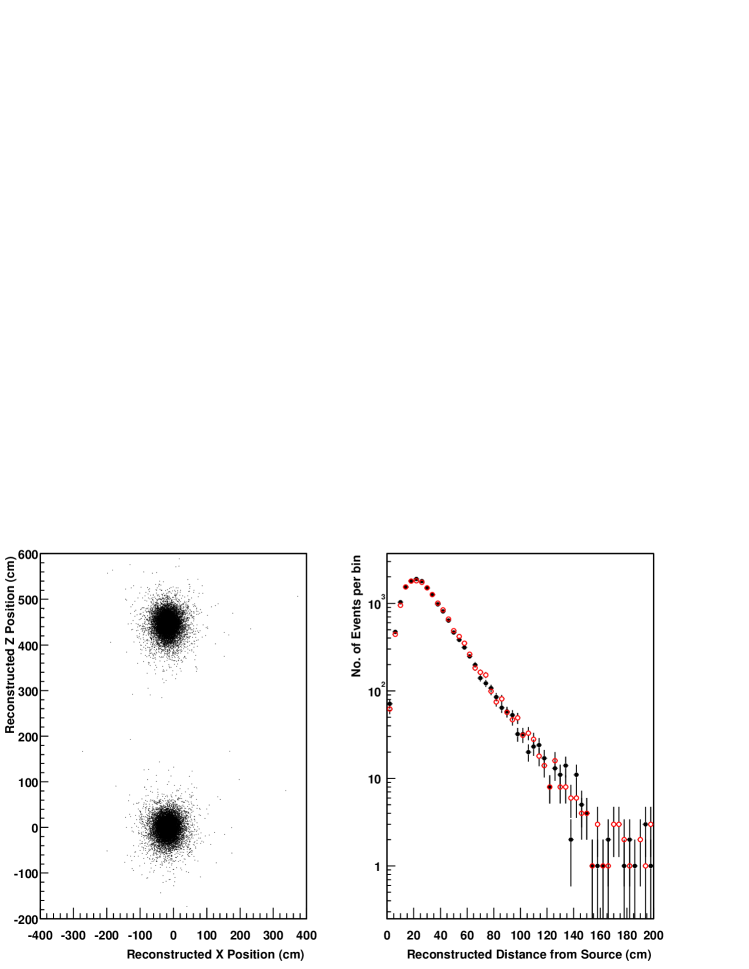
The source has been deployed in multiple locations within the SNO D2O volume, and the resulting signals have been reconstructed in the same manner as neutrino data. A sample of reconstructed event positions is shown in Figure 9. Comparison of the source position and reconstructed event position has been used to evaluate the accuracy and resolution of position reconstruction algorithms [5, 15].
Finally, the 8Li data comprise one of the tests used to evaluate data reduction techniques employed to remove instrumental background from the SNO detector data. The set of tagged 8Li events is used as a representative sample of data with distributions nearly identical to that of neutrino interactions in the detector. By counting the fraction of 8Li events removed by the data reduction cuts, the number of neutrino events falsely sacrificed by the cuts may be estimated, as described in Reference [14].
6 Conclusions
The 8Li source developed for SNO provides several necessary functions required to test the SNO detector response. Despite difficulties in producing and delivering the short-lived isotope, careful optimization allows an appreciable quantity of 8Li to be safely delivered over moderate distances.
Helium scintillation provides a mechanism to tag 8Li decays in a robust fashion. This method provides a signal that is sufficiently prompt to do fast coincidence with other signals, and has a high tagging efficiency. This signal can be used to discriminate against beta-gamma radioactive contaminants produced by the neutron source.
7 Acknowledgements
The authors wish to thank R. Deal, P. Dmytrenko, J. Fox, E. Gaudette, V. Koslowsky, and E. Hagberg for their expertise and assistance in construction of the target and transfer systems, K. McFarlane, P. Liimatainen and D. Sinclair for their hard work in construction of the 8Li decay chamber, and C. Hearns and F. Duncan, for their work in deployment. We thank P. Huffman for kindly providing the TPB wavelength shifter. We are indebted to J.R. Leslie for suggesting the 11B(n,) reaction as a production method, and E. Bonvin for first pointing out the possiblilites of using 8Li as a calibration source. Many thanks go to the entire SNO collaboration for their support and help in making this project possible.
The SNO project has been supported in Canada by the Natural Sciences and Engineering Research Council, Industry Canada, National Research Council of Canada, Northern Ontario Heritage Fund Corporation and the Province of Ontario, in the United States by the Department of Energy, and in the United Kingdom by the Science and Engineering Research Council and the Particle Physics and Astronomy Research Council. The heavy water has been loaned by AECL with the cooperation of Ontario Power Generation. The provision by INCO of an underground site is greatly appreciated.
Table 1: Physical parameters of 8Li gas transport system. Ranges indicate approximate working values during operation, and are in rough agreement with the gas model given in the text.
| Production (target) Chamber | |
|---|---|
| Volume (without collar) | 510 cm3 |
| Volume (with collar) | 279 cm3 |
| Operating pressure (absolute) | 195-210 kPa |
| Conduit transfer line | |
| Material | Teflon |
| Inner diameter | 3.18 mm |
| Length | 40 m |
| Umbilical | |
| Inner capillary material | PTFE |
| Inner capillary inner diameter | 3.38 mm |
| Inner capillary outer diameter | 4.14 mm |
| Exhaust tube outer diameter | 8.0 mm |
| Overall diameter with sheath | 15.8 mm |
| Length | 26 m |
| Decay Chamber | |
| Radius | 6.35 cm |
| Volume | 1070 cm3 |
| Internal operating pressure (absolute) | 125 kPa |
| Transport Gas | |
| Composition | He ( N2), |
| plus NaCl aerosol | |
| Viscosity [12] | 2.0 std. atm. s |
| Mass Flow Rate (Q) | 250-300 std. atm. cm3/s |
Figure 2: The basic features of the 8Li calibration source. Radioisotope is produced using fast neutrons impingent on a 11B-enriched target. Helium gas containing NaCl aerosol is used as a transport medium to carry 8Li from the target chamber to the decay chamber, where 8Li decays give off -particles, which escape into the SNO detector volume, and -particles, which are tagged within the decay chamber.
Figure 3: The target (production) chamber, in situ about the neutron source. Gas flows into the volume through holes in perforated distribution plates. A thin cylinder of 11B-enriched boron in polyethylene sits inside the gas volume, and a thin layer of boron nitride coats the ouside of the gas volume. 8Li atoms recoil into the gas volume and are swept by laminar flow to a series of holes around the circumference of the chamber, which connect to the output line.
Figure 4: Partial efficiencies for exiting the target chamber, transport across the capillaries, and the efficiency for the decay in the trigger chamber are shown for different transport tube diameters. Also given is the overall efficiency.
Figure 5: The 8Li decay chamber. Two thin hemispheres of spun stainless steel are electron-welded together to create the decay volume at the bottom. These are in turn welded to the “neck” which holds the gas fixtures, and has a central hole for a 4.86 cm diameter acrylic window. Atop this window is a 3.81 cm diameter PMT. The PMT and gas fittings are contained within a sealed stainless steel endcap. Gas flows both in and out near the top of the volume. The top of this endcap holds the end of the umbilical (sealed with compressed O-rings). The source is supported from above by the SNO source manipulator system. Measurements are given in centimeters.
Figure 6: The integrated charge and time of signals coming from the decay chamber PMT for 47823 tagged events. Contaminant -particles are clearly distinguishable from the scintillation signal from 8Li. The line shows the cut used to discriminate against contamination events.
Figure 7: The Nhit spectra are shown for all source-related events within the detector during 8Li runs. (Note this spectrum is dominated by the 16N gamma contamination described in the text.) Also shown are spectra after cuts on the decay chamber PMT signal designed to distinguish tagged contaminant events from the tagged 8Li events.
Figure 8: The Nhit spectrum of tagged 8Li events is shown compared to a SNO Monte Carlo prediction of the source. The Monte Carlo energy scale was tuned using the 16N calibration source.
Figure 9: The left plot shows the x-z projection of reconstructed positions of 15k events for two placements of the 8Li source in the SNO detector, (x=-16 cm,y=24 cm,z=0 cm) and (x=-16 cm,y=24 cm,z=450 cm). The right plot shows a histogram of the distance between the source center and the reconstructed event positions for the z=0 cm position (solid circles) and the z=+450 cm position (open circles). (The center of the acrylic vessel is defined to be at (0,0,0) and the z-axis is vertically upwards.)


References
- [1] J. Boger, et al., The Sudbury Neutrino Observatory, Nucl. Instrum. Meth. A449 (2000) 172–207
- [2] V. S. Shirley (Ed.), Table of Isotopes, 8th Edition, Wiley-Interscience, 1996
- [3] D. H. Wilkinson, D. R. Alburger, Decay of 8Li and 8B: The Second-Class Current Problem, Phys. Rev. Lett. 26 (1971) 1127
- [4] G. Jonkmans, I. Towner, B. Sur, 8Li electron spectrum versus 8B neutrino spectrum: Implications for measuring neutrinos with a heavy water detector, Phys. Rev. C 58 (2) (1998) 1278
- [5] N. Tagg, The 8Li Calibration Source and Through-Going Muon Analysis in the Sudbury Neutrino Observatory, Ph.D. thesis, University of Guelph (2001)
- [6] B. Sur, E. Earle, R. Deal, E. Gaudette, 8Li: A Calibration Source for SNO, Tech. Rep. SNO-STR-95-054, A.E.C.L. Chalk River Laboratories, Chalk River, (unpublished) (1995)
- [7] A. Hamer, G. Jonkmans, B. Sur, N. Tagg, R.Deal, First Run of the SNO 8Li Calibration System, Tech. Rep. SNO-STR-96-029, SNO, (unpublished) (1996)
- [8] C. D. V. McLane, P. Rose, Neutron Cross Sections Volume 2, Academic Press, 1988
- [9] M. R. Dragowsky, et al., The 16N Calibration Source for the Sudbury Neutrino Observatory, Accepted for publication by Nucl. Instrum. Meth. A
- [10] C. M. V. Atta, Vacuum Science and Engineering, McGraw Hill, 1965
- [11] R. B. Bird, W. E. Stewart, E. N. Lightfoot, Transport Phenomena, John Wiley and Sons, 1960
- [12] D. R. Linde (Ed.), CRC Handbook of Chemistry and Physics, 76th Edition, CRC Press, 1996
- [13] J. Birks, The Theory and Practice of Scintillation Counting, Oxford, Pergamon Press, 1964
- [14] Q. R. Ahmad, et al., Measurement of the rate of interactions produced by 8B solar neutrinos at the Sudbury Neutrino Observatory, Phys. Rev. Lett. 87 (2001) 071301
- [15] M. Neubauer, Evidence for electron neutrino flavor change through measurement of the 8B solar neutrino flux at the Sudbury Neutrino Observatory, Ph.D. thesis, University of Pennsylvania (2001).