In Search of the (or “”) Meson: New data on Production by and on Hydrogen111Contribution to the International Workshop on Chiral Fluctuations in Hadronic Matter, Orsay, France, September 2001.
Abstract
We present preliminary results on the cross sections and Dalitz-plot densities for the process from threshold to MeV/ as well as for and at to 750 MeV/. We have found that . The Dalitz plots are very nonuniform, expecially for the higher , with a high concentration of events on an “island” around 1.2 GeV and 0.1 GeV peaking at high invariant mass. This is indicative of the dominant role of the resonance in the final state.
The Dalitz plots are strikingly similar to the ones for except that the island is concentrated at 1.38 GeV and has a narrower width, GeV. This indicates the dominant role of the resonance. The similarity in the Dalitz plots and the proportionality of the total cross sections are an impressive testimony of the applicability of broken flavor symmetry to reaction dynamics. We have measured and observed that the Dalitz plots for these processes are very different. The Dalitz plots for show some enhancement at low invariant mass, and there is good indication for the intermediate state but there is no island; at the highest , there is some evidence for the intermediate state. The above features of production by and can all be understood if production is small.
1 INTRODUCTION
The state, , is the chiral partner of the meson. The original symbol for the is the . To minimize mixups when discussing the production of the and the in the same reaction we will use the symbol . This is the notation employed by the Particle Data Group [1]. The is a broad and not well-determined state; recommended in [2] are a mass around 500 MeV and width in the vicinity of 500 MeV also. The large width ensures that the decays inside the nucleus in which it is produced. The is a prime candidate to investigate hadron medium modifications which have been the subject of much theoretical discussion as witnessed in this workshop. The medium modifications include a change in the mass and width when the hadron is embedded in nuclear matter of sufficiently high density. The decays into two pions. The decay mode is particularly attractive as two ’s must be in an even and state. This avoids the troublesome =1 contribution which is present in experiments with the final state. Furthermore, ’s can be measured by the 2 decay at all kinetic energies down to MeV. This leads to a high and uniform acceptance for the system at all invariant masses down to 270 MeV.
We present preliminary results on production in the process from threshold to MeV/, and for and at MeV/. These three reactions, together with flavor symmetry, are very useful for probing the reaction mechanism responsible for production. It will help in the investigation of the unexpected claim [3, 4] that medium modification of the meson was sighted in production by at 400 MeV/ on ordinary nuclei of standard nuclear density.
2 THEORETICAL CONSIDERATIONS
At the beam momenta of this experiment the production process,
| (1) |
is expected to be dominated by -channel amplitudes leading to formation. The subsequent decay can occur in two different ways:
-
a)
by the decay of an intermediate state meson, the :
(2) -
b)
via the decay of a second intermediate state baryon resonance, the :
(3)
The pole and contact terms are small and may be ignored. Reactions (2) and (3) are interwoven with one another by final state interactions which are energy dependent. The interaction is dominated by -wave scattering controlled by the phase. The cross section for scattering increases monotonically from threshold to the peak of the , presumably around 500 MeV. scattering reaches a huge peak when = 1232 MeV which corresponds to = 227 MeV/ in the c.m. At low energy we expect the scattering to be bigger than scattering, and the reverse at higher energies.
The final state of the reaction will be described using a Dalitz plot in which the vertical axis is the invariant mass squared of the system, , and the horizontal axis is the invariant mass squared of the system, . The final state features two identical ’s. Thus, if the process is followed by we don’t know which is or . This complication can be handled by making two entries in the Dalitz plot, recording both the and options. All our Dalitz plots have and are handled this way.
Figure 1a shows a Monte Carlo, MC, generated Dalitz plot, DP, for for GeV and GeV with a Breit-Wigner shape at GeV/.

This DP is characterized by a strong horizontal band around , which has a uniform density along the axis. The uniform density is a typical feature of the -wave decay of the state without interference.
Figure 1b shows another MC DP, for GeV, GeV, also with a Breit-Wigner shape at GeV/. There is a broad horizontal band which is uniform in horizontal slices. The density increases with increasing , it is the consequence of choosing 0.7 GeV.
The expected DP for pure production, Eq. 3, is shown in Fig. 2.

For the MC we used a Breit-Wigner shape of the with 1.2 GeV and 0.1 GeV. For simplicity, we used an isotropic decay of the . Since the MC calculation knows” which of the two ’s belongs to the we can investigate the consequences of our way of handling the two identical ’s. For the correct choice, shown in Fig. 2a, one finds the expected, uniform vertical band. The wrong choice results in a slightly slanted vertical band, see Fig. 2b. This wrong band may be constructed as the reflection of the correct band on the symmetry line that characterizes every DP in which two particles are identical. The symmetry line is a straight line connection to . For every event one entry will be on the left, the other on the right side of the symmetry line at equal distance. The sum of Figs. 2a and 2b is shown in Fig. 2c. It is a broadened, somewhat less slanted band than in Fig. 2b. It is clear now that the projection of the Dalitz plot content on the axis does not show the correct mass and width of the These may be obtained by unfolding the double entry feature of the DP, which we will do using a Monte Carlo based technique.
As the decay is simulated with an isotropic distribution, the bands in Figs. 2a and 2b are of uniform density. Since the production reaction is actually via the DP density distribution must reflect the angular momentum involved in the and decay. The intermediate state resonance can be the Roper, , which requires an transition to the state. It could also be the which implies and even the which needs .
The energy dependence of the total cross section for production should reflect the production rate of the different resonances. Thus, we expect that will show a steady increase from threshold to our maximum beam momentum of 750 MeV/.
The full QCD Lagrangian, , may be divided into two parts,
| (4) |
The first part, , depends only on the quark and gluon fields, but not on the quark masses; the second part, , depends on the magnitude of the current quark masses. In the limit of massless quarks is equal to which is the same for all quarks. This is the famous (quark) flavor symmetry of QCD. It implies that in the limit of massless quarks the interaction of two systems of particles which differ only by the replacement of a -quark by a -quark but otherwise have the same flavor symmetry are described by the same and thus have identical strength. This means that both reactions will have the same cross section, identical DP’s, polarizations, and so forth. In the real world the quarks have masses and flavor symmetry is broken. The breaking is given by the mass term of the full . Limiting ourselves to the three light quarks it is simply
| (5) |
acts mainly as a correction to . In the following we will make the quark-model assumption that light mesons are and light baryons states. Recently a stunning case of the applicability of (broken) flavor symmetry was observed. It is the (semi) quantitative agreement between the characteristics of threshold production, , , , etc. of the flavor-symmetric reactions and [5, 6].
Now we would like to compare production via the -meson intermediate state:
| (6) | |||
| (7) | |||
| (8) |
The incident and belong to the same pseudoscalar meson octet. The final state and belong to the same baryon octet. The allowed , , and intermediate states also belong to the same baryon octets, see table 1. Thus, if production would occur dominantly via the intermediate state, we would expect that the three reactions in Eqs. 6–8 have similar DP density distributions and comparable cross sections. Specifically, without correcting for the different SU(2) and SU(3) C-G coefficients and phase spaces, we have
| (9) |
On the other hand, production may occur by sequential baryon resonance deexcitation:
| (10) | |||
| (11) | |||
| (12) |
The initial and the final states are flavor symmetric. The and in Eqs. 10 and 11 belong to the same decuplet thus they are flavor symmetric. We predict that the DP’s and cross sections will be similar for and . breaking may be accounted for by comparing at incident beam momenta such that both reactions have the same . Also, we predict that the band in the DP should have three times the width of the band because . We also predict that
| (13) |
where is the product of the and Clebsch-Gordan coefficients and a phase space correction factor. The and are singlet states. There is no flavor symmetry between Eqs. 11 and 12, and we predict that the and DP’s will be different and also that
| (14) |
3 Experiment
2 production has been measured at the AGS at Brookhaven National Laboratory in the C6 line using a range of separated and beams up to 750 MeV/. The uncertainty in the absolute value of the incident beam momentum is ; is typically . The detector was the Crystal Ball (CB) multiphoton spectrometer, which consists of 672 separate NaI counters, 16 deep, it covers of the full solid angle. The CB has good energy and angular resolutions: and . A liquid target is located in the hollow center of the ball. The target is surrounded by a plastic veto counter system for triggering on neutral final states. Details of the CB and the analysis are given in Ref. [6, 7, 8]. To measure it is sufficient to detect the four gammas from the decay. They are part of the four-gamma-cluster event sample. The is detected by the from its decay, thus the final state is found in the six-cluster events. The has one more gamma from decay, thus the final state is a seven-photon cluster event.
4 The total Cross Sections for Production
The preliminary results obtained in the Crystal Ball experiment for at 17 incident momenta, and for and at eight incident momenta are shown in Fig. 3.

The variable which we use on the abscissa is the equivalent total energy , where for incident pions is the standard . For incident kaons we define . This is one of several ways for incorporating a correction for the - quark mass difference. We will use MeV obtained from the systematics of the baryon-multiplet masses [9]. Experimentally we have found that
| (15) |
in the span of 1.41 to 1.53 GeV. The difference in the phase space of the and final states is small and can be ignored here. Another way to correct for the - quark mass difference is by comparing at those incident beam momenta for which is the same. In the case at hand it gives very similar results to Eq. 15.
The agreement between the prediction presented in Eq. 13 and the data given in Eq. 15 demonstrates the applicability of flavor symmetry in production. This is a remarkable result as we are comparing the dynamics of three-body final-state reactions.
Figure 3 illustrates that is smaller than by a factor of 6 and more at the same . If these reactions would occur via production in the intermediate state their cross sections should be comparable, see Eq. 9. Our results are consistent with production by occuring by sequential baryon-resonance decay, Eqs. 10–12. After correcting for the mass difference our data give for the corrected total cross sections
| (16) |
using either the method of comparing at the after correcting for the difference in the and final states, or by comparing at the same , the latter is shown in Fig. 4.

We conclude from our data on production by that the does not play a major role. From Eq. 16 we may conclude that there is at most 20% production. Analysis of the Dalitz Plots in the following sections shows it is actually even smaller. To investigate the possible onset of chiral restoration it would be of interest to measure and production by on complex nuclei.
5 The Dalitz Plots
The DP’s for at 8 incident are shown in Fig. 5.

For convenience in the analysis we have divided the data into 2 sets of , a high and a low .
The high set covers from 650 to 750 MeV/ when extends from threshold at 0.27 GeV to 0.59 GeV, while goes from threshold at 1.08 GeV to 1.40 GeV, thus, the is near the center of the DP. We have measured a total of nine DP’s in this range, but only five are shown in Fig. 5. All DP’s of the high set have the same gross features: the density is very non-uniform along both the horizontal and vertical axes. There is a high density region called an “island” located at in the upper part of the DP’s near the maximum allowed value. There is also a minor enhancement, it is called the “reef” at in the lower part of the DP’s near the threshold. There is no evidence for a horizontal band of uniform density which would reveal dominant production via the . The island and reef together form a slightly slanted vertical band along the line of symmetry of each DP which is shown as a dotted line in each of the DP’s of Fig. 5. If production takes place exclusively via the sequence
| (17) |
the centroid of the distribution is the centroid of the distribution which is indicated by a dashed vertical line. Since it is not known which is or we have plotted the distribution as well, its maximum is shown by the slanted dashed dotted line. Note that the distribution is the reflection of on the line of symmetry. The structrue of the DPs indicates that the reaction chain of Eq. 10 is the dominant one. The difference between Figs. 2 and 5 is likely the forward-backward asymmetry of decay which is seen in Fig. 5 as the island and the reef in each DP. The origins of this asymmetry are several, they include the angular momentum changes in the two decays in Eq. 10. This is the subject of a separate analysis.
For a simple qualitative analysis we have divided the DP’s at 750, 730 and 650 MeV/ into an upper half which contains the island, and a bottom half which includes the reef. We reproduced all six distributions by a Monte Carlo simulation in which we use the same value for the mass, namely 1.21 GeV and the same width of 0.10 GeV. These values are the pole position of the resonance.
The set of DP’s at low incident pion momentum ( MeV/) covers from 270 to 415 MeV and from 1.07 to 1.21 GeV. The latter implies that only the lower tail of the peak can contribute. Qualitatively, there is a large excess of events over phase space in the upper half, the island is broadened and the reef appears to be gone. The quantitative analysis of these DP’s is not yet completed.
6 The Dalitz Plots for
Figure 6 shows the DP’s of our data for all eight beam momenta.

The similarity in the density distribution of the DP’s (see Fig. 5), at similar (which is this case also means similar ) is stunning. It is a major triumph for flavor symmetry to relate the dynamics of two three-body final-state reactions. The chief difference between Figs. 5 and 6 is in the location of the center and in the width of the islands and reefs. The differences originate in the mass and width differences of the and , namely GeV and GeV, while GeV and GeV.
Seven of the eight DP’s belong to the high-incident-beam-momentum set, introduced in the previous section. This means each DP has an island and a reef which is determined by the mass and width of the intermediate state resonance. The value of covered in this part of the experiment extends from 0.27 to 0.46 GeV.
7 Dalitz Plots for
The DP’s for the eight CB measurements of are shown in Fig. 7.

Comparing Figs. 6 and 7 we see that the characteristic features of the and final state density distributions are very different. This can be expressed succinctly using the projection of the DP on the axis. This is exhibited in Fig. 8 for four beam momenta.

Added to the figure for comparison are the phase space distributions. Note that the projection on the axis is not affected by the double entry of each event on account of the two identical ’s. The projection plots for have a substantial excess of events over phase space in the upper range of , while for a small excess occurs in the lower range. This excludes a sizable contribution for MeV to production. Furthermore, applying again flavor symmetry, we conclude that the contribution to and must be minor.
Figure 9 shows the DP projection on the axis.
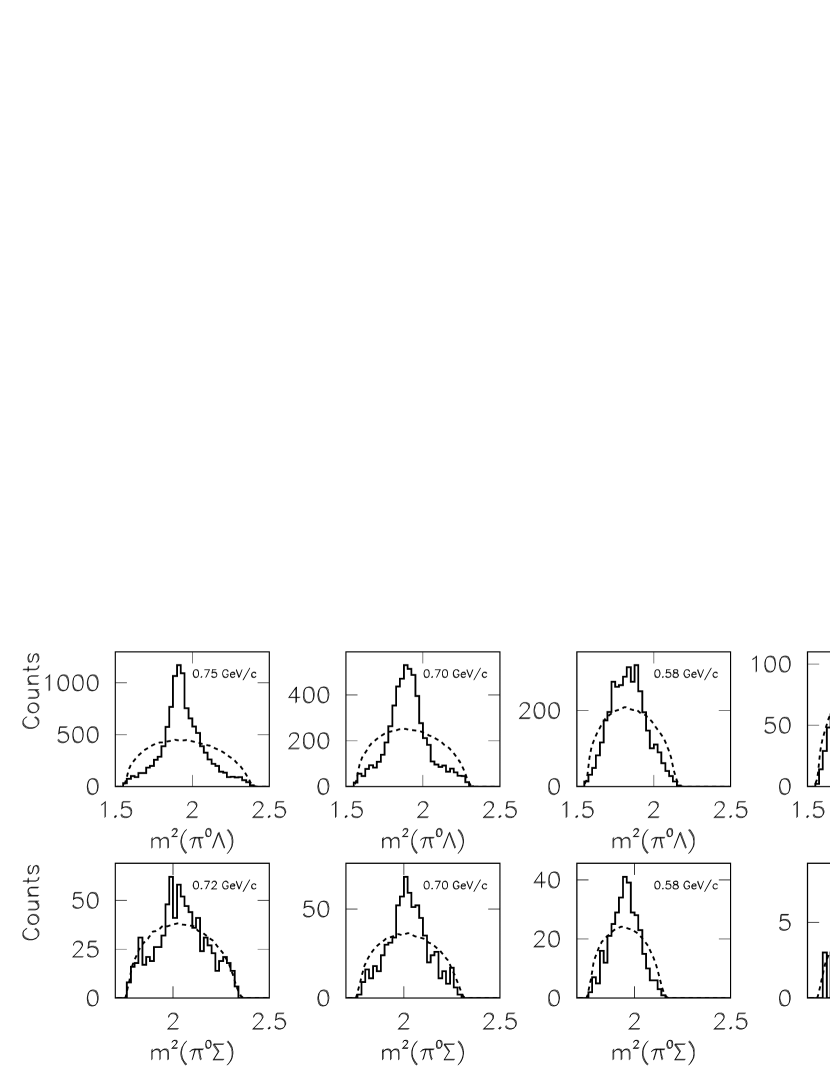
Recall that the spectra are distorted by the double entry of each event on account of the two identical s in the final state. At MeV/ the peak in is least distorted by the ambiguity, see Fig. 6. The position and width of this peak agree within error with the mass and width of the resonance, this reflects dominance in . For lower incident the peak in is broadened and is shifted to lower mass as expected, again see Fig. 6.
The large peak in centered around (1.4 GeV)2 in the bottom row of Fig. 9 reflects the dominance of the resonance in . The threshold for the production of this hyperon resonance is MeV/. At our lowest of 520 MeV/ we are close to threshold of the and expect a small cross section. This explains the smallness of at this energy, see Figs. 3 and 4. The decay into is an transition while decaying to is We speculate that this is at least in part responsible for the near uniform density of the band in the DP of Fig. 7 while there is a depletion (the island-reef structure) in the DP of Fig. 6.
The projection at = 720 MeV shows not only the dominant peak due to the in the final state but there are two other small enhancements. One is at ; it is due to the (1520) resonance. The other enhancement occurs at ; this is the predicted value for the reflection of the . The threshold is at MeV/. The onset of the production explains the rise in at the two highest ’s, see Figs. 3 and 4.
We conclude that is dominated by production, there is no direct evidence for production for 450 MeV. From the Dalitz plot distribution we estimate that production is far less than 50%. Using the total cross sections and applying flavor symmetry this implies that production in as well as in is less than 10%. More precise values require more extensive analysis which is under way.
8 Summary and Conclusions
The reaction is dominated by production, specifically the and for high also the resonance. The spectrum peaks at low , see Fig. 8. The shape is “opposite” to the spectrum expected if the (or “”) plays a significant role, that would result in a peak of the DP projection at high . A very conservative upper limit for a possible direct contribution of a with MeV in is half, but likely it is much smaller. The comparison of the measured total cross sections, together with flavor symmetry places an upper limit of 10% on the contribution to and to for MeV. This is consistent with the DP distributions for these two reactions. The and DP’s have very non-uniform density distributions which we have described as an “island” and a “reef”. They are due to the preponderance of the in the final state and the in . The DP’s show that the distribution of events in the spectra are not due to the presence of an but due to the formation of either the or the .
Our results on production on hydrogen imply that the change in the shape of the distributions in production reported for some complex nuclei are not due in first order to a proposed modification of the of a mass of about 550 MeV in the nuclear medium. They are more likely the result of final state interactions of the pions and the recoil baryon states.
The remarkable similarity in the density distribution of the and final states is a convincing proof of the applicability of flavor symmetry to appropriate three-body final state reactions, as is the relation
| (18) |
Flavor symmetry does not apply to the and final states so we are not surprised that they have quite different DPs and unequal cross sections.
References
- [1] D.E. Groom et al., Eur. Phys. J. C15, 1 (2000), and 2001 off-year partial update for the 2002 edition available on the PDG WWW pages (URL:http://pdg.lbl.gov/).
- [2] S. Ishida et al. (eds.), YITP Sigma Meson Workshop (June 2000), Kyoto, Japan. Proceedings at (http://amaterasu.kek.jp/YITPws).
- [3] F. Bonutti et al., Phys. Rev. Lett. 77, 603 (1996).
- [4] F. Bonutti et al., Nucl. Phys. A677, 213 (2000).
- [5] B.M.K. Nefkens, in Proceedings of the Workshop on the Physics of Excited Nucleons, Mainz, Germany, 2001, edited by D. Drechsel and L. Tiator (World Scientific, Singapore, 2001), p. 427.
- [6] A. Starostin et al., Phys. Rev. C 64, 055205 (2001).
- [7] K. Craig, Ph.D. dissertation, unpublished.
- [8] A. Starostin et al., Phys. Rev. Lett. 85, 5539 (2000).
- [9] B.M.K. Nefkens, in Proceedings of the 7th International Conference on the Structure of Baryons, Santa Fe, NM, 1995, edited by B.F. Gibson et al. (World Scientific, Singapore, 1996), p. 177.