Lambda production in 40 A GeV/c Pb-Au collisions
Abstract
During the 1999 lead run, CERES has measured hadron and electron-pair production at 40 A GeV/c beam momentum with the spectrometer upgraded by the addition of a radial TPC. Here the analysis of and will be presented.
1 Introduction
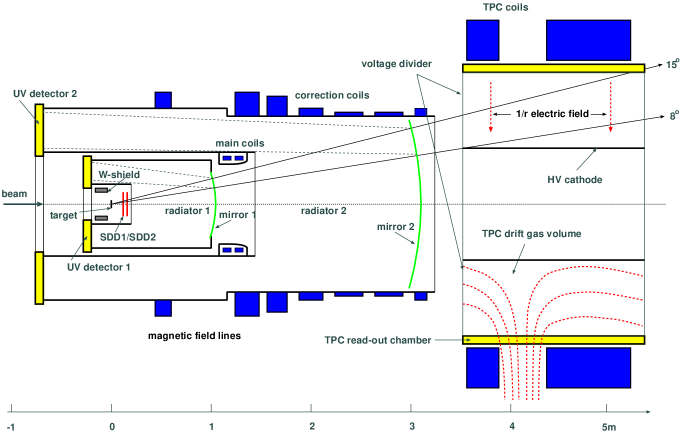
CERES/NA45 is an experiment at the CERN SPS dedicated to measure low-mass e+e- pairs near midrapidity in ultrarelativistic nuclear collisions [1]. The CERES spectrometer (Fig. 1) covers the full azimuthal acceptance in the polar angle region between . The high electron identification capability allows to separate the rare leptonic signals from the large hadronic background; it is provided by two ring-imaging Cerenkov counters (RICH). Precise tracking of charged particles and vertex reconstruction are provided by two silicon drift detectors (SDD1,2) located behind a segmented Au target. This detector system is also used as a multiplicity trigger to get information on the centrality of the collision.
In order to improve the momentum resolution the CERES experiment has been upgraded [2, 3] during 1998 by the addition of a new magnet system and a Time Projection Chamber (TPC) with a radial electric drift field. The TPC is operated inside an inhomogeneous magnetic field with a maximal radial component of 0.5 T, and provides the measurement of up to twenty space points for each charged particle track. Besides a precise determination of the momentum the TPC also provides additional electron identification via dE/dx. The magnet system between the two RICHes was not operated in the upgraded configuration.
The addition of the TPC substantially improves the hadron capability of the CERES spectrometer allowing a systematic investigation of hadronic observables around midrapity. In the fall of 1999 the upgraded CERES spectrometer was operated for the first time and semicentral Pb+Au collisions at 40 A GeV/c beam momentum were recorded. Because of a not yet completely functional read-out system this data set is limited in terms of statistics and momentum resolution. In the fall of 2000, the CERES spectrometer was fully operational with a very good overall performance, and central 158 A GeV/c Pb+Au events were recorded. In this paper we will focus on the analysis of the 40 A GeV/c data set.
2 Analysis of the hyperon signal
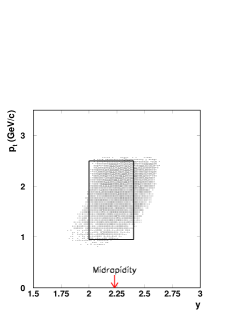
In this analysis we have used only the information from the SDD’s and the TPC. The hyperon and its antiparticle were identified by reconstructing their decays into final states containing only charged particles: and . The geometrical acceptance for the measurement is shown on the left side in Fig. 2. We have also analyzed negatively charged particles (h-) and proton-like positive net charges, shortly denoted as [4].


The momentum of charged particles is determined from their curvature in the TPC. Since we are not applying any particle identification method in the extraction of the strange particle signals we run through the combinations of all positive tracks with all negative tracks measured in the TPC assuming a decay hypothesis and calculate the invariant mass spectrum. In the same manner, the combinatorial background is evaluated using the mixed event method.
To get a significant signal we had to reduce the large combinatorial background using different types of cuts discussed in the following.
Discrimination from target tracks: Taking into account the proper decay length = 7.89 cm of the and the -factor of about 5 for the TPC acceptance, the decay length in the laboratory is 40 cm. This means that more than 70 % of all produced in the target decay after the SDD’s (the distance between target and SDD2 is about 13 cm). To enhance the signal-to-background ratio, an optional cut requiring the absence of matching tracks in the SDD is used.
Reconstruction of secondary vertex: In a second step, the decay vertex in z-direction (beam direction) is reconstructed for all candidates by back-extrapolation of the TPC tracks and computing the point of their closest approach. This procedure was tested using a simulation. The result is shown in Fig. 2, right. This reconstructed secondary vertex is used in the analysis for an additional (optional) cut cm. At this threshold, the resolution in is 12 cm.

Right: Number of reconstructed as a function of the decay length.
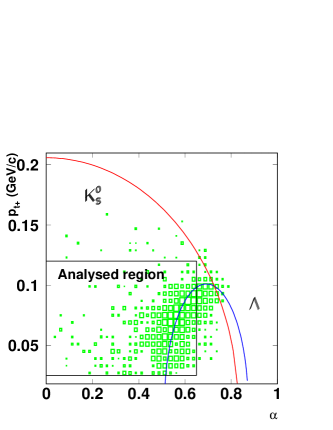
Kinematical cuts: The extraction of the strange-particle signal is performed using geometrical and kinematical constraints. A fiducial cut of 130 240 mrad was placed on individual tracks. Due to a loss in tracking efficiency at low momentum, a lower transverse-momentum cut of 250 MeV/c was introduced for negatives. These conditions affect the acceptance as shown in Fig. 2, middle. Additionally, a lower cut of 500 MeV/c for positives and an upper cut of 2.0 GeV/c for positives and 0.6 GeV/c for negatives are introduced since they cost no signal and reduce background. Also, only pairs with an opening angle greater 20 mrad are accepted. For a clean acceptance, we reject all hyperons with 0.9 GeV/c and 2.5 GeV/c. There is also a fiducial cut in rapidity: . Fig. 3 shows an Armenteros plot of the data and calculated lines for and K. In order to isolate clean particles, additional cuts were made on selecting 10 - 120 MeV/c and on the Podolanski-Armenteros variable selecting values below 0.65, i.e. only ’s where the proton is emitted backwards in the rest frame.
3 Consistency tests:
In Fig. 4, left, the invariant mass spectrum is plotted for three different methods analyzing the same events; (1) TPC in a stand-alone mode, (2) TPC plus SDD veto and (3) TPC plus SDD veto plus vertex cut. One can notice a loss in signal but a large improvement in the signal-to-background ratio as successive cuts are introduced. The signal, obtained after subtraction of combinatorial background, is fitted with a Gaussian. The fit parameters for all three methods are very similar, the average of mΛ = 1.117 0.001 GeV/c2 is close to the accepted value [5] and the resolution is = 11.2 0.4 MeV/c2.
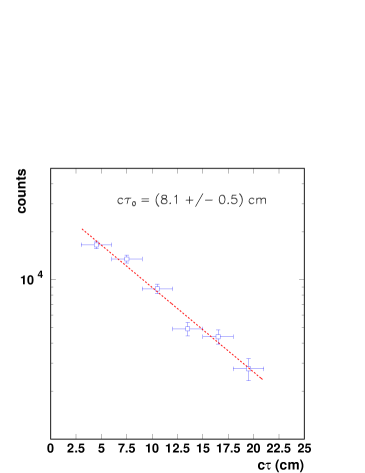
As an additional consistency test the acceptance corrected number of reconstructed ’s is plotted as a function of the decay length in the rest frame, as shown in the right part of Fig. 4. The superimposed solid line represents an exponential fit with a proper decay length = (8.1 0.5) cm, in good agreement with the accepted [5] value of 7.89 cm.


Right: Midrapidity density dNΛ/dymid as a function of the centrality of the collision. The plot shows data for the range of our measurement as well a an extrapolation to all (see text).
4 Centrality classes
The event sample was divided into three centrality classes according to the number of SDD1/SDD2 tracks as indicated in Tab. 1. Also indicated there are the corresponding fractions of the geometric cross section and the number of participants evaluated using the UrQMD model [7].
| mult. class | sdd1 | sdd2 | sdd3 |
| SDD-tracks | 100 - 200 | 200 - 300 | 300 - 400 |
| events () | 0.8 | 1.3 | 0.7 |
| (%) | 15 - 36.7 | 4.8 - 15 | 4.8 |
| mean | 237 | 328 | 384 |
5 Results
The experimental data were corrected for the geometrical acceptance and reconstruction efficiency. In Fig. 5, left, the corrected but un-normalized spectra are presented in different multiplicity bins for two different analysis methods. The invariant multiplicity is fitted with an exponential distribution , also shown in Fig. 5.


Right: Mass dependence of inverse slope for the most central collisions. The CERES results for 40 A GeV/c (present data and [4]) are shown together with the systematics for full SPS energy [8]
The dependence of the inverse slope parameter TΛ on the number of participants Npart is presented in Fig. 6, left. The measured values of TΛ exhibit a slight but not very significant increase as a function of centrality. As shown the slopes are close to those observed at top AGS and SPS energies. The measured values are not well reproduced by the UrQMD model (line in Fig. 6), as also observed for the slopes of the proton spectra [4]. The mass dependence of the inverse slope is presented in Fig. 6, right. Within errors, our present data agree with the systematic behavior of measurements at top SPS energies [8]. The large differences between the slopes (T = 176 5 MeV, T(+)-(-) = 278 12 MeV and TΛ = 273 20 MeV) indicate the presence of a strong radial flow also at 40 A GeV beam energy [4].
The midrapidity density dNΛ/dymid has been obtained by extrapolating the transverse momentum spectra to pt = 0 using the functional form given above. On the right side of Fig. 5 the rapidity densities in the measured pt interval as well as extrapolated to pt = 0 are presented as a function of centrality. A continuous rise with centrality is observed. In our most central multiplicity class we determine a total midrapidity density dNΛ/dymid = 11.8 2. A somewhat larger value of about 15 is reported by the NA49 collaboration [6]. Putting our present data into context with measurements at lower and higher beam energy, a continously rising behavior is seen as a function of (see Fig. 7, left).


Right: ratio as a function of the beam energy (other data from [12, 13, 11, 14]).

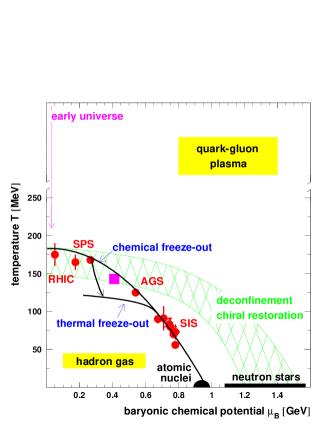
Right: Phase diagram of nuclear matter [18] with the present data point for 40 A GeV (square symbol).
We have also extracted the signal for the . But due to the low statistics it is not possible to show transverse momentum spectra for . Since all corrections are symmetric for particle and antiparticle, they cancel in the ratio and we obtain RΛ = = 0.024 0.010. The dominant error is statistical. Our result is in good agreement with the value recently reported by NA57 [13], albeit with a much larger statistical error for our present result. The ratio as a function of (Fig. 7, right) shows the expected steep rise with increasing beam energies; for a net-baryon-free region the antiparticle/particle ratio is expected to be one and at RHIC energies this values is approached.
Information about the chemical freeze-out parameters of the expanding system, the temperature T and the baryonic chemical potential , can be obtained from the ratios of particle yields. Utilizing the thermal model of [15] we have calculated several particle abundancies corresponding to the phenomenological condition [16] of fixed average energy per hadron of 1 GeV between top AGS and SPS energies, characterized by a parameterization in /T. The comparison of computed and measured particle ratios is presented in Fig. 8, left. Taking the different measured particle ratios into account we could extract the mean ratio /T = 2.8. Following the Cleymans-Redlich freeze-out curve [16], this corresponds to values of = 410 30 MeV and T = 143 5 MeV. This result is shown in the phase diagram Fig. 8, right. The chemical freeze-out point at 40 A GeV is near the phase boundary and falls into the systematics between top AGS and SPS energies.
References
References
- [1] Agakichiev G et al CERES Collaboration 1995 Phys. Rev.Lett. 75 1272; 1998 Phys. Lett.B 422 405; 1999 Nucl. Phys.A 661 23c
- [2] Agakichiev G et al Technical Note on the NA45/CERES upgrade 1996 CERN/SPSLC 96-50
- [3] Agakichiev G et al CERES Collaboration 1999 Nucl. Phys.A 661 673c
- [4] Appelshäuser H for the CERES Collaboration 2002 Nucl. Phys.A 698 253c
- [5] Groom D E et al Particle Data Group 2000 Eur. Phys. J. C 15 1
- [6] Kadija K et al NA49 Collaboration these proceedings
- [7] Bass S A et al 1998 Prog. Part. Nucl. Phys. 41 225; Bleicher M et al 1999 J. PhysiqueG 25 1859
- [8] Stachel J 1999 Nucl. Phys.A 654 119c
- [9] Ahmad S et al E891 Collaboration 1996 Phys. Lett.B 382 35
- [10] Filimonov K for the E877 Collaboration 1999 Nucl. Phys.A 661 198c
- [11] Antinori F et al WA97 Collaboration 1999 Eur. Phys. J. C 11 79
- [12] Back et al E917 Collaboration 2001 Phys. Rev. Lett. 87 242301
- [13] Carrer N for the NA57 Collaboration 2002 Nucl. Phys.A 698
- [14] Xu Z for the STAR Collaboration 2002 Nucl. Phys.A 698 (Preprint nucl-ex/0104001)
- [15] Braun-Munzinger P, Heppe I, and Stachel J 1999 Phys. Lett.B 465 15
- [16] Cleymans J and Redlich K 1999 Nucl. Phys.A 661 379c
- [17] Seyboth P for the NA49 Collaboriation 2001 Proc. 17th Winter Workshop on Nuclear Dynamics
- [18] Braun-Munzinger P and Stachel J 1996 Nucl. Phys.A 606 320; and these proceedings