The 16N Calibration Source for the Sudbury Neutrino Observatory
Abstract
A calibration source using -rays from 16N (t1/2 = 7.13 s) -decay has been developed for the Sudbury Neutrino Observatory (SNO) for the purpose of energy and other calibrations. The 16N is produced via the (n,p) reaction on 16O in the form of CO2 gas using 14-MeV neutrons from a commercially available Deuterium-Tritium (DT) generator. The 16N is produced in a shielding pit in a utility room near the SNO cavity and transferred to the water volumes (D2O or H2O) in a CO2 gas stream via small diameter capillary tubing. The bulk of the activity decays in a decay/trigger chamber designed to block the energetic -particles yet permit the primary branch 6.13 MeV -rays to exit. Detection of the coincident -particles with plastic scintillator lining the walls of the decay chamber volume provides a tag for the SNO electronics. This paper gives details of the production, transfer, and triggering systems for this source along with a discussion of the source -ray output and performance.
, , , , , , , , , , , , , , , ,
PACS: 26.65.+t Solar Neutrinos; 29.25.Rm Sources of Radioactive Nuclei; 29.40.Mc Scintillation Counters; 23.20.Lv Gamma Transitions and Level Energies
Keywords: Sudbury Neutrino Observatory; Solar Neutrinos; Radioactive Source; Energy Calibration; 16N -decay
Corresponding Author: M.R. Dragowsky, MS J514, Los Alamos National Laboratory, Los Alamos, NM 87545. Telephone: (505) 667-4461, Fax: (505) 665-4121, Email: dragowsky@lanl.gov.
1 Introduction
The Sudbury Neutrino Observatory (SNO) is a heavy water Čerenkov detector designed primarily for the detection of solar neutrinos. SNO identifies neutrinos via the detection of Čerenkov light from energetic electrons produced by charged current (CC) and elastic scattering (ES) interactions, and neutron capture -rays resulting from the neutral current (NC) interactions. It does this with an array of 9500 photomultiplier tubes surrounding the D2O target volume (1 kilo-tonne) which is contained within a 12 m diameter acrylic vessel. The entire assembly is immersed within a 7 kilo-tonne water shield and located under 2100 m of rock in INCO’s Creighton mine near Sudbury, Canada. A complete description of the SNO detector and its many subsystems is presented in reference [1]. A short description of the SNO energy response will be presented here to provide the context for the discussion of the 16N calibration source.
A measure of SNO’s energy is the number of photomultiplier tubes registering as hit in an event, Nhit. In addition, the hit pattern (in time and space) provides the information that can be used to reconstruct event interaction position, direction, and energy. Nhit and the associated hit patterns are dependent not only on the amount of light (number of photons) produced via the Čerenkov process, but also on the details of the detector optics and the response of the individual photomultiplier tubes. A proper understanding of the light production, propagation, and detection is required in order to understand the response of the detector to neutrinos, muons and radioactive backgrounds. Therefore a detailed Monte Carlo modeling of the detector was developed along with an extensive program for optical and energy calibrations. A discussion of the Monte Carlo and the overall program for detector calibration can be found in [1].
The response of the SNO detector is calibrated using a variety of sources providing isotropic light [2, 3, 4], -rays [5, 6, 7, 8], -particles [9, 5], and neutrons. The present work describes one of these sources which provides nearly mono-energetic, primarily 6.13 MeV, -rays following the -decay of 16N. The high-energy -rays are used for a number of calibration tasks, including the primary energy scale calibration, verification of the energy resolution and energy scale position dependence, and verification of reconstruction and data reduction algorithms. A feature essential to the calibration analysis is detecting the -particle coincident with the , allowing calibration event identification. The 16N -decay is also used as an untagged calibration source for the SuperKamiokande imaging H2O Čerenkov detector [10].
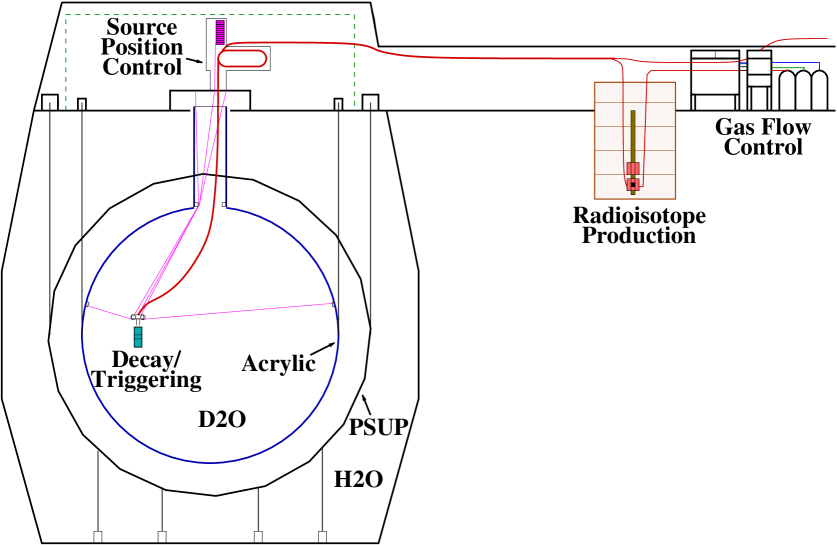
The four major systems that comprise the 16N calibration source are illustrated in Fig. 1. The source positioning system is common to all SNO calibration devices and has been discussed in [1]. The other systems, however, are unique to the 16N source and are therefore described in this paper. Earlier discussions of the systems can be found in [5, 6]. The systems used to produce and transport the short-lived 16N are discussed in Section 2 and Section 3, respectively. The design of the decay/trigger chamber (hereafter referred to as the decay chamber), where the 16N decays and is tagged, is described in Section 4. The -ray output and how it is influenced by the decay chamber geometry is discussed in Section 5. Finally, in Section 6, the complete source performance is demonstrated with laboratory measurements and calibration data obtained in SNO.
2 16N Production
SNO uses a commercially available DT generator, the MF Physics model A-320 [11], to produce fast neutrons. A DT generator is a miniature particle accelerator that generates 14-MeV neutrons by accelerating a mixed beam of deuterium and tritium onto a target containing both deuterium and tritium. This results in the fusion reaction
| (1) |
where the neutrons produced are emitted nearly isotropically.
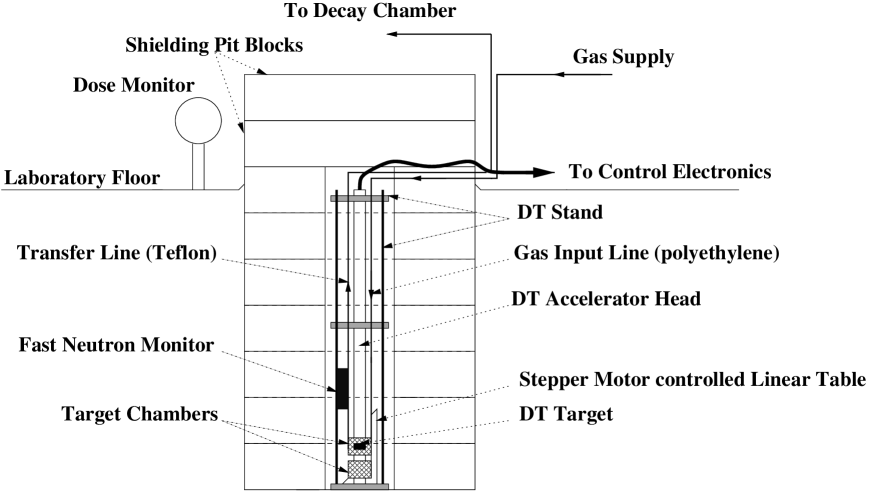
The A320 was chosen because of its relatively large neutron flux (tunable between 2x10⁷ and 1x10⁸ per second) and the compact dimensions of the accelerator permitting increased incident flux through the production chambers (see below). The accelerator is cylindrical, 2.2 m long, with a diameter of 4.29 cm. The DT target is placed 18.73 cm from the end of the accelerator tube. It is mounted on a custom built stand and placed inside a concrete shielding pit located in a lab utility room 40 m away from the center of the deck above the SNO detector. The pit effectively eliminates any radiation hazard [12]. Fig. 2 shows the accelerator and its mounting stand inside the concrete shielding pit. Also shown are two annular target chambers surrounding the accelerator DT target used for radioisotope production, and a fast neutron detector for monitoring purposes. Both chambers are mounted on a linear table that can be moved remotely to optimize either chamber’s position relative to the DT target. This permits a maximal neutron flux through the chamber being used and hence a maximal radioisotope yield.
16N can be conveniently produced using 14-MeV neutrons via either the 16O(n,p) [Q = -9.64 MeV, = 35 mb], or the 19F(n,) [Q = -1.52 MeV, = 25 mb] reactions [13]. Liquid targets were initially favored because the greater mass density would provide much greater 16N yields [14]. The radioisotope transfer and the triggering with the -particle, however, was realized to be much simpler if a gas transfer system was used [15]. CO2 is therefore used as both target and carrier. Oxygen-containing (n,p reaction) and fluorine-containing (n, reaction) fibers were also tested for use in the gas target chambers with a variety of carrier gases (He, N2, air, etc) [5]. Certain fibers provided good yields but CO2 has proven adequate.
The target chamber design was a compromise between optimizing the 16N production and minimizing the residence time of the gas in the chamber (see Section 3), as well as constraints imposed by the accelerator and shielding pit configurations. An annular design was chosen for maximal solid angle coverage. The dimensions of the annulus were chosen to optimize the number of 16N atoms produced and entrained in the gas flow exiting (or escaping) the chamber. To estimate the production yield in the chamber a point source for the DT target was assumed. The yield per isotropically emitted neutron in the chamber volume elements was then calculated. Solving the integral over these volume elements results in the following equation for the overall yield [16, 5]
| (2) |
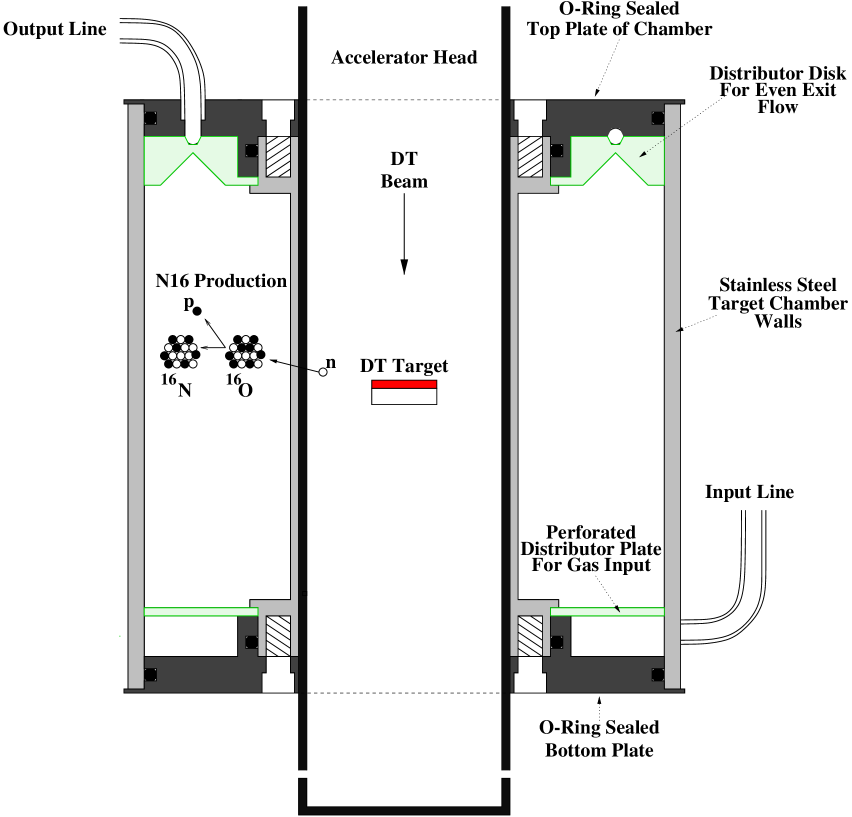
where is the cross section in cm2, is the gas density in atoms cm-3, is the half-height of the chamber, and and are the inner and outer radii, respectively. The method for estimating the efficiency for 16N to escape the chamber is given in the following section. Optimizing both production and escape efficiency, the dimensions were chosen to be a 7.9 cm length and a 11.44 cm diameter. Fig. 3 shows the main features of the final target chamber design including the target volume and the gas input and output lines. Included in the design are distributor plates at the top and bottom of the chamber designed to promote uniform flow of gas across the chamber.
3 The Transfer System
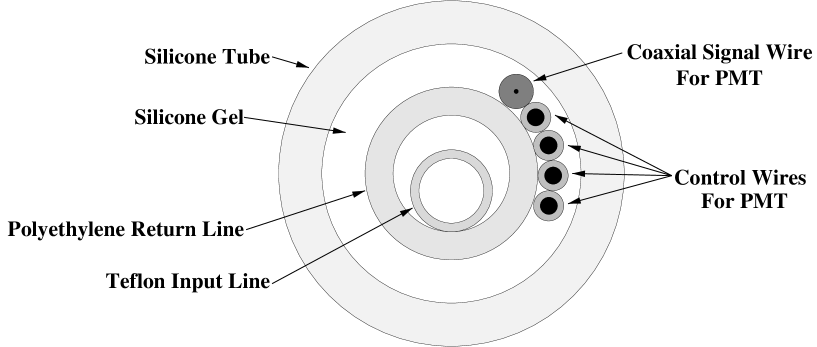
The purpose of the gas capillary transfer system is to transport the short-lived isotopes quickly from the target chambers to the deck above the detector, then down to the decay chamber inside the D2O or H2O volume. For 16N, CO2 from a compressed gas bottle is sent via polyethylene tubing to a control panel that directs the gas at the chosen flow rate and head pressure to the target chamber at the bottom of the pit. From there, the 16N produced is entrained in the gas stream and sent via Teflon tubing to the SNO deck above the detector. There, the gas flow is sent down an umbilical (see Fig. 4) a further 30 m through a thin-walled Teflon capillary to the decay chamber placed inside one of SNO’s water volumes. The return flow is sent back up to the deck through a polyethylene line in the umbilical. The capillary and polyethylene are arranged coaxially. From the deck, the flow is sent back to the control panel via polyethylene tubing where it can be sent to the lab exhaust.
The choice of capillary diameter, target and decay chamber volumes and operating pressure, and flow rate was to maximize the yield as well as take into consideration the practical constraints imposed by the source deployment, available capillaries, and gas supply limitations. The overall efficiency is the product of the target chamber escape efficiency, the transfer efficiency across the capillary, and decay chamber efficiency. The methods used to estimate each of these efficiencies as a function of the design and operating variables are given below.
To estimate the efficiency for 16N to escape the target chamber, , as well as the efficiency for 16N to decay in the decay chamber, , a full mixing model is assumed for the gas flow through these volumes (laminar flow models have also been considered). In the full mixing model, the following balance equation can be used
| (3) |
where is the number of radioactive atoms present at any given time, is the production (or injection) rate of the radioactive atoms in the target (or decay) chamber volume, . is the mean decay rate for 16N, and the last term is the rate at which gas is swept out of the volume. This general equation can be easily solved for the steady state, , and using
| (4) |
where is the mass flow rate, and are the mean volume turnover rate, and mean turnover time, for the gas in the chambers. The equilibrium number of radioactive atoms inside the volume then becomes
| (5) |
and therefore the injection/production rate is given by
| (6) |
Using the ratio of the rate at which radioactive atoms exit the target volume, , and the production rate where () is given by () in this instance for Equation 6, the target chamber efficiency becomes
| (7) |
Here is calculated from
| (8) |
where is the chamber presssure and the volume.
The efficiency for radioactive decay in the decay chamber is taken from the ratio of the rate at which the radioactive atoms decay inside the volume, , to the injection rate where in this instance for Equation 6, so
| (9) |
with
| (10) |
In Equation 10, is the decay chamber pressure and is the decay chamber volume.
To calculate the transfer efficiency across the capillary, , the transit time is first calculated using
| (11) |
where is the pressure along the tube length, is the mass flow rate, and is the capillary cross sectional area. For 16N transport, flow is in the turbulent regime so the average pressure between the target and decay chambers is used for as an approximation. Given the above, one can estimate the fraction of radioactive gas atoms that survive passing through the capillary, or the capillary transfer efficiency, , using
| (12) |
Given the results of studies with the above model and the choice of available capillaries and other geometric constraints, the system dimensions and operating conditions were chosen. These are summarized in Table 1 along with other parameters used to estimate the yield. Also given are the results of sample calculations for the various efficiencies and yield. Note that the primary transfer line consists of two segments, and , with cross sectional areas and , respectively. The second segment is used inside the umbilical and is the pressure at the junction of the two segments. The sample calculation using these values predicts that the yield should be roughly 460 16N triggers per second. It should be noted that this estimate is only approximate because of the various assumptions made, for example complete mixing in the target and decay chambers. Also, the ranging out of the 16N recoils in the target chamber is not taken into account, and finally slight deviations of the capillary diameters (few ) can strongly affect the calculated yield. Still, the calculations suggest that sufficient amounts of 16N should be produced for the chosen design parameters.
4 16N Decay Chamber Design
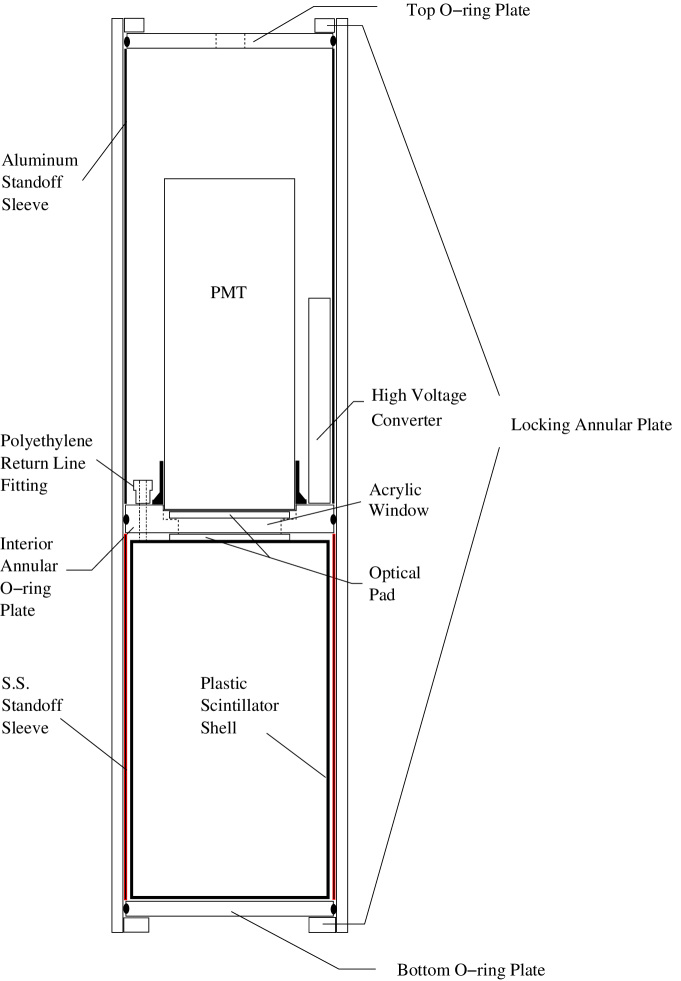
The 16N decay chamber design results from a compromise between the need to minimize -ray attenuation and maximize -particle containment. The design is illustrated in Fig. 5. The main casing is a smooth cylindrical tube of stainless steel that is 41.9 cm long, 10.16 cm in diameter and has a wall thickness of 0.476 cm. The stopping power in steel is 2 MeV cm2/g and 1.6 MeV cm2/g for 10 MeV and 3-4 MeV -particles, respectively. Therefore, the wall thickness selected for use in the decay chamber, together with the scintillator and sleeve material (described below), will greatly reduce the flux of emerging -particles.
The main casing achieves a gas seal using stainless steel top and bottom plates having grooves along the circumference to hold O-rings that seat on the inner surface of the tube. An interior annular plate with O-ring separates the chamber into upper and lower volumes. A 0.159-cm thick sleeve of stainless steel (aluminum) maintains a constant distance between the interior annular plate and the bottom (top) plate. The tube interior surface is threaded for a length of 1 cm at each end to accommodate threaded annular plates that back up the top and bottom plates, so that the O-rings cannot move when subjected to the decay chamber operating pressure. The casing diameter is constrained to fit within guide tubes that penetrate the deck in SNO, allowing calibration source deployment into the region between the PMT Support Structure (denoted PSUP in Fig. 1) and the acrylic vessel. The sealing design incorporating O-rings allows the maximum diameter casing for deployment through the guide tubes.
The 16N decays occur within a region bounded by a 3 mm thick cylindrical shell of plastic scintillator (Bicron BC400 [17], [18]) located in the lower volume. The scintillator is 15.24 cm in height and has outer diameter 8.89 cm. Gas is delivered to the decay chamber via the umbilical described in Section 3. The polyethylene return line is secured to a fitting atop the inner annulus. The inner Teflon capillary extends through the interior of the scintillator, causing 16N gas to be introduced at the bottom of the plastic scintillator. The outlet for the gas is the polyethylene return line tubing. A uniform distribution of gas and a long dwell time in the scintillator are promoted by introducing gas to the bottom and removing it from the top of the scintillator.
The upper volume contains a 5.08 cm diameter photomultiplier tube (Electron Tubes, Ltd. model 9208B [19]) that monitors the scintillator for light through an optical coupling in the interior annular plate. The PMT high voltage is generated using a high voltage converter (Spellman model MHV12-2.0K1000N [20]) that is collocated with the PMT. The high voltage converter requires 12 V input (obtained from the umbilical) and produces a maximum output of 2,000 V. Normal operations call for 1,200-1,500 V. The top plate has an aperture in the center to allow coupling to the umbilical. The umbilical-to-top plate connection is sealed externally using a sequence of three O-rings and pressure plates. Space is provided above the PMT in the upper volume for coupling of these items to their counterparts.
The optical coupling between the upper and lower volumes is achieved with a rigid acrylic window that occupies the central portion of the interior annular plate. An aluminum ring that makes an O-ring seal with the interior annular plate is used to mount the acrylic window. Coupling of the window to the scintillator is via a 0.318 cm thick optical pad. The window is coupled to the PMT by another optical pad. The PMT is secured using two springs that exert a force toward the optical pad. This arrangement allows for the PMT or scintillator to be independently separated from the optical coupling window. It also maintains a consistent alignment of the relative positions of the PMT and scintillator.
5 16N Decay Chamber Function and -Ray Emission
A simplified 16N decay scheme is presented in Fig. 6 [21]. The branch of primary interest for calibration produces a -particle with end point energy 4.3 MeV and a 6.1-MeV -ray (66.2%). There are other branches that produce -rays in coincidence with -particles (6%). There is also a direct branch to the ground state, resulting in a 10.4-MeV endpoint -particle without an associated -ray (28%). Thus, each -particle will produce a trigger for SNO, but not all triggered events constitute a valid calibration event.
The weak -decay branch to the 7.1 MeV excited state introduces an uncertainty into the mean -ray energy triggered by the source. This is due to the readout threshold imposed on the energy deposited in the thin-walled scintillator. Two distinct energy deposition modes (dE/dx and energy spectroscopy) compete to shift the mean energy either higher or lower, respectively. In the dE/dx case, energy deposition is greater for lower energy -particles, increasing the representation of the 7.1-MeV -ray in the mean. Alternately, energy deposition proportional to -particle energy favors the 6.1-MeV -rays, since that -spectrum is harder. Neither effect is expected to be large. The combined effect is evaluated through stepping the readout threshold through the scintillator spectrum during source characterisation in the SNO detector.
The 16N -rays must transit the decay chamber material before emerging into the heavy water of SNO. The following is a list of issues concerning the effect by the decay chamber material on the -ray emission spectrum.
-
•
-ray attenuation from interactions in the material.
-
•
-ray production following -particle bremsstrahlung in the material.
-
•
isotropy of the -ray emission spectrum.
The -ray emission spectrum is reduced in number and downgraded in energy relative to the production spectrum by the steel. The Monte Carlo emission spectrum is presented in Fig. 7. The 16N decay scheme -rays are denoted in the figure using vertical arrows. The -ray emission spectrum features a continuum background that must be accounted for when analyzing data from this source.
Energetic -particles may interact in the decay chamber material causing secondary -ray emission from the source due to bremsstrahlung. These -rays will generate Čerenkov photons that either sum with those from the primary 6.1-MeV -ray, or generate independent events associated with the decay to the ground state. The effect of bremsstrahlung on the 16N energy response has been studied in Monte Carlo and is found to be small. This result is expected because the cross sections for multi-MeV photon emission are themselves small. Inner bremsstrahlung in the decay of 16N has been neglected, as it is expected to be below in probability per decay.
The decay chamber geometry is cylindrically symmetric. It is therefore expected that the -ray emission spectrum will feature anisotropy in the polar angle. The SNO detector also exhibits a polar angle anisotropy due to the penetration through the PMT Support Structure (PSUP) by the Acrylic Vessel (AV) chimney. The SNO detector anisotropy in polar angle is more restricted than that of the 16N decay chamber, therefore, the anisotropy in the -ray emission spectrum will be due primarily to the decay chamber material.
Clearly, the chamber geometry will affect the energy output of the source. However, particle transport simulation concerning electromagnetic interactions in materials is included in the SNO Monte Carlo (EGS4 [22]) and should properly take into account these effects. Also, our analysis is not completely dependent on Monte Carlo methods. Neutron calibration sources have been developed by SNO that provide 6.25-MeV -ray data from neutron capture on deuterium unaffected by source materials. This data has been used as a cross reference in our calibration program to assess the decay chamber influence on the -ray emission spectrum.
Detailed studies have been done by the SNO collaboration to assess the additional uncertainty the above source features introduce into the energy calibration. A full discussion is beyond the scope of this paper; therefore, the conservative overall uncertainty estimate is presented here as being less than 0.5%.
6 Source Performance
The following discusses the performance of the 16N source based on both off-line measurements and measurements taken in SNO. The discussion focuses on the yield and the trigger efficiency.
The yield is primarily a measure of how well the production and transfer systems work. The method for estimating the yield was outlined in Section 2 and 3 and the predicted yield was 460 per second. To test these calculations, measurements were taken with the SNO transfer configuration and the optimal flow conditions. The rate was taken as the chamber PMT trigger rate above the measured background for the given PMT threshold. The maximum measured rate was 300 decays per second. This is 35 less than the predicted yield but this is not surprising given the assumptions outlined in sections 3 and 4. These rates have proven adequate for the intended SNO calibration purposes. A single-point energy calibration with statistical precision better than 0.1% can be obtained in about ten minutes. Reconfiguration of the transfer lines (constrained at present by the source deployment hardware) would permit greater yields but this is not necessary at present.
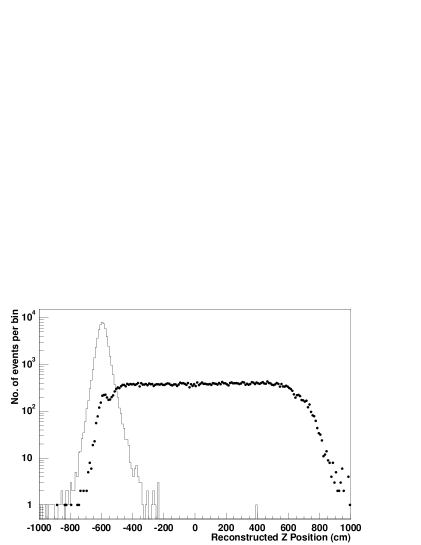
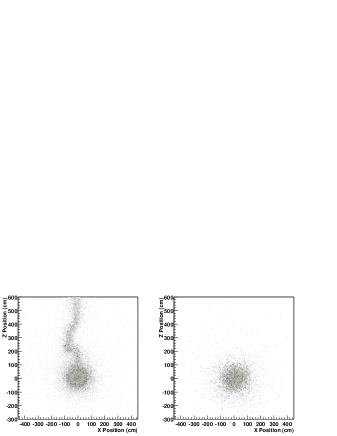
Given the geometry of the decay volume and the surrounding scintillator, the energy of the tagging -particles, as well as the care taken to optimize the light collection of the system, a high trigger efficiency was expected. This was confirmed via off-line measurements in which the signal from the 16N source chamber was used to trigger a nearby 12.7 cm diameter by 12.7 cm length NaI detector. Singles, coincidence and background spectra were obtained and analyzed to determine the trigger efficiency in the range 6 – 7 MeV range. The result was 952%. [6]. Results in SNO are consistent with this and this is illustrated in Fig. 8 where the number of position reconstructed events that trigger the chamber PMT are shown along with those that do not. As shown, almost all the events that reconstruct near the source chamber are triggered. In this instance the chamber was placed near the bottom of the SNO D2O volume and the rate of untriggered events from decays in the umbilical tube is almost constant along the central axis of the detector. Fig. 9 shows reconstructed X and Z coordinates for untriggered and triggered events with the source located at the center of the D2O.
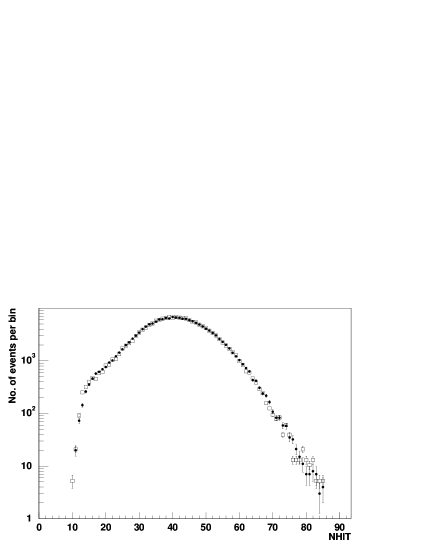
To illustrate the intended use of the source in SNO, the triggered Nhit distribution for the source at the center of the detector is shown in Fig. 10. Also shown is the Monte Carlo predicted Nhit distribution. In this instance, a single constant representing the overall detection efficiency of the photomultiplier tubes in the Monte Carlo was tuned until the best agreement was achieved in the Nhit means. Also, for both data and Monte Carlo, a requirement was made that the events reconstruct (i.e. in position) so that ground state 16N decays in which no light was produced in the D2O (i.e. false triggers) could be eliminated. Fig. 10 shows that in this instance, data and Monte Carlo agree quite well.
7 Conclusion
A calibration system using the decay of 16N has been developed and successfully deployed into the SNO detector. The source has achieved all its design goals including high 16N production yield ( 300 s-1) and high trigger efficiency ( 95). The -ray emission from the source is also well understood via Monte Carlo simulation. The systematic uncertainty in the energy calibration due to using this source is less than 0.5%.
References
- [1] The SNO Collaboration, Nucl. Inst. Meth. A449 (2000) 172.
- [2] R.T. Ford, Calibration of SNO for Detection of 8B Neutrinos, Ph.D. Thesis, Queen’s University (1998).
- [3] R.T. Ford, Nitrogen/Dye Laser System for the Optical Calibration of SNO, M.Sc. Thesis, Queen’s University (1993).
- [4] B.A. Moffat, The Optical Calibration of the Sudbury Neutrino Observatory, Ph.D. Thesis, Queen’s University (2001).
- [5] A. Hamer, Energy Calibration of SNO for Measurement of the Charged-Current Neutrino Reaction, Ph. D Thesis, Queen’s University (1999).
- [6] M. R. Dragowsky, Sudbury Neutrino Observatory Energy Calibration using Gamma-Ray Sources, Ph. D Thesis, Oregon State University (1999).
- [7] A.W.P. Poon, Energy Calibration of the Sudbury Neutrino Observatory Using Monoenergetic Gamma-Ray Sources, Ph.D. Thesis, University of British Columbia (1998).
- [8] A.W.P. Poon, R.J. Komar, C.E. Waltham, M.C. Browne, R.G.H. Robertson, N.P. Kherani, H.B. Mak, Nucl. Instr. Meth. A452 (2000) 115.
- [9] N. Tagg, The 8Li Calibration Source and Through-Going Muon Analysis in the Sudbury Neutrino Observatory, Ph.D. Thesis, The University of Guelph, (2001).
- [10] The Super-Kamiokande Collaboration, Nucl. Inst. Meth. A458 (2001) 636.
- [11] MF Physics Corporation, Colorado Springs, Colorado, U.S.A.
- [12] G. B. Wilkin, D-T Neutron Source Shielding for the Sudbury Neutrino Observatory, SNO technical report SNO-STR-95-030 (1995).
- [13] V. McLane, C. L. Dunford, and P. F. Rose, Neutron Cross Sections, Vol. 2, Academic Press (1988).
- [14] W. Frati, H. Leslie, B. Robertson, H. Robertson and J. Wilhemy, Neutron Free Gamma Ray Calibration Sources, SNO technical report SNO-STR-92-032 (1992).
- [15] B. Sur and E. D. Earle, Gas Transport Calibration System for SNO: A Preliminary Design Document, SNO technical report SNO-STR-95-053 (1995).
- [16] K. Murnaghan, SNO Calibration Source Optimization, SNO technical report SNO-STR-95-052 (1995).
- [17] Bicron Product Description, Appendix B, Premium Plastic Scintillators, Related Materials, Figure entitled Range of Atomic Particles in Bicron Premium Plastic Scintillators, p. B8.
- [18] K.I. Roulston and S.I.H. Naqvi, University of Manitoba, Winnipeg, Canada, in Bicron Product Description, (Appendix B: Premium Plastic Scintillators, Related Materials), Gamma-Detection Efficiency of Organic Phosphors, p. B9.
- [19] Electron Tubes, Ltd, Middlesex, England.
- [20] Spellman High Voltage Electronics Corporation, Plainview, New York, U.S.A.
- [21] R. B. Firestone, Table of Isotopes: Eighth Edition, John Wiley & Sons, New York, 1996.
- [22] W.R. Nelson, H. Hirayama and D.W.O. Rogers, The EGS4 code system, SLAC report 265 (1985).
Fig. 1 The basic features of 16N calibration. Gas Flow Control directs the target and transfer gas. Radioisotope Production is where the 16N is produced. Source Position Control positions the sources within the D2O or H2O volume. Decay/Triggering is where -rays exiting into the water volumes are tagged by the detection of the coincident -particles. The Photomultiplier Support Structure is denoted PSUP.
Fig. 2 Contents of the DT generator pit.
Fig. 3 Cross sectional view of the annular 16N target chamber.
Fig. 4 Cross section of the 16N umbilical.
Fig. 5 A schematic representation of the decay chamber.
Fig. 6 Major 16N -decay branches. The -ray energies appear to the right of the energy levels. The -decay branch strengths are shown as percentages near the arrow depicting the transition.
Fig. 7 Monte Carlo simulation results showing the source chamber effect on the -ray emission spectrum. The 16N -decay -rays are denoted in the spectrum by downward pointing arrows.
Fig. 8 Reconstructed Z position for triggered events (line) and untriggered events (dots).
Fig. 9 Reconstructed X and Y positions for the 16N chamber placed at the center of the SNO detector. The left panel shows all events including those due to umbilical decays and the right panel those that are in coincidence with the chamber beta detection. A cable is used to support the source and not the umbilical, hence the bend in the number of reconstructed untagged events relative to the vertical axis.
Fig. 10 Comparison of NHIT distributions for the 16N scaled Monte Carlo (open squares) and data (dots) for the source at the center position. The Monte Carlo PMT collection efficiency input was tuned so as achieve the best agreement with the data for the Nhit mean.


| neutron flux | 108 s-1 |
|---|---|
| cross section () | 35 mb [13] |
| Target Chamber pressure Ptgt | 6.5 Atm |
| Target Chamber half height () | 3.95 cm |
| Target Chamber inner radius () | 2.32 cm |
| Target Chamber outer radius () | 5.72 cm |
| Target Chamber volume () | 678 cm3 |
| Target Chamber gas density at 6.5 Atm () | 3.52 x 1020 cm-3 |
| Main transfer line length () | 43 m |
| Main transfer line area () | 0.0793 cm2 |
| Intermediate transfer line pressure () | 6.1 Atm |
| Umbilical transfer line length () | 30 m |
| Umbilical transfer line area () | 0.0455 cm2 |
| Decay Chamber volume () | 1050 cm3 |
| Decay Chamber pressure () | 4.05 Atm |
| Mass Flow Rate () | 230 Atm-cm3 s-1 |
| 16N production yield () | 6.92x10⁻⁵ 16N n-1 |
| Transfer efficiency () | 34.8 |
| Transfer efficiency () | 29.8 |
| Decay Chamber efficiency () | 64.2 |
| Total efficiency () | 6.7 |
| Calculated Yield | 460 s-1 |