8000
address=∗Wayne State University, 666 W. Hancock, Detroit, Michigan, email=voloshin@physics.wayne.edu
2001
Multiplicity and mean transverse momentum fluctuations in Au + Au collisions at RHIC.
Abstract
Strong modification of event-by-event fluctuations in global observables was proposed by several authors as an indicator of the phase transition in system evolution. We report the results of the analysis of STAR TPC data on the charged multiplicity and mean transverse momentum fluctuations in Au+Au collisions at =130 GeV. We discuss the centrality dependence of the observed fluctuations and compare the results with available data from lower collision energies and ISR data.
Keywords:
transverse momentum, multiplicity, fluctuations:
43.35.Ei, 78.60.Mq1 Introduction
The question of the hadronization of the system created in ultrarelativistic heavy ion collisions is one of the most interesting questions in this field. Does the system evolution include the phase transition? Event-by-event fluctuations of the mean transverse momentum and/or multiplicity, are considered to be one of the important tools to identify such a phase transition. The fluctuations depend on the nature of the phase transition. A first order phase transition may lead to large fluctuations in energy density due to formation of QGP dropletsvan Hove (1984); Kapusta and Vischer (1995). Second order phase transitions may lead to divergence in the specific heat; it would also increase the fluctuations in energy density due to long range correlations in the system Stephanov et al. (1998, 1999). One could observe them as fluctuations in mean transverse momentum if matter freezes out at the critical temperature Stodolsky (1995); Shuryak (1998). The system freeze-out near the QCD tri-critical and critical points would also lead to change in the fluctuations pattern Stephanov et al. (1998, 1999); Berdnikov and Rajagopal (2000). There exist also other sources of the abnormal dynamical fluctuations. The formation of the disoriented chiral condensate dcc should lead to large fluctuations in the ratio of neutral to charged pion yields at low , and consequently to fluctuations in of charged particles. Jets may give rise to event-by-event fluctuations in the high region.
For the multiplicity fluctuations, predictions range from enhanced multiplicity fluctuations connected to the production of QGP droplets and nucleation processes in a first order phase transition, to a strong suppression of fluctuations as a consequence of rapid freeze-out just after the phase transition. In this case, final state values of conserved quantities, such as net electric charge, baryon number, and strangeness would not be strongly modified from their value in the QGP stage. The fluctuation of these quantities could be reduced by a factor 2 – 4 if a QGP is produced Asakawa et al. (2000); Jeon and Koch (2000). The production and size of QGP droplets may critically depend on the collision impact parameter, leading to centrality dependence of the fluctuations to be an important observable. If the fluctuations are due to the particle production via any kind of clusters (e.g., resonances, strings (mini)jets, independent -collisions, etc.) and the relative production of such clusters do not change with centrality, the correlation strength should be inversely proportional to the particle multiplicity. New physics should appear as a deviation from such a dependence.
Here, we report on our measurement of charged particle multiplicity and mean fluctuations as a function of collision centrality in Au + Au collisions at an energy of GeV. Specifically, for the case of multiplicity fluctuations we discuss fluctuations in the difference of the relative number of produced positive and negative charged particles measured in a fixed rapidity range:
| (1) |
where and are the corresponding multiplicities. One can consider fluctuations in the production of charged particles, and , as well as in the specific cases of proton and anti-proton, and , and positive and negative kaons, and . The former amounts to a measurement of net electrical charge fluctuations, whereas the latter cases are related to net baryon number and net strangeness fluctuations, respectively. The quantity used in our analysis can be related to the fluctuations in multiplicity ratios heiselberg ; Jeon and Koch (1999), but have the advantage of not being limited to large particle multiplicities.
1.1 Statistical and Dynamical fluctuations
The fluctuations of any observable measured on an event-by-event basis consists of two parts: statistical fluctuations, the uncertainty in the measurement of a given quantity due to finite event multiplicity, and dynamical fluctuations due to correlated particle production, the subject of interest. The statistical fluctuations are the ones one would observe in the case of independent particle production provided that the single particle inclusive quantities remain the same as in real events.
Multiplicity fluctuations. A difficulty inherent in the interpretation of multiplicity fluctuations is the elimination of effects associated with uncertainties in the collision centrality, often referred to as volume fluctuations. They, in particular, induce a positive correlation in particle production which does not depend on the intrinsic dynamical properties of the colliding system. Fluctuations in the difference of relative multiplicities, , defined in Eq. 1, are however free from this problem. This analysis is thus restricted to the study of such relative multiplicities.
The magnitude of the variance, , is determined by both statistical and dynamical fluctuations. Taking into account the fact that for independent particle production the multiplicity fluctuations follow the Poisson distribution, the dynamical fluctuations can be evaluated as
| (2) |
The value of is determined by intrinsic correlations between produced particles averaged over the pseudo-rapidity and transverse momentum range under study. It is, to first order, independent of the detector acceptance (provided it is smaller than typical long-range correlation scale of 1 – 2 units of rapidity) and particle detection efficiency as can be seen from its relation to the inclusive two and single particle densities:
| (3) |
where is a correlation function similar to that used in multi-particle production analysis Foa (1975); Whitmore (1976); Boggild and Ferbel (1974) and defined as
| (4) |
where , and are single and two particle (pseudo)rapidity densities, respectively.
Mean transverse momentum fluctuations. We use the following notation for the mean transverse momentum in each event and average over all events in a given event sample (centrality bin):
| (5) |
The fluctuations in becomes
| (6) | |||||
| (7) |
where is the multiplicity. In Eq. 7 we have introduced the notation for the non-statistical (dynamical) fluctuations in as:
| (8) |
which is zero in the case of no correlation between particle transverse momenta. As above, in this equation the double angle brackets represent the average over particle pairs in a specified (pseudo)rapidity and transverse momentum window, and the average over all events with a given multiplicity.
2 Results
STAR detector and data selection. The STAR detector consists of many detector subsystems in a large solenoidal magnet with the Time Projection Chamber (TPC) as the main tracking device. Details about the STAR TPC can be found in referenceSTAR Collaboration (1999). In the year 2000, the TPC was operated in a 0.25 T magnetic field allowing tracking of particles with greater than 75 MeV/c. The experimental setup includes also the scintillator trigger barrel (CTB) surrounding the TPC and two Zero Degree Calorimeters (ZDCs) located at 18 m from the center of the TPC. The ZDCs measure mainly fragmentation neutrons and are used in coincidence as the experimental trigger for minimum bias events.
We determine the centrality of the collision by the total reconstructed charged track multiplicity, , in the pseudorapidity region . Eight centrality bins used in this analysis are the same as used in flow and correspond to the fraction of the total geometrical cross section of the top 6%, 11%, 18%, 26%, 34%, 45%, 58%, and 85%, respectively.
A total of about 140 thousand minimum bias events with a primary vertex position within 75 cm of the center of the TPC have been used in this analysis. The tracks are required to pass within 3 cm of the primary vertex and the ratio of the number of points on a track to the maximum possible number of points is required to be greater than in order to avoid double counting of tracks due to track splitting. In this analysis we use only tracks within the pseudo-rapidity range and transverse momentum GeV/c, where the track reconstruction efficiency is estimated to be .
Multiplicity fluctuations. Fig.1 shows the dynamical fluctuations, , in the pseudorapidity region , as a function of the total multiplicity . The dynamical fluctuations are finite and negative: a clear indication of the correlation in the production of the positive and negative particles.
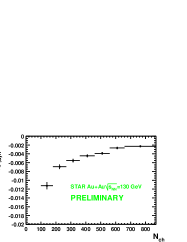
We verified that, within statistical errors, the same value is obtained when the pseudorapidity regions used to count positive an negative tracks were separated by a gap, which should eliminate problems related to track splitting and resolution of two close tracks. We observe less than 10% decrease in the strength of the correlation when varying the pseudo-rapidity range from to .
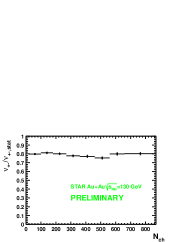
The absolute strength of the dynamical fluctuations decreases monotonically with increasing collision centrality. In order to check the deviation from the inverse proportionality to multiplicity, in Fig.1b we present the ratio of the observed fluctuations to the statistical fluctuations111 Note, that this ratio depends on the size of the acceptance used for the measurement.. This ratio is related to the quantities and used in other works Asakawa et al. (2000); Jeon and Koch (2000); Gavin00 as . The relationship is strictly exact if . The ratio has a value of about 0.8 nearly independent of the collision centrality in qualitative agreement with the expected value 0.75 based on a thermalized resonance gas as calculated in Jeon and Koch (1999) for particles produced in a rapidity interval . The measurement, however, deviates drastically from calculations based on a rapid QGP freeze out Jeon and Koch (2000); Asakawa et al. (2000), which predict values of 0.2–0.4.
We consider these results in the light of correlation functions measured in collisions at CERN Foa (1975); et al. (UA5 Collaboration, 1976) with the use of Eq.3. We account for the unavailability of measurements at the same energy by interpolating the data obtained at lower and higher collision energies (parameterization from UA5 Collaboration (1986)). We also note that the correlation function for opposite charge particles, , is found to be approximately twice as strong as the same sign particles correlations, Foa (1975); Whitmore (1976), and independent of the collision energy. Using the single charge particle pseudorapidity density and one finds charged-charged correlation function . Furthermore, assuming equal multiplicities of positively and negatively charged particles, one finds , which we use to estimate the correlation measured in this work as . Under the assumption that the correlations are due to production in a finite number of sources (clusters), the correlation function should be inversely proportional to the particle density. In central Au+Au collisions, the charged particle density is about 550 compared to approximately 2.06 in collision. Such a dilution would give for the correlation function a value of , a number which is about 30% larger than we observe (see Fig.1a).
Mean fluctuations. The results for the mean transverse momentum fluctuation in the region are presented in Fig. 2.
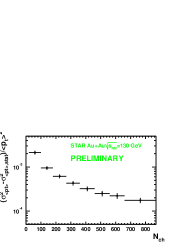
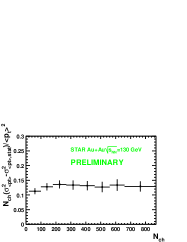
Selecting specific pairs for the averaging in Eq. 8 one can suppress or enhance the contribution to fluctuations of different origin. We have also correlated: (1) particles in pseudo-rapidity region with particles in . The ‘gap’ between the two regions eliminates effects such as Bose-Einstein correlations (HBT) or Coulomb final state interactions. (2) Positive particles with negative particles, which is expected to enhance the contribution from resonances. No significant difference has been observed. The somewhat smaller value (less than 10%) in the case of the correlation of particles separated by the gap in pseudorapidity could be explained by larger average distance in the pseudorapidity space between the two particles in a pair. The relative fluctuation in mean transverse momentum was found to be . The (relative) systematic error in our measurements of is about 5%. It has been estimated by varying track selection cuts, primary vertex position within the TPC, and comparing the Monte-Carlo results before and after processing through the detector simulation.
Event-by-event dynamical fluctuations have also been analyzed by several experiments using the so called Gazdzicki and Mrowczynski (1992) measure (the approximate relation to is taken from Voloshin et al. (1999)):
| (9) |
and close to it the difference factor jeff :
| (10) |
For the 6% most central collisions STAR measures jeff , which is consistent with results reported here for (one can check this with the help of an approximate expression given by Eq. 9 and using the other parameters presented in jeff ). In Pb+Pb and Pb+Au collisions at CERN SPS ( GeV) have been measured by NA49 na49plb and NA45/CERES ceres . NA49 reported na49plb MeV/c for the rapidity region and 5% most central collisions. The observed fluctuations are extremely small, but it would be incorrect to compare these numbers with the STAR measurement, since NA49 results were obtained in the forward rapidity region, while STAR measurements are at midrapidity. The CERES collaboration has measured the fluctuations in the central rapidity region. They report MeV/c in central Pb+Au collisions ceres . As seen from Eq. 9, is directly proportional to the number of reconstructed tracks used for its calculation (subject to acceptance cuts and tracking efficiency) which complicates the comparison of the results from different experiments. For a rough comparison one can take into account the fact that the CERES multiplicity 130, 420 GeV/c and GeV/c. Then MeV corresponds to .
The dynamical part of mean transverse momentum fluctuations has been measured at the ISR et al. (1983b) in collisions. This was done by analyzing the multiplicity dependence of under the assumption that in collisions the dynamical part in fluctuations does not depend on multiplicity. It was observed that . Rescaling of this quantity with (the square root of) the ratio of multiplicity densities in and collisions yields the fluctuations in : , about 50% less than observed in this experiment.
To understand the role of (mini)jet production in fluctuations we have performed an analysis of central HIJING events with hard processes switched “on” or “off” and with the same cuts as in the real experimental data. The jets increase the fluctuations from to about 1.1%. Note that both numbers are very close to the experimentally observed value. Contrary to HIJING, the RQMD event generator includes secondary particle rescatterings, but yields approximately the same values as HIJING (within 20%, limited by our statistics of the RQMD events).
In summary, we have reported measurements of the multiplicity and mean transverse momentum fluctuations in Au+Au collisions at RHIC. While a clear correlation in particle production has been measured, no qualitative difference from the lower energy collision experiments as well as collisions at similar energies has been observed. The centrality dependence of the observed correlations is consistent with being inversely proportional to total event multiplicity, the dependence expected in particle production via clusters.
References
- van Hove (1984) van Hove, L., Z. Phys., C 21, 93 (1984).
- Kapusta and Vischer (1995) Kapusta, J., and Vischer, A., Phys. Rev., C52, 2725 (1995).
- Stephanov et al. (1998) Stephanov, M., Rajagopal, K., and Shuryak, E., Phys. Rev. Lett, 81, 4816 (1998).
- Stephanov et al. (1999) Stephanov, M., Rajagopal, K., and Shuryak, E., Phys. Rev., D60, 114028 (1999).
- Stodolsky (1995) Stodolsky, L., Phys. Rev. Lett, 75, 1044 (1995).
- Shuryak (1998) Shuryak, E., Phys. Lett, B430, 9 (1998).
- Berdnikov and Rajagopal (2000) Berdnikov, B., and Rajagopal, K., Phys. Rev., D61, 105017 (2000).
- (8) Rajagopal, K., and Wilcek F., Nucl. Phys., B399, 395 (1993).
- Asakawa et al. (2000) Asakawa, M., Heinz, U., and Mueller, B., Phys. Rev. Lett., 85, 2072 (2000).
- Jeon and Koch (2000) Jeon, S., and Koch, V., Phys. Rev. Lett., 85, 2076 (2000).
- Jeon and Koch (1999) Jeon, S., and Koch, V., Phys. Rev. Lett., 83, 5435 (1999).
- (12) Baym, G., and Heiselberg, H., Phys. Lett., B469, 7 (1999).
- Foa (1975) Foa, L., Physics Reports, 22, 1 (1975).
- Whitmore (1976) Whitmore, J., Physics Reports, 27, 187 (1976).
- Boggild and Ferbel (1974) Boggild, H., and Ferbel, T., Ann. Rev. Nucl. Sci., 24, 451 (1974).
- STAR Collaboration (1999) STAR Collaboration, Thomas J., et al., Nucl. Phys., A661, 681c (1999).
- (17) STAR Collaboration, Ackermann K., et al., Phys. Rev. Lett., 86, 402 (2001).
- (18) Gavin S., and Pruneau C., Phys. Rev., C 61, 044901 (2000).
- Voloshin et al. (1999) Voloshin, S. A., Koch, V., and Ritter, H., Phys. Rev., D60, 024901 (1999).
- et al. (UA5 Collaboration) UA5 Collaboration, Ansorge R., et al., Z. Phys., C 37, 191 (1988).
- et al. (1976) Amendolia S., et al., Nuovo Cimento, 31 A, 17 (1976).
- UA5 Collaboration (1986) UA5 Collaboration, Ansorge R., et al., C 33, 1 (1986).
- Gazdzicki and Mrowczynski (1992) Gazdzicki, M., and Mrowczynski, S., Z. Phys., C54, 127 (1992).
- (24) Reid J. for the STAR Collaboration, talk at ”Quark Matter 2001” conference.
- (25) NA49 Collaboration, Appelshuser H., et al., Phys. Lett., B459, 679 (1999b).
- (26) Appelshauser H. for the CERES Collaboration, talk at ”Quark Matter 2001” conference.
- et al. (1983b) Braune K., et al., Phys. Lett., B123, 467 (1983b).