Nucleon Structure in the Resonance Region 111Talk presented at the International Conference on Mesons amd Light Nuclei, Prague, July 2 - 6, 2001
Abstract
I discuss recent results of inclusive and exclusive electroproduction experiments at Jefferson Lab. They include measurements of the spin response for protons and neutrons in the resonance region, exclusive single pion and multiple pion production to measure resonance transition multipoles, and searches for missing quark model states. A brief outlook to the new domain of Generalized Parton Distributions is given as well.
1 Introduction
Studies of the nucleon structure for over 30 years have focused on the deep inelastic regime to determine the quark momentum and spin distributions, and to test fundamental sum rules. One of the surprising findings was that less than of the nucleon spin is accounted for by the spin of quarks [1]. This result is in strong contradiction to expectations, which shows that we are far from having a realistic picture of the intrinsic structure of the nucleon. Moreover, the nucleon structure has hardly been explored in the regime of confinement, which is the true domain of strong QCD. Our understanding of nucleon structure is not complete if the nucleon is not also probed and fundamentally described at large or medium distances. This is the domain where current experiments at JLab have their biggest impact. It is only through a concerted effort of precise experiments and new approaches in theory that we will be able to understand nucleon structure from the smallest to the largest distances within a consistent framework. Experiments at JLab aim at providing precise data as the basis for such an endeavor.
.
2 Spin Response of the Proton and Neutron
The inclusive doubly polarized electron-nucleon cross section can be written as:
where and are the spin-dependent asymmetries, is the angle between the nucleon polarization vector and the vector, the polarization parameter of the virtual photon, and and are the total absorption cross sections for transverse and longitudinal virtual photons. Experiments usually measure the asymmetry
where D is a kinematical factor describing the polarization transfer from the electron to the photon. and are related to the spin structure function by
where is the usual unpolarized structure function, and .

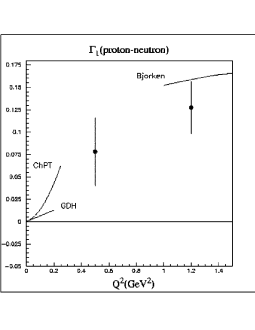
An important quantity is the first moment . The Gerasimov-Drell-Hearn (GDH) sum rule [2, 3], and Bjorken sum rule for the proton-neutron difference, provide constraints for at the kinematical endpoints , and . The evolution of the Bjorken sum rule to finite values of using pQCD and the Operator-Product-Expansion (OPE) connects experimental values measured at finite to the endpoint. At the opposite end, the GDH sum rule defines the slope of :
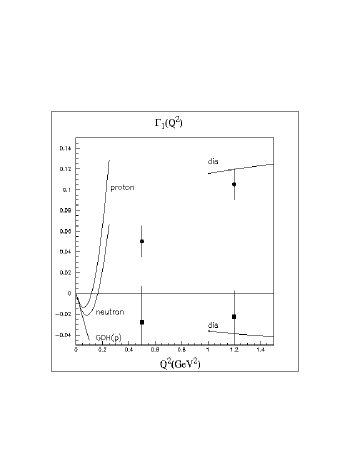
where is the anomalous magnetic moment of the target nucleon. Heavy Baryon Chiral Perturbation Theory (HBChPT) may be used to evolve the GDH sum rule to [10]. The challenge of nucleon structure physics is to test the validity of these evolutions, and to bridge the remaining gap. Lattice QCD may play an important role in describing resonance contributions to the moments of spin structure functions. Using just the constraints given by the two endpoint sum rules we may already get a qualitative picture of and . There is no sum rule for the proton and neutron separately that has been verified, however, experiments have determined the asymptotic limits with sufficient confidence for the proton and the neutron. At large , is expected to approach this limit following the pQCD evolution from finite values of . At small , must approach zero with a slope given by the GDH sum rule (assuming the sum rule will be verified). The situation is depicted in Figure 1, where also the next-to-leading HBChPT evolution at small and the pQCD evolution to order at high are shown.
As the slope at is , and the asymptotic value is , must change sign at some value GeV2. We note that the HBChPT evolution [10] cannot give a good description of the trend shown by the existing data, for GeV2. However, for the proton-neutron difference the situation is quite different [11]; the HBChPT curve describes the general trend of the data quite well, and over a significantly larger range in than for proton and neutron separately.
2.1 The first moment for the proton.
Inclusive double polarization experiments have been carried out on polarized hydrogen [13] using as polarized target material. In Figure 2 the asymmetry is shown for various bins in . For the lowest bin the asymmetry is dominated by the excitation of the , resulting in a strong negative asymmetry. At higher the asymmetry in the region remains negative, but quickly becomes positive and large at higher W, reaching peak values of about 0.6 at GeV2 and W=1.5 GeV. Evaluations of resonance contributions show that this is largely driven by the amplitude, and by the rapidly changing helicity structure of the strong state. The latter resonance is known to have a dominant amplitude at the photon point, but is rapidly changing to dominance for GeV2 [12].
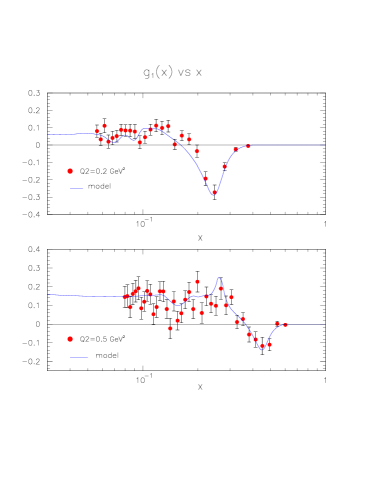
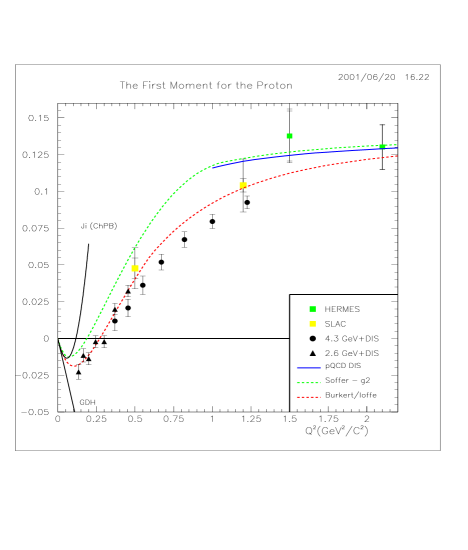
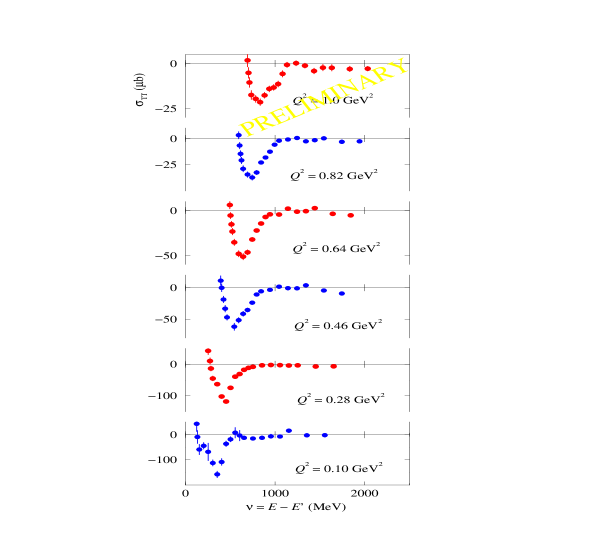
Using a parametrization of world data on and we can extract from (5). Examples of are shown in Figure 3. The main feature at low is due to the negative contribution of the resonance. The graphs also show a model parametrization of which was used to extrapolate to . The extrapolation is needed to evaluate the first moment which is shown in Figure 4. The characteristic feature is the strong dependence for GeV2, with a zero crossing near GeV2. Although this result is still preliminary, the qualitative features of the data will not change. Measurements on have also been carried out with CLAS [14], and on in JLab Hall A [15], to measure the corresponding integrals for the neutron.
2.2 Generalized Gerasimov-Drell-Hearn sum rule for neutrons
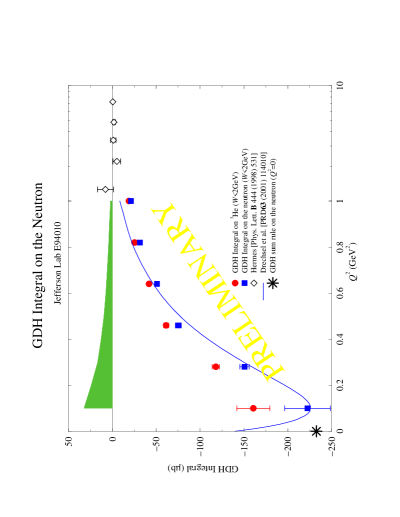
Data were taken with the JLab Hall A spectrometers using a polarized target. Since the data were taken at fixed scattering angle, and are correlated. Cross sections at fixed are determined by an interpolation between measurements at different beam energies. Both longitudinal and transverse settings of the target polarization were used. Therefore, no assumptions about are necessary in this case. The GDH integrand for is shown in Figure 5 for various . The most remarkable feature of these data is the strong negative contribution from the . In contrast to the proton case, the integrand above the region remains negative and small for all . The GDH integral for was corrected for nuclear effects to extract the integral for neutrons using the prescription by Ciofi degli Atti [16]. Preliminary results are shown in figure 6. The integral is evaluated over the region from pion threshold (on a free neutron) to W = 2 GeV, to cover the resonance region only. The approach to the GDH sum rule value is slower, and the dependence less steep than in the proton case. Part of this behavior is due to differences in the helicity structure of the dominant neutron and proton resonance excitations.
3 Electroproduction of Mesons in the Nucleon Resonance Region
A detailed study of nucleon resonance transitions requires measurement of exclusive final states. Current CLAS results in the region of the and the are from single and production, respectively. The neutral meson is inferred from the missing mass determined due to the overconstrained kinematics of the reaction. The search for “missing” resonances is systematically conducted in and channels.
3.1 The transition multipole ratios and
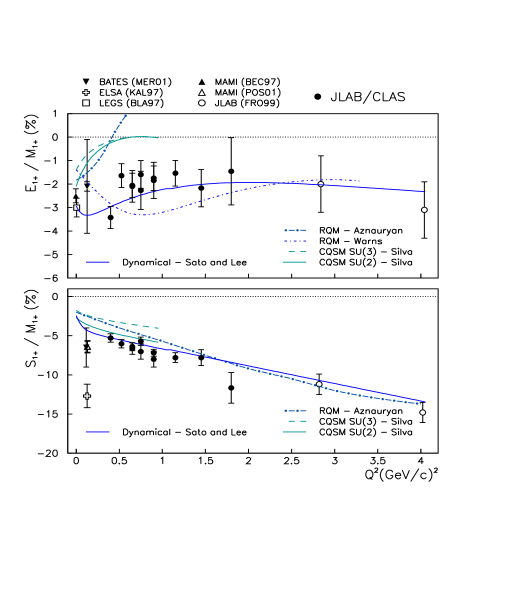
The transition has been the subject of research for many years. The dominance of the magnetic dipole transition has been known for three decades. The magnitudes of the quadrupole transitions, however, remained poorly determined until recently. The ratio was found to have a larger magnitude at the real photon point [17, 18] than constituent quark models predicted. New model developments that take into account explicit pion contributions also predict larger values, and a strong dependence for the scalar quadrupole ratio , while the was predicted to remain nearly constant. This made a study of the -dependence of the quadrupole transition contributions very interesting.
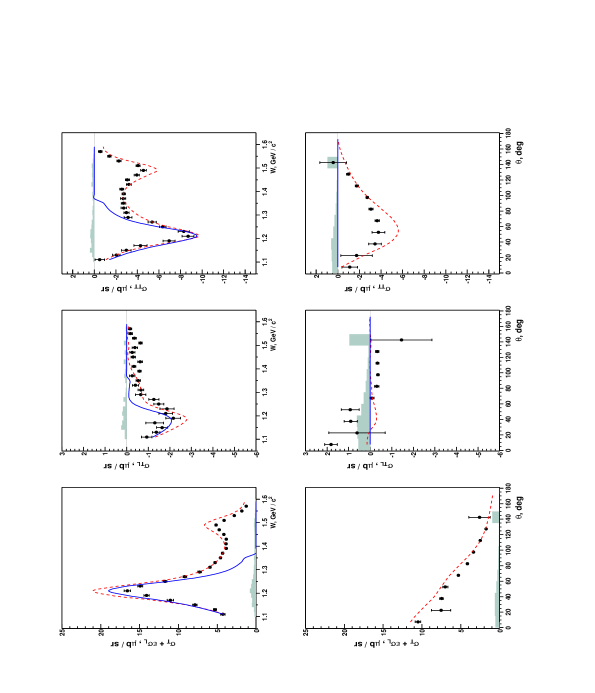
Single pion production is most sensitive to the transition. The CLAS detector is well suited for this as it covers a large and W range as well as the full azimuthal and polar angle distributions of the system. The azimuthal distribution is fitted to determine the response functions , , and , which are then analyzed in terms of multipoles. The results are presented in Figure 7. Included are various relativized quark models and dynamical models with pionic degrees of freedom. Only models that include pions explicitly seem to be able to describe the dependence for both the and simultaneously, while constituent quark models may describe one or the other but not both within the same model. It should be noted that dynamical models have been fitted to the photon point and to the two highest data points. Also, chiral quark soliton models, while describing roughly the trend of , predict a fast falloff of with which is not seen in the CLAS data. We also do not see any trend towards significant leading order contributions from pQCD which require . What is lacking are precise first principle QCD calculations of the transition multipoles.
3.2 The second resonance region
A natural candidate for detailed studies beyond the is the Roper resonance . However, more than 35 years after its discovery the structure of this state is still unknown. The non-relativistic constituent quark model (nrCQM) puts its mass above 1600 MeV, the photocoupling amplitudes are not described well, and the transition form factors, although poorly determined, are far off. Relativized variations of the nrCQM improved the situation only modestly. To obtain a better description of the data a number of alternative models have been proposed. Does the Roper have a large gluonic component[21]? Does it have a small quark core with a large pion cloud[22]? Or is it a nucleon-sigma molecule[23]? It is crucial to get more precise electroproduction data, as it is the dependence where the models differ strongly. The study of the “Roper” in the channel is hampered by the presence of the dominant . Better sensitivity, due to the isospin nature of the state, should be obtained if the channel is included in the analysis. The first data with nearly complete kinematic coverage are becoming available from CLAS. Figure 8 shows the response functions in that channel measured throughout the first and second resonance regions. The combined analysis of these data with the channel is currently underway.
Another topic in the second resonance region has been properties of the resonance. Analysis of single pion data gave results for the photocoupling amplitude which were significantly different from what is obtained from the analysis of the eta channel. More importantly, the dependence of exhibits an unusually hard transition form factor dropping by a factor of less than 2.5 over a range GeV2. This behavior has been difficult to describe in quark models. In addition, the unusual phase motion led to the idea that the is not a real 3-quark resonance but possibly a molecule [24]. Lacking a real calculation, one might speculate that a loosely bound molecule would be unlikely to exhibit a large cross section combined with a hard transition form factor. Revisiting the dependence of has therefore become an important topic of nucleon structure physics.
Measurements were performed with CLAS covering a range from GeV2. Data below GeV2 have been published recently [25]. They confirm the trend of the earlier data, showing a hard transition form factor. Preliminary new CLAS data covering the range GeV2 give also a very consistent picture [28], confirming the slow fall-off with , and linking up the photon data [26] with the high data [27].
There is also some good news from the theory side. The calculation by the Genoa group [29] is able to reproduce the slow form factor fall-off within a constituent quark model, using a Coulomb-type hypercentral potential and linear confining potential. The same model also describes the leading amplitude of the in a large range. However, the model underpredicts the sub-leading amplitude . This raises the question whether pion cloud contributions are more prevalent in the sub-leading amplitudes than in the leading amplitudes. A dynamical model that includes pion cloud effects could answer this question. Lattice QCD may also be able to estimate these contributions at the photon point.
3.3 Missing resonances
The so-called missing resonances [30] have been a focus of nucleon structure studies at intermediate energies for a number of years. It is only now that the first experimental results have become available, and serious studies are being undertaken to address the issue. The importance of the topic is due to the fact that these states are predicted within any model having (broken) symmetry, reflecting a symmetric arrangement of the 3-quark system. Other symmetry schemes [31] predict a smaller number of states, as for example a quark-diquark configuration. Search for at least some of the states predicted in one but not the other scheme is important, as it will test fundamental symmetry properties which are at the foundation of baryon structure in the domain of confinement and strong QCD. Two final states, and , show promise in the study of higher mass nucleon resonances, and the search for missing states. These are currently under intense study with the CLAS detector.
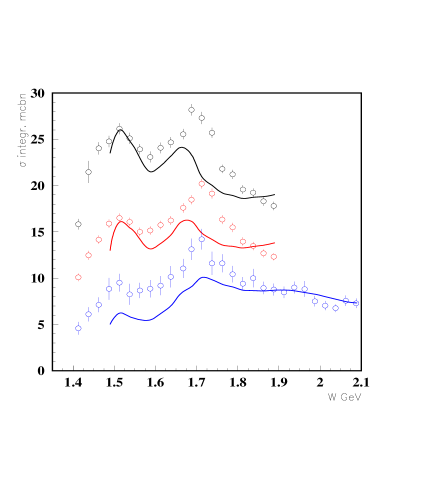
Figure 9 shows total cross section data for the , showing for the first time resonance structure in this channel for masses greater than 1.6 GeV. The comparison with the model [33] containing the most advanced resonance parametrization for this mass range [12] shows large missing strength in the mass range near 1.71 GeV. While there is no missing state predicted in this mass range, it nevertheless shows the sensitivity of this channel to resonance excitations. The data above 1.9 GeV are currently limited to low statistics, high data, and do not allow conclusions regarding resonance production in the 1.9-2.1 GeV mass region where most of the missing states are predicted.
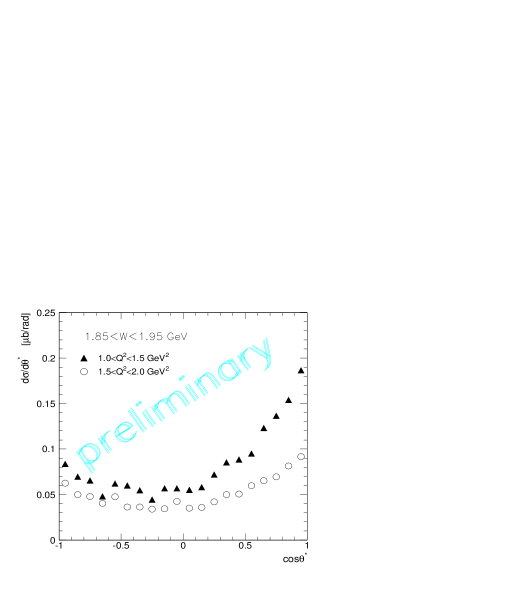
Figure 10 shows angular distributions for the final state at different hadronic masses. This channel is expected to be dominated by t-channel processes at forward angles and nucleon pole and resonance contributions at large angles. The data at high W show mostly t-channel behavior, while in the mass range below 2 GeV significant other contributions are visible. The detailed analysis of these data is currently underway. Any resonant state found in this channel would be interesting as no nucleon resonance is currently known to couple to .

4 DVCS - A Tool to Study Nucleon Structure
A major goal of measuring exclusive reactions in the resonance region is to study the nucleon wave function which requires measurements at different distance scales. The interpretation of these reactions is complicated by the fact that the virtuality of the photon probe and the momentum transfer to the nucleon or excited state are strongly coupled leading to a correlation of the resolution of the probe and the momentum transfer to the recoiling baryon system. The recently established framework of hard exclusive reactions and generalized parton distributions (GPDs) offers the possiblity of studying resonance excitations where the virtuality of the photon probe is decoupled from the momentum transfer to the baryonic system. For certain kinematics exclusive processes have been shown to factorize into a hard scattering process governed by QED and pQCD vertices, and the soft nucleon structure described by GPDs [34, 35]. In the simplest reaction, the Deeply Virtual Compton Scattering (DVCS) the virtual photon () has to have a sufficiently high virtuality () for the process to scale. Under these conditions the transition from the proton to the recoil baryon is probed at the parton level, controlled by the momentum transfer , which can be varied independently of . Calculations within the GPD formalism for processes such as will be needed to enter this new area of baryon spectroscopy.
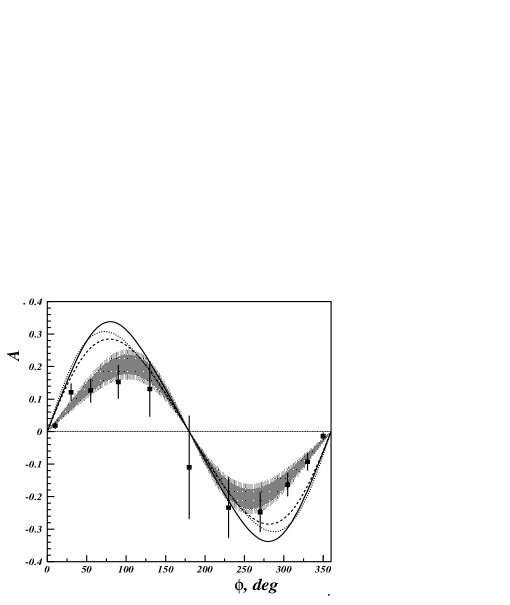
A fully exclusive measurement of the DVCS elastic process () was recently completed at CLAS [36], using a 4.3 GeV incident polarized electron beam. The polarized beam was used to exploit the interference between the DVCS and the Bethe-Heitler (BH) processes which results in a strong beam spin asymmetry proportional to the imaginary (absorptive) part of the DVCS amplitude. The results are shown in Figure 11 in comparison with theoretical curves describing the reaction based on the hard scattering formalism and models for the GPDs.
This result marks a successful foray into the uncharted territory of GPDs. Measurements at higher energies and with much higher statistics [37] are planned for the near future. Use of the inelastic DVCS process may lead to a promising new avenue of hard baryon spectroscopy at the parton level.
5 Conclusions and Outlook
Hadron physics at JLab addresses the transition from the domain of hadronic degrees of freedom and constituent quarks to the single parton regime. The first measurements of double polarization asymmetries have been carried out in a range of not covered in previous experiments. The results show large contributions from resonance excitations with rapidly changing helicity structure. The first moment of the spin structure function shows a dramatic change with , including a sign change near GeV. This marks the dominance of resonance excitations and hadronic degrees of freedom over the single parton domain. The dependence of the generalized GDH integral for the neutron shows dominant contributions from the . In this case no sign change is expected as the asymptotic value for the neutron.
New data have been taken both on hydrogen and deuterium with nearly 10 times more statistics, higher target polarization, and over a larger range of energies from 1.6 GeV to 5.75 GeV. These data will cover a range from 0.05 to 2.5 GeV2, and a larger portion of the deep inelastic regime. This will greatly reduce systematic uncertainties related to the extrapolation to . The greatly increased precision, and measurements at different energies, will give information on both and .
There is also a program underway in JLab Hall A to measure the GDH sum rule for neutrons down to values near the real photon point, and to measure neutron asymmetries at high .
Measurements of various exclusive processes in CLAS allows detailed studies of resonance excitations. Precise measurements of the transition multipoles in the region show the importance of explicit pion contributions in the transition. New measurements of the transition form factors show a consistent behavior over the entire range from 0 to 3.5 GeV2. The highly topical question of missing resonances is being addressed in the study of multipion and vector meson channels. Both channels show great sensitivity to resonance production, and structures in the data strongly suggest s-channel resonance contributions.
The framework of GPDs and hard scattering phenomenology has opened up a new avenue for the study of the nucleon wave function at the parton level.
The Southeastern University Research Association (SURA) operates JLab for the U.S. Department of Energy under Contract No. DE-AC05-84ER40150.
References
- [1] For a recent review see: B.W. Filippone, Xiangdong Ji; hep-ph/0101224 (2001)
- [2] S.B. Gerasimov; Sov. J. Nucl. Phys. 2, 430 (1966)
- [3] S.D. Drell and A.C. Hearn, Phys. Rev. Lett.16 (1966) 908
- [4] J.D. Bjorken, Phys. Rev. 179, 1547 (1969)
- [5] X. Ji, J. Osborne, J. Phys. G27:127 (2001)
- [6] K. Abe et al., Phys. Rev. D58, 2003 (1998)
- [7] V. Burkert and Zh. Li, Phys. Rev. D47,46 (1993)
- [8] J. Soffer and O.V. Teryaev, Phys. Rev. Lett. 70, 3371 (1993)
- [9] V. Burkert and B. Ioffe, Phys. Letts. B296, 223 (1992); J.Exp.Theo.Phys.78, 619 (1994)
- [10] X. Ji, C.W. Kao, J. Osborne, Phys. Lett. B472:1-4 (2000)
- [11] V. Burkert, Phys. Rev. D63, 97904(2001)
- [12] V. D. Burkert, Czech. Journal of Physics,Vol. 46, 627, 1996.
- [13] V. Burkert, D. Crabb, R. Minehart, et al., JLab experiment 91-023.
- [14] S. Kuhn, G. Dodge, M. Taiuti, et al., JLab experiment 93-009
- [15] Z.E. Meziani et al., JLab experiment E94-010
- [16] C. Ciofi degli Atti, S. Scopetta, Phys. Lett. B404, 223-229 (1997)
- [17] R. Beck et al., Phys. Rev. Lett. 78:606-609 (1997); Phys. Rev. C61:035204 (2000)
- [18] G. Blanpied et al., Phys. Rev. C64:025203 (2001)
- [19] D. Drechsel, O. Hanstein, S. Kamalov, L. Tiator, Nucl. Phys. A645, 145 (1999)
- [20] T. Sato, T.-S.H. Lee, Phys. Rev. C63, 055201 (2001)
- [21] Zp. Li, V. Burkert, Zh. Li, Phys. Rev. D47, 46 (1993)
- [22] F. Cano and P. Gonzalez, Phys. Lett. B431, 270-276 (1998)
- [23] O. Krehl, C. Hanhart, S. Krewald, J. Speth, Phys. Rev. C62, 025207 (2000)
- [24] N. Kaiser, T. Waas, and W. Weise, Nucl. Phys. A612, 297 (1997)
- [25] R. Thompson et al. (CLAS coll.), Phys. Rev. Lett. 86:1702-1706 (2001)
- [26] B. Krusche et al., Phys. Rev. Lett. 74, 3736 (1995)
- [27] C. S. Armstrong et al., Phys. Rev. D 60, 052004 (1999)
- [28] S. Dytman, private communications
- [29] M.M. Giannini, E. Santopinto, Few Body Syst. Suppl. 11:37-42 (1999)
- [30] N. Isgur and R. Koniuk, Phys. Rev. Lett. 44, 845-848 (1980)
- [31] M. Kirchbach, Mod. Phys. Lett. A12:3177-3188 (1997)
- [32] V.D. Burkert, Zh. Li, Phys. Rev. D46,47 (1993); R. DeVita, private communication.
- [33] M. Ripani, et al., Nucl.Phys.A672:220-248,2000
- [34] X. Ji, Phys. Rev. Lett. 78, 610 (1997); Phys. Rev. D55, 7114 (1997)
- [35] A. Radyushkin, Phys. Lett. B380, 417 (1996), Phys. Rev. D56, 5524 (1997)
- [36] S. Stepanyan, V. Burkert, L. Elouadrhiri, et al., hep-ex/0107043
- [37] V. Burkert, L. Elouadrhiri, M. Garcon, S. Stepanyan, et al., JLab experiment E01-113.