Measurements and Simulations of Cherenkov Light in Lead Fluoride Crystals
Abstract
The anticipated use of more than one thousand lead fluoride (PbF2) crystals as a fast and compact Cherenkov calorimeter material in a parity violation experiment at MAMI stimulated the investigation of the light yield (L.Y.) of these crystals. The number of photoelectrons () per MeV deposited energy has been determined with a hybrid photomultiplier tube (HPMT). In response to radioactive sources a L.Y. between 1.7 and 1.9 /MeV was measured with 4% statistical and 5% systematic error. The L.Y. optimization with appropriate wrappings and couplings was investigated by means of the HPMT. Furthermore, a fast Monte Carlo simulation based on the GEANT code was employed to calculate the characteristics of Cherenkov light in the PbF2 crystals. The computing time was reduced by a factor of 50 compared to the regular photon tracking method by implementing detection probabilities as a three-dimensional look-up table. For a single crystal a L.Y. of /MeV was calculated. The corresponding detector response to electrons between 10 and 1000 MeV was highly linear with a variation smaller than 1%.
keywords:
Cherenkov counters; lead fluoride; light yield; photoelectron distributions; Monte Carlo simulations PACS classification: 24.10 – Lx; 29.40 – Ka, , , , , , , ,
1 Introduction
The A4 collaboration is preparing a measurement of the parity violating asymmetry in elastic scattering of right and left handed electrons on an unpolarized proton target at the Mainz Microtron MAMI [1]. An electromagnetic calorimeter was built in the years 1999 and 2000 to carry out the precise measurement with a total accuracy of . In order to obtain a clear separation of events in the low energy tail of the elastic peak to a background of photons from decays, soft electrons and pions an energy resolution of in arrays of detectors and a fast online calibration are needed. This energy resolution not only depends on intrinsic shower and leakage fluctuations but also on the effective light yield (L.Y.). Therefore the number of photoelectrons () per MeV deposited energy at a given quantum efficiency of a photocathode is of great interest. Additionally, the effect of non-linearities in the response, which might produce a degradation of the energy resolution, should be taken into account.
In the early nineties lead fluoride in its cubic lattice form (-PbF2) was discovered as a Cherenkov radiator for electromagnetic calorimetry [2–4] because of its high transparency and compactness. The optical transmittance of the -PbF2 crystals extends below 270 nm, their radiation resistance is moderate [5] and the A4 collaboration decided to use them in order to exploit their excellent time response ( ns). Since the L.Y. of -PbF2 is low compared to scintillating crystals a search for scintillation in doped and orthorhombic PbF2 was performed in recent years [6,7]. The measurements presented in this paper have proved that the L.Y. of good quality crystals is sufficient for their application in medium and high energy physics experiments. Two methods of accessing the L.Y. will be presented: on the one hand the use of low energy radioactive sources to measure photoelectron distributions and on the other hand a Monte Carlo code to simulate the Cherenkov photon production and detection in the crystals.
One has to consider that PbF2 only emits few photons per MeV of deposited energy, which complicates conventional laboratory measurements. The detection of single photons is usually performed by means of regular photomultiplier tubes (PMTs) as well as by ultraviolet-sensitive multi-wire proportional chambers (MWPCs). Both types of photon sensors are limited in their intrinsic resolution by fluctuations in the number of secondary electrons produced at the first dynode of a PMT or in the avalanche around the anode wire of a MWPC. This limitation favors the use of the recently reinvented hybrid photomultiplier tube (HPMT) with its excellent multiple photon separation and high efficiency. A HPMT consists of a reversely biased silicon P-I-N diode, in which highly accelerated photoelectrons create a few thousand electron-hole pairs with much smaller statistical fluctuations. In Section 2 of this paper it will be shown that a HPMT allows to study the effective L.Y. and related properties of PbF2 crystals.
To realize the second method, the GEANT 3.21 Monte Carlo code [8] was used. The transport of Cherenkov photons from the location of their production to the photocathode requires a step by step tracking through uniform attenuating media to the nearest boundaries. Usually, large computing times are required because photons are refracted or reflected and the tracking has to continue until either absorption, detection or escape of the photons will occur. In Section 3 of this paper, a method is described that avoids the tracking as soon as a look-up table is generated, which tabulates the detection probabilities of a photon depending on its wavelength, its angle relative to the primary particle’s direction and its longitudinal location of production.
Section 4 provides the summary of the L.Y. measurements and simulations.
2 Measurements of the Light Yield
2.1 Experimental Arrangements
For the laboratory measurements at Mainz an electrostatically focused HPMT manufactured by DEP111Delft Electronic Products BV, Roden, The Netherlands with a photocathode of 19 mm useful input diameter was employed. The S20 photocathode featured a high quantum efficiency in the ultraviolet region with 27% at 270 nm and 25% at 400 nm. The HPMT was operated at kV accelerating voltage and with an applied reversed-bias voltage of V. Two electrodes at a potential of kV provided the focusing of the released photoelectrons onto a silicon P-I-N diode. Each bombarding photoelectron led to the creation of electron-hole-pairs, causing an electrical current in the diode. This output signal was subsequently amplified by a low-noise charge pre-amplifier, which was built in the HPMT housing to avoid any unnecessary cabling capacitances by a direct charge coupling. Coincidences between the HPMT signal and a scintillating counter were used to detect the cascading -decay of isotopes. The number of released from the HPMT photocathode on a quartz window were counted to obtain the L.Y. of the crystal. The block diagramme in Fig. 1 (a) illustrates the geometry of the detectors as well as the applied electronic components. The PbF2 crystal was read out by the HPMT whereas the plastic scintillator opposite to the crystal was read out by a regular PMT. The source was placed between the two detectors. Most of the measurements were done with the source, but during parts of the data taking a source was used. Then the scintillator was read out by two coincidence detectors to define the trigger, see Fig. 1 (b). This set-up allowed to measure events in which no particle has hit the PbF2 crystal. A blue LED was used in separate calibration measurements to obtain the HPMT characteristics. All detectors were located in a light-tight box. The crystal and the plastic scintillator were coupled with silicone rubber pads of Elastosil RT 601 with a high transparency and good coupling reproducibility. The pre-amplifier signals have been shaped by a commercially available spectroscopy equipment. The energy spectra were recorded by Constant Fraction Discriminators (CFDs) and Analog-to-Digital Converters (ADCs) accessed by a CAMAC bus. The coincidence measurements exhibited almost no background, but dark counts contributed to false coincidences, i.e. random signals fell accidentally into the measurement gate. The dominant contribution to those counts is the thermal emission of electrons off the photocathode. Its rate depends on the temperature and the stabilization time of the HPMT. Thirty minutes after switching the high voltage on the rate of dark pulses had decreased exponentially to 5% of the initial rate to about 75 counts per second. After some hours of stabilization the rate had further decreased to about 50 counts per second.
2.2 Performance of the HPMT
Measured photoelectron spectra such as the one shown in Fig. 2 have been obtained with very short and highly attenuated LED pulses. The photoelectron distributions are composed of Gaussian shaped peaks corresponding to the overlap of an integer number of released photoelectrons and a continuum. More than 10 photoelectron peaks are clearly separated. A calibration of the obtained spectra in numbers of photoelectrons versus channels of the ADC was possible with an accuracy of 0.026%, since the peak positions showed a very high degree of linearity. The contrast function calculated from the photoelectron peaks of the shown photoelectron distribution is presented in Fig. 3. The straight solid line at 0.03, which is commonly defined as the limit of peak resolution, crosses the exponentially fitted data points at 14 , demonstrating the excellent resolving power of the HPMT. Photon counting measurements with HPMTs of up to fifteen resolved photoelectron peaks have been reported by C. d’Ambrosio [9]. In contrast, PMTs could resolve only two or three photoelectron peaks.
The photoelectron peaks have been fitted and single photoelectron resolutions % ( 1.60 keV) were found almost independent on the peak position. Two effects contribute to this variance: the fluctuations in the number of electron-hole pairs and the electronic noise . The latter must not be neglected in HPMT measurements, because the total gain of a HPMT is of the order of a few thousand whereas the PMT gain is usually of the order of . The set-up with the strontium source and the plastic scintillator as a trigger allowed to measure the width of the pedestals in the ADC distributions of the HPMT spectra. The obtained variance of 9.5% ( 1.43 keV) of the pedestal peak corresponds to the electronic noise and can be subtracted in quadrature from the measured variance, resulting in the intrinsic resolution keV. The continuum in the spectrum is explained by backscattering of the accelerated photoelectrons off the diode surface which re-enter the diode at a smaller angle or with lower energy [9]. The ohmic contact being responsible for the backscattering effect is ion implanted and its thickness amounts to only m. The fraction of backscattered events could be estimated by calculating the ratio of the continuous area to the peak area, which was about 80%.
2.3 Analysis of the Photoelectron Distributions
In the first part of this study, several small PbF2 samples of the dimensions mm3 were used. The samples have been polished on all faces by the manufacturer SICCAS. The average number of detected by the HPMT was determined from the photoelectron distributions using the expression:
where is the calibrated channel number in and the number of counts per channel. The number averaged over a series of measurements amounted to with a good reproducibility. Some of the emitted -rays of the cobalt source undergo Compton scattering and transfer their energy to electrons which produce Cherenkov light. The maximum electron energy can be calculated by using keV, where is the rest mass of the electron. Electrons with velocities below the Cherenkov threshold of cannot contribute to the L.Y.; this limit is equivalent to a minimum electron energy keV. Since the number of emitted Cherenkov photons increases with the electron energy, a mean electron energy keV can be used for evaluating the detector response. Because significant changes have not been observed when comparing the cobalt source spectra with the -excited strontium source spectra, the assumed systematic error in the electron energy of 5% was confirmed. By dividing the mean number of by the mean energy a L.Y. of 1.9 /MeV was obtained. The calculated statistical error of the effective L.Y. of 4% is one order of magnitude larger than the one in the calibration measurements. This is due to the low count rates using the Cherenkov radiator PbF2 and could be improved by longer measurements.
In the second part of the study large size mm3 crystals were investigated. Fig. 4 shows a typical photoelectron distribution where the scale is given in numbers of photoelectrons. Their mean number corresponds to 1.7 /MeV. The difference between the result of the sample and the one of the large crystal is explained by the different light collection efficiency, since this is a function of the crystal’s size, shape and surface finish. The use of a small sample reduces uncertainties in the light collection process due to imperfections of the surface, because most of the light produced inside a sample directly reaches the photocathode.
2.4 Optimization of the Light Yield
Since only a small fraction of the produced Cherenkov photons is detected, the wrapping of the crystals could enhance their L.Y. However, the Cherenkov light is peaked in the forward direction with respect to the primary particle’s direction and the improvement is small compared to scintillation counters. The light collection efficiency for different wrappings was measured with the described set-up and the cobalt source. Wrapping materials investigated were a high density, porous, chalk-loaded polyethylene fleece Tyvek222Du Pont de Nemours, Le Grand Saconnex, Switzerland in two different thicknesses (m and m), two types of PTFE Teflon (m and m), a nitrocellulose membrane333Biometra biomedizinische Analytik GmbH, Göttingen,Germany and a polyvinylidene fluoride named Immobilon-P444Millipore GmbH, Eschborn, Germany (m), which is commonly used as a transfer membrane. The reference L.Y. for the comparison was determined using the unwrapped crystal. The light detected in this measurement is assumed to originate from internal reflections at the polished crystals’ faces. Then, consecutive layers of the different reflectors have been added on all five faces. However, it is known that further layers of material compromise the gain in L.Y. due to the increasing amount of dead material between the crystals, which makes it possible for shower particles to escape the detector. The measured photoelectron distributions have been analyzed according to the method described in the previous section and the results are presented in Table 1. Using two layers of Teflon tape or one layer of Immobilon-P gave the highest effective L.Y., confirming earlier results obtained with a prototype PbF2 calorimeter at the MAMI Microtron. Both wrapping materials resulted in a 12% increase compared to a crystal without wrapping. For this reason the membrane Immobilon-P was chosen for use in the final detector assembly of the A4 calorimeter. The membrane has a nominal pore size of 0.45 m, its mechanical strength is barely sufficient. It is hydrophobic, but it looses its reflectivity when exposed to moisture or coupling grease.
Since the number of is strongly affected by the wavelength-dependent reflectivity of the wrapping material, a comparative measurement has been carried out with the commercial double beam spectrophotometer Shimadzu UV-2101 PC. In Fig. 5 the diffuse reflectance is shown as a function of the wavelength. The reflectivity of the Immobilon-P membrane reached 100% in the visual area of the spectrum and started decreasing at about 310 nm.
To detect the propagating photons, they have to be transmitted through an air gap, an optical grease or a glue to the photocathode. The reflection losses at these boundaries strongly depend on the difference in reflection indices of the PbF2 crystal and the optical coupling. To find the coupling with minimum losses in effective L.Y., the properties of different optical oils, greases and glues were studied in the laboratory measurements. The best result has been obtained with the two-component silicone rubber Elastosil RT 601555Wacker-Chemie GmbH, Burghausen/Obb., Germany. The compound has a viscosity of 5000 mPa s, can be poured on the crystal, and cures at room temperature during 12 hours. Its refractive index () is somewhat lower than that of the entrance window () and significantly lower than that of PbF2 ( at 400 nm). Curing a silicon layer of 0.1 mm thickness in direct contact with the PMT and the crystal not only provided a good optical coupling but also some adherence of the PMT and its base.
3 Monte Carlo Simulations
3.1 The Geometrical Set-up and the Detection Method
For the requirements of the A4 experiment the Cherenkov light production and detection in PbF2 crystals have been simulated using the Monte Carlo code GEANT 3.21 [8]. The geometrical set-up used was a matrix consisting of a array of tapered PbF2 crystals with mm2 front faces and mm2 readout faces and lengths of 150, 155 and 160 mm, all nine crystals pointing to the interaction vertex at a distance of about 105 cm. Air gaps of 300 m between adjacent crystals have been implemented. The number of photons detected by the photon sensor has to be evaluated from their interactions at the crystals’ surface. The reflection coefficient of the surface finish parameterizes its reflectivity from perfect smoothness to maximum roughness. A reasonable number of was found by a comparison with measurements comprising PbF2 crystals at the MAMI electron beam. This value includes the diffuse reflectance of the Immobilon-P transfer membrane. The characteristics of 1 inch diameter Philips XP2910 PMTs with borosilicate entrance windows and bi-alkali cathodes have been used to simulate the photon detection. The internal transmittancies of the crystals and of the entrance windows have been measured with the above mentioned spectrophotometer.
To simulate the Cherenkov photon production and detection the GTCKOV tracking routine of the GEANT code can be used, wherein the photons are subject to in flight absorption and medium boundary action [8]. This photon transport mechanism requires an evaluation of the length that the individual photon can travel in the current medium before each of the possible processes will occur. These numbers are the different interaction lengths and the minimum among these defines the step length over which the photon will be transported. In addition, the distance from the photon’s location to the nearest boundary has to be calculated and compared with the interaction lengths. This method usually consumes large computing time, since huge amounts of produced Cherenkov photons have to be tracked along small steps to the photocathode.
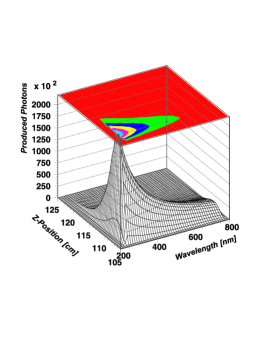
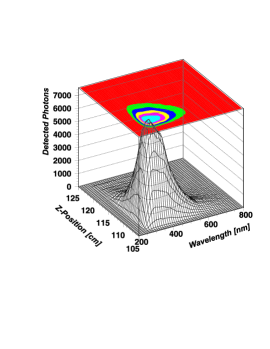
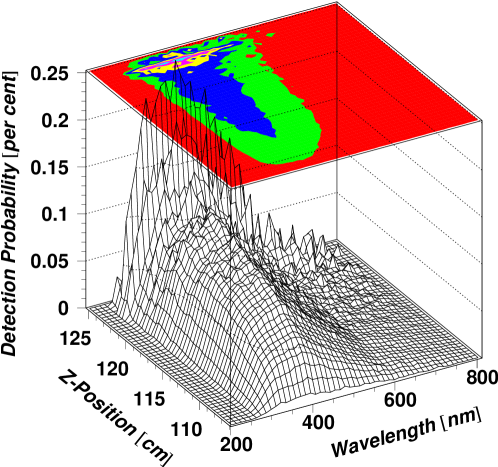
In order to accelerate the Monte Carlo simulation, the characteristics of the Cherenkov photons have been investigated. First, the number of generated photons has been determined as a function of the photons’ wavelength , their angle to the primary particle’s direction and their longitudinal location of production . This simulation was done with a full tracking of the Cherenkov photons by the GTCKOV routine and three-dimensional spectra of produced and detected photons were obtained. The two-dimensional projection vs. of the produced photons inside the array of PbF2 is shown in Fig. 6 (a). The spectrum of the subset of these photons detected at the photocathode is shown in Fig. 6 (b). The shape of the latter distribution along the -direction reflects the transmission of the bulk crystal, the surface properties, the transmission of the entrance window and finally the quantum efficiency of the PMT. The distribution exhibits a steep rise at 270 nm, followed by a maximum at 330 nm, and a slower decrease up to a wavelength of about 600 nm. The shape of the distribution along the -direction corresponds to the longitudinal profile of the Cherenkov photon shower. To obtain the detection probability the three-dimensional spectrum of detected photons was divided by the spectrum of produced photons. The resulting probability distribution is shown in Fig. 7. The full tabulated probability distribution has been implemented as a look-up table in the simulation code, so that for subsequent simulations the probability of all produced Cherenkov photons could be compared with a randomly generated number. If was larger than the random number, it was assumed that the photon could be detected, otherwise it was supposed to be absorbed. This method avoids the tracking of photons, and this reduces the computing time by a factor of fifty, which allows to simulate the detector response and more complex geometries in reasonable time scales.
3.2 Simulated Properties of the Cherenkov Light
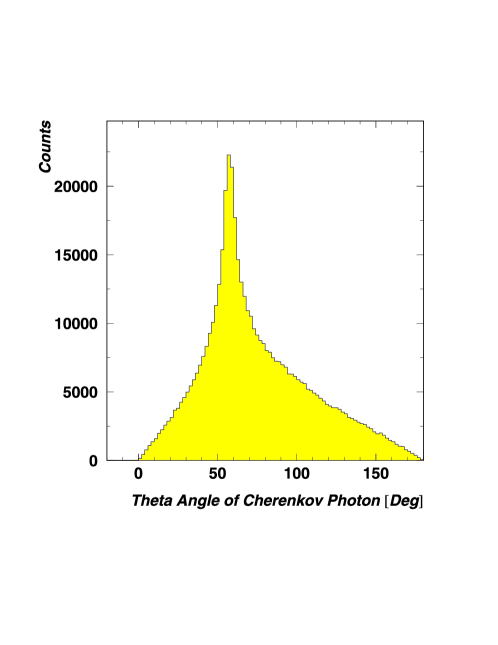
The half-angle of the Cherenkov cone is a characteristic observable for a particle with velocity in a medium with the index of refraction . Depending on the lateral development of the electromagnetic shower particles an angular distribution of the emitted Cherenkov photons as shown in Fig. 8 was evaluated. The maximum of the distribution at 56∘ is clearly pronounced, which corresponds to the half-angle of relativistic leptons, but tails of the distribution reach 0 and 180 degrees. The calculated number of radiating leptons per event was lep./GeV. The distribution of the number of photons produced per centimeter path length extended from only few photons up to a limit of photons/cm. The strong rise to the limit is due to the low rest mass of the electrons and positrons. The value of the obtained limit is in accordance with the theoretical number, which can be calculated by the following equation [10]:
The lateral distribution of the Cherenkov photons was found to be narrower than the distribution of the energy deposition in the electromagnetic shower. This is caused by the decreasing fraction of energy which is carried by the leptons with increasing depth inside the crystals [10] and due to the larger fraction of leptons with increasing lateral extension that have energies below the Cherenkov threshold of 608 keV. This results in an apparent Molière radius cm which is smaller than the nominal radius cm (see e. g. [2]).
3.3 Light Yield and Detector Response
Cherenkov radiators are characterized by their effective L.Y. and their intrinsic non-linearity. The best energy resolution will be achieved when the L.Y. is large and proportional to the energy of the primary particle. Since is small, its fluctuations % at 734 MeV contribute considerably to the energy resolution of the crystals. The total number of produced Cherenkov photons amounted to photons at 855 MeV, which is equivalent to 23.4 photons/MeV. This number, however, is of low significance, because the photons are subject to a multitude of processes reducing the number by about 90%. For that reason it is more interesting to determine the number of detected by a photon sensor of given type and sensitivity. This effective L.Y. is a function of and depends on the light collection efficiency, the quantum efficiency and the efficiency of the photoelectron collection. In a array the simulated L.Y. at 855 MeV was which corresponds to an effective L.Y. of /MeV. By using a set-up consisting of only a single crystal a L.Y. of 2.10 /MeV was calculated. This value was simulated at energies above 10 MeV and could be compared with the low energy measurements, but one has to be aware that the simulation does not include small imperfections in the light and photoelectron collection. In contrast, the real crystals exhibited minor defects in the bulk material and on the surface. In addition, the detector response is degraded at such low electron energies. Together both facts presumably explain the small difference between the simulated and measured L.Y.
Calculations using different electron energies provided a measure of the detector response and its differential non-linearity, which is defined by the variation in the L.Y. as a function of the energy of primary particle. At energies between 10 and 1000 MeV the L.Y. increased monotonically between 2.52 and 2.54 /MeV. The projection of the detection probability distribution on the axis of the photon’s longitudinal location of production is interesting in terms of the non-linearity of the L.Y. As can be inferred from Fig. 7., its slope in -direction is 0.12% per cm at the position of the shower maximum at 5 cm inside the crystal ( 110 cm).
4 Summary
The L.Y. of the Cherenkov radiator PbF2 has been studied, because the parity violation experiment at MAMI requires a good energy resolution of its electromagnetic calorimeter and a high L.Y. of their crystals. It is shown that a HPMT can be used to obtain the effective L.Y. Measurements with a low energy -source as well as with a -source revealed a number of /MeV with 4% statistical and 5% systematic error. The L.Y. was increased by using appropriate wrappings on the crystal and a well adapted coupling to the photon sensor. The latter results confirmed that the Immobilon-P membrane is the best wrapping material to be used with Cherenkov crystals.
Monte Carlo simulations have been performed in order to evaluate the L.Y. of an electromagnetic calorimeter consisting of PbF2 crystals. By establishing a method to accelerate the GEANT code a computing time reduction by a factor of fifty was achieved. Nevertheless, a simulation with full Cherenkov photon tracking was still needed to obtain the detection probability distribution. This approach was used to simulate various experimental implications and geometrical effects. An effective L.Y. of /MeV for a single PbF2 crystal was calculated, which agrees fairly well with the HPMT measurements, taking small imperfections of the crystal and a lower detector response at very low energies into account. The L.Y. is very high compared to other Cherenkov radiators and is needed to obtain the good energy resolution required by the parity violation experiment. Besides, the simulations predicted a very high linearity of the response in the energy range between 10 and 1000 MeV with a variation smaller than 1%. This promising result confirms that PbF2 is very well suited for its use as a calorimeter material, since larger non-linearities would have degraded the energy resolution.
References
- [1] D. v. Harrach, Measurement of Parity Violating Electron Scattering on Hydrogen, Proposal for an Experiment A4/1-93, Mainz Microtron MAMI, Gutenberg-University Mainz, Germany, 1993.
- [2] D. F. Anderson et al., Lead Fluoride: an Ultra-compact Cherenkov Radiator for EM Calorimetry, Nucl. Instrum. Methods Phys. Research A290, 385–389 (1990).
- [3] C. L. Woody et al., A Study on the Use of Lead Fluoride for Electromagnetic Calorimetry, IEEE Trans. Nucl. Sci. 40(4), 546–551 (1993).
- [4] R. D. Appuhn et al., Electromagnetic Calorimetry with Lead Fluoride Crystals, Nucl. Instrum. Methods Phys. Research A350, 208–215 (1994).
- [5] P. Achenbach et al., Radiation Resistance and Optical Properties of Lead Fluoride Cherenkov Crystals, Nucl. Instrum. Methods Phys. Research A416(2–3), 357–363 (1998).
- [6] S. N. Baliakin et al., Deformation and Thermal Treatment Application to Heavy Scintillators Production, in HEAVY SCINTILLATORS for Scientific and Industrial Applications, edited by F. de Notaristefani et al., pages 587–591, Gif-sur-Yvette Cedex, France, 1993, Editions Frontières, Proc. ’CRYSTAL 2000’ in Chamonix, France, September 22–26, 1992.
- [7] D. F. Anderson et al., Search for Scintillation in Doped and Orthorhombic Lead Fluoride, Nucl. Instrum. Methods Phys. Research A342, 473–476 (1994).
- [8] Application Software Group, Geant Detector Description and Simulation Tool, CERN Computing and Networks Division, Geneva, Switzerland, 1994, Cern Program Library Long Writeup W5013.
- [9] C. d’Ambrosio, T. Gys, D. Piedigrossi, D. Puertolas, and S. Tailhardat, Photoncounting with a Hybrid Photomultiplier Tube (HPMT), Nucl. Instrum. Methods Phys. Research A338, 389–397 (1994).
- [10] Particle Data Group, Review of Particle Physics, Eur. Phys. Jour. C 15(1–4), 1–878 (2000).


| Wrapping Material | No. of Layers | Thickness [m] | L.Y. [%] |
|---|---|---|---|
| Immobilon-P | 1 | 140 | 112.1 |
| Teflon Tape | 2 | 160 | 112.1 |
| Teflon + Al | 111.5 | ||
| Teflon | 3 | 75 | 110.5 |
| Teflon Tape | 1 | 80 | 109.7 |
| Tyvek | 1 | 140 | 108.6 |
| Teflon + Al | 108.0 | ||
| Tyvek | 1 | 80 | 106.9 |
| Teflon | 2 | 50 | 106.5 |
| Office Paper | 1 | 100 | 105.8 |
| Teflon | 1 | 25 | 102.7 |
| Unwrapped | 100.0 |