Negatively Charged Hadron Spectra
in Au+Au Collisions at = 130 GeV
Abstract
Negatively charged hadron () production in Au+Au collisions at BNL-RHIC is studied with the STAR experiment. Results are presented on multiplicity, pseudorapidity and transverse momentum distributions at = 130 GeV.
1 Introduction
Global observables such as the multiplicity and the inclusive single particle transverse momentum () and pseudorapidity () distributions of hadrons have been valuable tools in studying heavy ion collisions. They represent the system at kinetic freeze-out, late in the evolution of the system when hadrons no longer interact with each other, and their momentum spectra do not change further. These final-state observables supply essential constraints on the possible evolutionary paths of the system that can help establish conditions in the early, hot and dense phase of the collision. A discussion on global observables can be found in [1]. We summarize here results on the minimum-bias multiplicity, and spectra of negatively charged hadrons.
2 Experiment and Analysis
The STAR experimental setup for the first RHIC run is described in [2]. The analysis is based on charged particle tracking in the STAR Time Projection Chamber (TPC). Triggering was achieved using two hadronic calorimeters (ZDCs) in the very forward region and an array of scintillator slats arranged in a barrel (CTB) around the TPC.
Particle production was studied through the yield of primary negative hadrons (), i.e. , and including the products of strong and electromagnetic decays. Low momentum () particle identification was done via in the gas of the TPC. Only negatively charged hadrons were studied in order to exclude effects due to participant nucleons. Charged particle tracks reconstructed in the TPC were accepted if they fulfilled requirements on number of points on the track and on pointing accuracy to the event vertex. The measured raw distributions were corrected for acceptance, reconstruction efficiency, contamination due to interactions in material, misidentified non-hadrons, the products of weak decays, and track splitting and merging. The tracking efficiency was found by embedding simulated tracks into real events at the raw data level, reconstructing the full events, and comparing the simulated input to the reconstructed output.
For this analysis, the acceptance for tracks within the fiducial volume having greater than 0.3 is found to be 95%. The tracking efficiency is found to be between 70–95%, depending on the particle and the total multiplicity of the event.
3 Results and Discussion
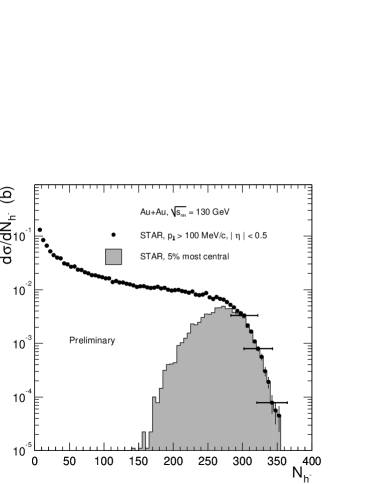
Figure 1 shows the multiplicity distribution for minimum-bias Au+Au collisions with and . The data were normalized assuming a total hadronic inelastic cross section of 7.2 barn for Au+Au collisions at = 130 GeV, derived from Glauber model calculations [3, 4].
The systematic error on the vertical scale is estimated to be 10% and is dominated by uncertainties of the total hadronic cross-section and the shape at low . The systematic error of 6% on the horizontal scale is depicted by horizontal error bars on a few data points.
The shape of the distribution is dominated by the collision geometry: large cross section at low multiplicity, corresponding to large impact parameter, followed by a region of slowly falling cross section over a wide range of multiplicity as the nuclei overlap, and a rapid decrease for near head-on collisions, where the shape is determined by fluctuations in the collision geometry and particle production process given the finite detector acceptance. The distribution for the 5% most central collisions (360 mbarn), defined via ZDC coincidence, is shown as the shaded area in Fig. 1.
Figure 2, upper panel, shows the distribution for the 5% most central collisions at midrapidity (). Only statistical errors are shown; the systematic errors are estimated to be below 6%. The data are fit by a power-law function of the form . As reference data sets, we also show the -distribution of negatively charged hadrons for central Pb+Pb collisions at = 17 GeV from NA49 [5] and for minimum-bias collisions at = 200 GeV from UA1 [6], fitted with the same function. The UA1 invariant cross-section reported in Ref. [6] was scaled by , where mb. The spectrum measured by STAR reflects a systematic increase in compared to that from both central A+A collisions at much lower energy (NA49) and collisions at a comparable energy (UA1).
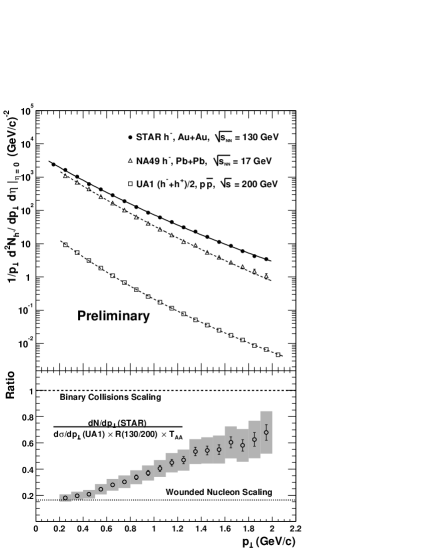
The lower panel of Fig. 2 shows the ratio of the STAR and UA1 -distributions. Since the UA1 distribution is measured at = 200 GeV, the invariant cross-section in each -bin is scaled by two factors for a quantitative comparison to the STAR data: (i) , the -dependent ratio of the yields in collisions at = 130 and 200 GeV, and (ii) = 26 mb-1, the nuclear overlap integral [8] for the 5% most central Au+Au collisions. See [7] for further details.
There are two simple predictions for the scaled ratio. The study of lower energy collisions has shown that the total pion yield due to soft (low ) processes scales as the number of participants, i.e. , “wounded” nucleons () in the collision, (e.g. [5]). The scaled ratio in this case is 0.164 assuming 172 participant pairs [4] and a mean number of binary collisions () of for the 5% most central Au+Au events. We assume mb for collisions at GeV. If hadron production is due to hard (high ) processes and there are no nuclear-specific effects (see below), the hadron yield will scale as , which is proportional to the nuclear overlap integral . In this case the value of the ratio is unity. There are important nuclear effects which should alter the scaling from these simple predictions, including e.g. initial state multiple scattering [9], jet quenching [10], and radial flow [11]. Each of these exhibits characteristic features as a function of and system size. The scaled ratio shows a strong dependence, starting close to scaling at low and approaching scaling, not reaching the latter in the measured range even including the errors from the and scaling shown in gray. This behaviour is consistent with the presence of radial flow, as well as the onset of hard scattering contributions and initial state multiple scattering with rising . The shape of the distribution at higher is discussed in [7].
The density at midrapidity for and is . Extrapolation to = 0 yields . Assuming an average of 172 participant pairs per central Au+Au collision, this corresponds to per participant nucleon pair per unit of pseudorapidity. This is a 35% increase over collisions at the same energy [12]. Comparison with central collisions at SPS [5] shows an increase in the yield per participant of 49% at RHIC.
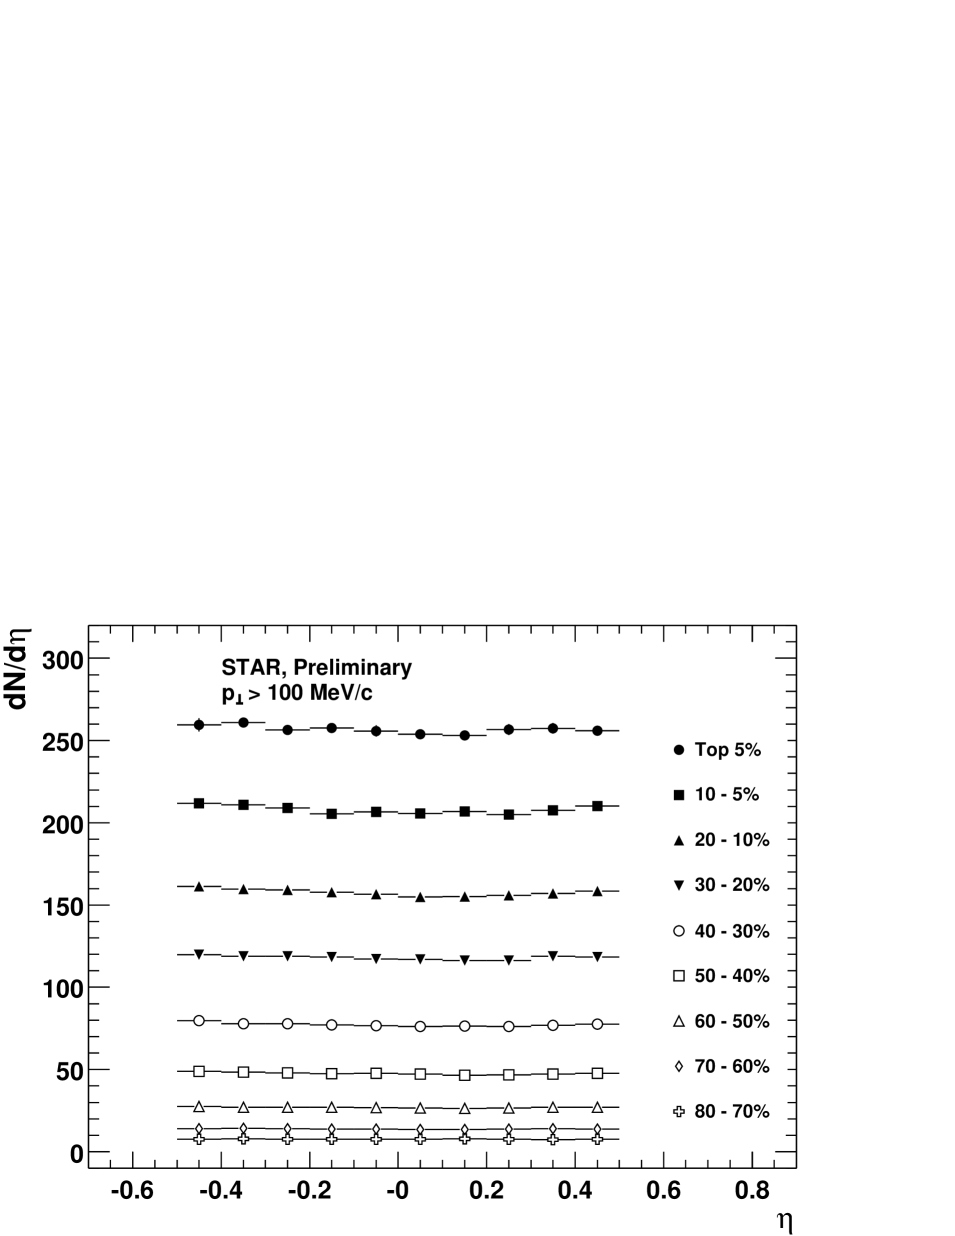
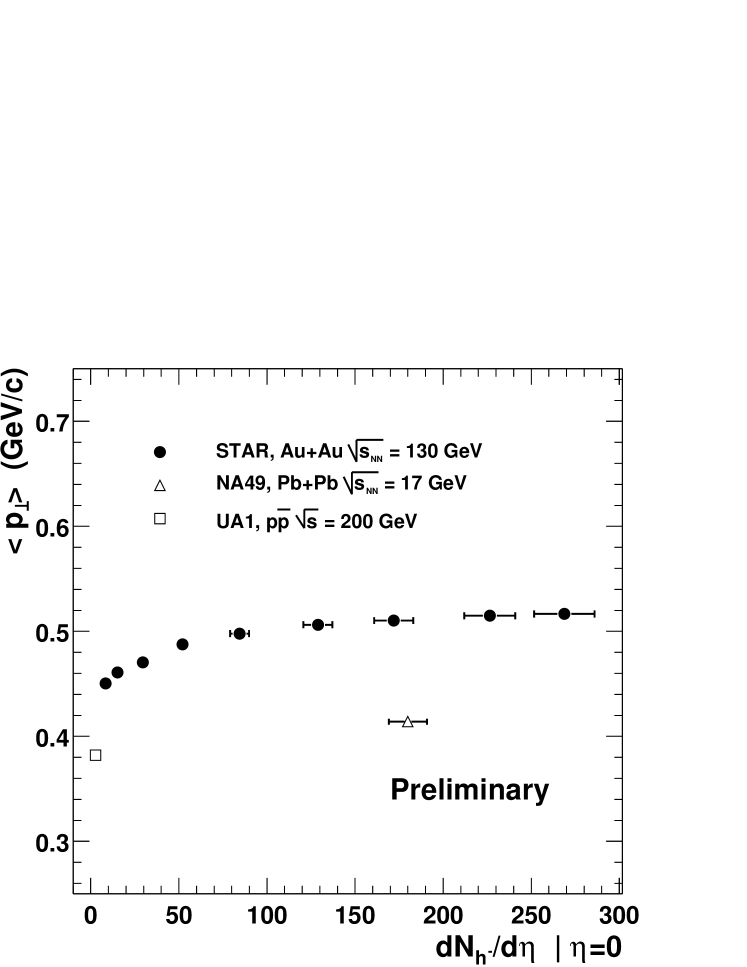
Fig. 4 shows the centrality dependence of the distribution. One sees the expected rise in particle yield with collision centrality. Preliminary analysis shows very little difference in the shape of the distribution at midrapidity with increasing centrality. Using again a power-law fit to the spectra we obtain which is shown in Fig. 4 as a function of centrality. Errors on the horizontal scale are systematic. We see an increase in of 15% from the most peripheral to the most central events. The values for the UA1 and NA49 reference data sets are also shown.
4 Conclusion
We have presented preliminary results on charged particle production at RHIC. We find per participant in central collisions at =130 GeV increases by 35% relative to and 49% compared to nuclear collisions at = 17 GeV. The distribution is harder than that of the reference systems for the region up to 2 , with the most central events having the highest . Scaling of produced particle yield with number of participants shows a strong dependence on , with Wounded Nucleon scaling achieved only at the lowest measured .
References
- [1] K. J. Eskola, these Proceedings. See also J.-P. Blaizot, Nucl. Phys. A 661, 3c (1999).
- [2] F. Retière, these Proceedings. K.H. Ackermann et al., Nucl. Phys. A 661, 681c (1999).
- [3] A.J. Baltz, C. Chasman, and S.N. White, Nucl. Instr. Meth. A 417, 1 (1998).
- [4] D. Kharzeev and M. Nardi, Phys. Lett. B 507 121 (2001) nucl-th/0012025.
- [5] H. Appelshäuser et al., Phys. Rev. Lett. 82, 2471 (1999).
- [6] C. Albajar et al., Nucl. Phys. B 355, 261 (1990).
- [7] J.C. Dunlop, these proceedings.
- [8] K. J. Eskola, K. Kajantie, and J. Lindfors, Nucl. Phys. B 323, 37 (1989).
- [9] D. Antreasyan, Phys. Rev. D 19, 764 (1979).
- [10] X.N. Wang, Phys. Rev. C 58, 2321 (1998).
- [11] P. F. Kolb, J. Sollfrank, and U. Heinz, Phys. Rev. C 62, 054909 (2000).
- [12] G.J. Alner et al., Z. Phys. C 33, 1 (1986).