Observation of
and with STAR
Abstract
We report the first observation of the reactions and with the STAR detector. The are produced at small perpendicular momentum, as expected if they couple coherently to both nuclei. We discuss models of vector meson production and the correlation with nuclear breakup, and present a fundamental test of quantum mechanics that is possible with the system.
1 Introduction
With their large charge (), relativistic heavy ions can interact electromagnetically, even at impact parameters much larger than twice the nuclear radius . In these ultra-peripheral collisions, the two nuclei act as sources of fields. The electromagnetic fields have a long range, so two-photon and photon-Pomeron interactions have large cross sections. Exclusive Pomeron-Pomeron reactions have a small cross section because of the short Pomeron range. The amplitudes for the photon or Pomeron emission from each nucleon add. The momentum transfer is small enough that the amplitudes all have the same phase, so the coupling is coherent over the entire nucleus. The cross section for two-photon interactions goes as ( with gold ions). For photon-Pomeron interactions, for ’heavy’ states like and for lighter mesons. This scaling leads to large cross sections. The coherence constrains the fields to have perpendicular momentum and longitudinal momentum . Final states can have masses up to (6 GeV at RHIC). The final state is less than .
Photon-Pomeron or photon-meson interactions produce vector mesons, as in Fig. 1(a). The Pomeron is a colorless object with the same quantum numbers as the vacuum. Photon-Pomeron interactions can be described in terms of elastic scattering. A photon from the electromagnetic field of one nucleus fluctuates to a state. This state then elastically scatters from the other nucleus, emerging as a vector meson. Vector meson dominance allows us to calculate the rate for this process by treating light states directly as vector mesons. At RHIC, , , and are copiously produced, and the should be observable. The upsilon family may be observable with lighter ion beams.

Two-photon interactions include pair production, single meson production, and meson pair production. Since the coupling ( for gold) is large, pair production is an important probe of quantum electrodynamics in strong fields. Coupling to 2-photons is sensitive to a mesons internal charge (quark or gluon content). These physics topics are reviewed elsewhere[1][2].
These reactions can be studied experimentally by selecting events with low multiplicities and small total . We present a study of production with and without nuclear excitation, based on data taken with the STAR (Solenoidal Tracker at RHIC) detector at RHIC at a center of mass energy of GeV per nucleon pair. STAR is a collaboration of about 320 physicists from 31 institutions in 8 countries.
2 Expected Rates
The cross section to produce a meson is the convolution of the photon spectrum from one nucleus with [3]. The photon flux from one nucleus is given by the Weizsäcker-Williams virtual photon approach; the small photon virtuality is negligible here. For a photon-Pomeron or two-photon interaction to be visible, there cannot be an accompanying hadronic interaction. This requirement is similar (but not identical) to requiring ; it reduces the photon flux by roughly a factor of 2.
The photon-nucleus cross section can be determined by a Glauber calculation that uses the as input. The rate depends on how vector mesons interact with nucleons. The RHIC vector meson production rates can be used to determine the vector meson-nucleon cross section. The cross sections are very large, 380 mb for production with gold ions at GeV. This is about 5% of the hadronic cross section. At design energy and luminosity, RHIC is expected to produce 120 each second. The production rates are high enough that rare meson decays should be accessible, and excited vector mesons such as the , and can be studied.
Photons can also fluctuate to virtual pairs. One of the can interact with the target nucleus, and the pair can become real. The amplitude for is independent of the pair invariant mass . Direct production interferes with production, so their amplitudes add[4]; the cross section is
| (1) |
where and are the amplitudes for and production. The width must be corrected for the increasing phase space as increases. Several methods have been proposed; we take , where is the pion momentum in the rest frame, and when [5] and MeV/c2, MeV/c2[6]. The spectrum also includes a small component from which is neglected here.
As Eq. (1) shows, the and interference is constructive for . Around , the component shifts phase by , and at higher masses, the interference is destructive. This skews the overall distribution.
2.1 Vector Meson production with Nuclear Excitation
Vector meson production can be accompanied by nuclear excitation, as in Fig. 1(b). For this, diagrams like Fig. 1(b) are expected to be dominant. One or more additional exchanged photons can excite one or both nuclei to a giant dipole resonance. Higher collective excitations or nuclear breakup are also possible. However, photons directly involved in two-photon or photon-Pomeron interactions are unlikely to also excite the emitting nucleus[7]. Pomeron emission (elastic scattering) is less likely to cause collective excitation than photon emission because Pomerons couple identically to protons and neutrons. Neglecting other production diagrams, the production probability factorizes and
| (2) |
where is the dependent probability of production a , around 0.5% for . The dependence comes entirely from the photon flux.
The single nucleus excitation probability is [1], where includes terms for different types of photo-disintegration. GDR excitation is the largest, but higher excitations and other photonuclear reactions also contribute. For gold at RHIC, fm2. The probability of exciting both nuclei, , with [8]. These relationships assume that the excitation of the two nuclei occurs independently.
is the hadronic interaction probability, which can be approximated as 1 for ; 0 otherwise. The cross section for vector meson production with nuclear excitation is expected to be more than an order of magnitude smaller than for exclusive vector meson production.
2.2 Interference and the Vector Meson Spectrum
Photons have a long range, and Pomerons (elastic scattering) have a short range, so vector meson production must occur inside or near (within 1 fermi) one of the nuclei. Either nucleus can serve as the emitter or scatterer; the two possibilities are indistinguishable, so their amplitudes add and the two sources interfere. At mid-rapidity (), the contributions from the two sources are equal.
Vector mesons have negative parity, so the cross section at is[9]
| (3) |
where is the production amplitude, the impact parameter vector, and the vector meson momentum. For a given , oscillates with period . For , the interference is destructive, and is small. Of course, is not observable in heavy ion collisions, so Eq. (3) must be integrated over all . When this is done, the oscillations wash out except for , where the cross section drops sharply. Fig. 2 shows the expected cross section as a function of .

This interference is of special interest because vector mesons decay quickly, before travelling the distance required so their wave functions can overlap. The decay distance is less than 1 fermi, far less than the fermi at RHIC (and fermi at the LHC). So, the vector mesons cannot interfere. However, their decay products can interfere, as long as the system wave function retains information on all possible decay amplitudes long after the decay occurs. Otherwise, for example, a decay at one nucleus couldn’t interfere with a hadrons at the other. The observation of interference will be a clear demonstration that the wave function doesn’t collapse until after it is observed. Here, the ’observation’ occurs via an interaction with the beampipe surrounding the collision region.
3 Data Collection, Triggering and Analysis
We have studied exclusive production with the STAR detector. Data on gold-on-gold collisions at GeV was collected during the Summer 2000 run. In this data, collisions could occur every 210 nsec. At STAR, the luminosity reached a maximum of about /cm2/s.
STAR detects charged particles in a 4.2 meter long time projection chamber (TPC)[10]. The TPC has an inner radius of 50 cm, and an outer radius of 2 m. The TPC is centered around the interaction region. The pseudorapidity acceptance for charged particles depends on the particle production point; for the data discussed here, the interactions were spread longitudinally (in ), with cm. The pseudorapidity () acceptance of the trigger and track reconstruction depend on the individual vertex position. For a vertex at , the trigger was sensitive to charged particles with ; the tracking covered a somewhat larger solid angle. A solenoidal magnet surrounds the TPC; for this data, the field was 0.25 T. In this field, the TPC momentum resolution was about . Tracks with MeV/c were reconstructed with good efficiency. Tracks were identified by their energy loss in the TPC; this was measured with a resolution of about 8%.
The TPC is surrounded by a cylindrical central trigger barrel (CTB). For tracks from the center of the interaction region, it is sensitive to tracks with . This barrel consists of 240 scintillator slats, each covering by . The scintillator light output is digitized to 8 bits of accuracy on each crossing. In the 0.25 T magnetic field, the scintillator was sensitive to charged particles with MeV/c.
Two zero degree calorimeters (ZDCs) at meters from the interaction point detect neutrons from nuclear breakup[11]. These calorimeters are sensitive to single neutrons, and have an acceptance of close to 100% for neutrons from nuclear breakup.
The trigger hardware has several levels. The initial Level 0 decision uses lookup tables and field programmable gate arrays to initiate TPC readout about 1.5 s after the collision. The other level used here, Level 3, is based on on-line reconstruction using a small farm of processors[12]; a level 3 acceptance triggered event building and data transfer to tape.
3.1 Triggering and Data Collection
We studied production with two separate triggers. The topology trigger was designed to trigger on decay products detected in the CTB system. A minimum bias trigger used the ZDCs to select events where both nuclei dissociated.
The topology trigger was sensitive to a number of different backgrounds. The major ones were cosmic rays, beam gas interactions, and debris from upstream interactions[13]. The latter refers to beam gas and/or beam-beampipe collisions far upstream from STAR; the usual manifestation was one or more tracks in the TPC roughly parallel to the beampipe, often accompanied by softer debris, perhaps from interactions in the TPC wheel or magnetic pole tip.

Fig. 3 shows how the topology trigger divided the CTB into 4 azimuthal quadrants. It selected events with at least one hit in the North and South sectors. The top and bottom quadrants were used as vetos to reject most cosmic rays. The trigger rate varied from 20 to 40 Hz, depending on luminosity. Triggered events were scrutinized by the Level 3 trigger, which reconstructed charged tracks online. Events with more than 15 tracks, or with a vertex far outside the interaction diamond were rejected. The multiplicity cut removed central collision events which left remnant energy in the trigger detectors; this remnant energy could cause a topology trigger on subsequent beam crossings. The vertex cut removed debris from upstream interactions, cosmic rays, and beam gas events. These cuts rejected 95% of the events, leaving 1-2 events/second for event building and storage. In about 7 hours of data taking, we collected about 30,000 events with this trigger. The luminosity ranged from about /cm2/s up to (briefly) /cm2/s,
The minimum bias trigger required a coincidence between the two zero degree calorimeters. The thresholds were set so that the efficiency was high for single (or more) neutron deposition. This trigger ran throughout the STAR data taking. This analysis is based on about 400,000 events.
3.2 Exclusive Analysis
Our analysis selected events with exactly two reconstructed tracks in the TPC. The tracks were vertexed with a low-multiplicity vertex finder, and required to form a vertex within 2 cm of the TPC center in and , and within 2 m in . The vertexer projected the tracks back from the TPC to the interaction region with allowance for multiple scattering. Events were accepted if the two tracks were consistent with coming from a single vertex.
As the position of the vertex increases, the solid angle covered by the TPC decreases, so events at larger are subject to more background by higher-multiplicity processes where one or more tracks is missed. The major analysis backgrounds were grazing nuclear collisions, incoherent photonuclear events, and beam gas events. Some cosmic rays also remained.
To reject the remaining cosmic rays, track pairs were required to be at least slightly acoplanar, with a 3-dimensional opening angle less than 3 radians. This necessary cut reduced the reconstruction efficiency near , where the two pion tracks are nearly back-to-back.
Track was required to be consistent with that expected for a pion. Unfortunately, in the kinematic range for , the and bands overlap, and only a few events were rejected.
Fig. 4(a) shows the spectrum of the topology triggered pairs that pass these cuts, for unlike sign (dots - net charge 0) and like sign pairs (histograms). For the unlike pairs, a large peak is visible at MeV/c. This is consistent with production that is coherent with both nuclei; the events with MeV/c are considered our signal. The like sign pairs have no such enhancement, and can serve as a background sample. The like-sign pairs have been normalized to match the unlike sign in the signal-free region 0.1 GeV 1.0 GeV; this entailed scaling them up by a factor of 2.1.
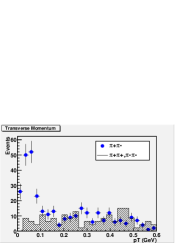
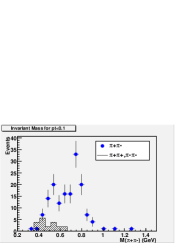
Fig. 4(b) shows the invariant mass of the pairs with MeV/c. The points are the unlike sign events, while the hatched histogram are the scaled like-sign pairs. The like-sign pairs are concentrated at relatively low masses, while the net charge 0 pairs have a peak around the rho mass. We will consider the peak shape later, for the summed spectrum from both analyses.
3.3 with Nuclear Excitation Analysis
Events were selected by the minimum bias trigger, which took data throughout the summer. The acceptance for these events was independent of the kinematics and the CTB calibration, simplifying the interpretation.
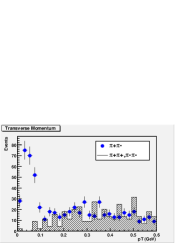
The event selection was the same as for the topology trigger sample. Fig. 5(a) shows the distribution of 2-track events. The opposite sign pairs show the same peak at MeV/c as the topology triggered data. The like sign background shows no peak, and, in fact, goes to zero as , as expected for a phase-space distribution. The like-sign pairs were scaled up to match the un-like sign pairs in the region 0.1 GeV 1.0 GeV; this scaling factor was 2.3.

This data contains little background from beam gas and incoherent photonuclear events, which are unlikely to deposit energy in both ZDCs. However, the background from grazing nuclear collisions is larger.
Fig. 5(b) shows the distribution for MeV/c in the same data, along with the scaled like-sign background. The signal is peaked around the mass.
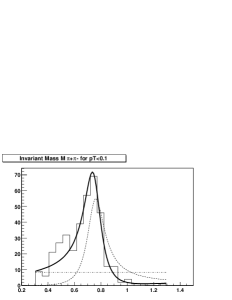
To improve the statistics, the minimum-bias and topology triggered samples are combined into a single spectrum, shown in Fig. 6. The spectrum is fit to Eq. (1). In the fit, and are fixed to minimize the number of free parameters. However, if the mass and width are allowed to float, the found values are consistent with the actual values. We find the relative size of the contribution, (statistical error only). This ratio is somewhat larger than that found by the ZEUS collaboration, at the same momentum transfer[14]. This is unexpected, since the component should have a higher nuclear absorption cross section, so should drop as the target atomic number increases[15].
The background (not yet subtracted) may include a component from electromagnetic pair production, which would also be produced with low . The background is concentrated at low , so a subtraction will reduce the apparent component.
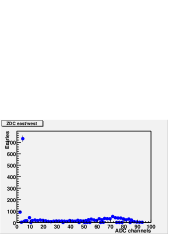
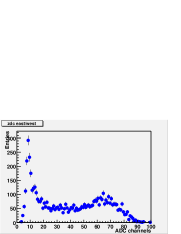
Fig. 7 compares the ZDC values from the two datasets. The minimum bias data shows a clear single-neutron peak, with a significant component at higher energies. In contrast, the topology triggered data shows almost no energy deposition. This shows that the two processes are clearly distinguishable.
4 Conclusions
We have observed for the first time the reactions and . The are produced at small perpendicular momentum, showing their coherent coupling to both nuclei.
In the coming year, we expect to greatly expand the physics reach of the STAR ultra-peripheral collisions program. The improvement will come from many factors, among them the increasing capability of the STAR trigger, the additional detectors being installed in STAR, the increased beam energy, and the increased luminosity and running time. We plan to run the peripheral collisions trigger in parallel with the central collisions trigger(s), greatly increasing our data collection capabilities. The increased statistics will allow us to definitively detector or rule out interference among the two vector meson production sites. We will also be able to study two-photon production of mesons, and photoproduction of excited vector mesons.
Notes
-
a.
The collaboration membership is listed at http://www.star.bnl.gov/STAR/smd_l/collab/collab _sci_apr01.ps.
References
- [1] G. Baur, K. Hencken and D. Trautmann, J. Phys. G 24, 1657 (1998).
- [2] S. Klein, preprint physics/0012021, to appear in Proc. 18th Advanced ICFA Beam Dynamics Workshop on Quantum Aspects of Beam Physics, World Scientific, 2001.
- [3] S.R. Klein and J. Nystrand, Phys. Rev. C 60, 014903 (1999).
- [4] P. Söding, Phys. Lett. 19, 702 (1966).
- [5] J. D. Jackson, Nuovo Cimento XXXV, 6692 (1964).
- [6] D. E. Groom et al., Eur. Phys. J, C15, 1 (2000).
- [7] K. Hencken, D. Trautmann and G. Baur, Z. Phys C68, 473 (1995).
- [8] A. J. Baltz, M. J. Rhoades-Brown and J. Weneser, Phys. Rev. E 54, 4233 (1996).
- [9] S.R. Klein and J. Nystrand, Phys. Rev. Lett. 84, 2330 (2000).
- [10] H. Wieman et al., IEEE Trans. Nucl. Sci. 44, 671 (1997).
- [11] C. Adler et al., nucl-ex/0008005.
- [12] J. S. Lange et al., Nucl. Instrum. Meth. A453, 397 (2000).
- [13] J. Nystrand and S. Klein, nucl-ex/9811007, in Proc. Workshop on Photon Interactions and the Photon Structure, eds. G. Jarlskog and T. Sjöstrand, Lund, Sweden, September 1998.
- [14] J. Breitweg et al., Eur. Phys. J C2, 247 (1998). The quoted ratio is from their Fig. 8a, at .
- [15] G. McClellan et al., Phys. Rev. D4, 2683 (1971).