The liquid to vapor phase transition in excited nuclei
Abstract
For many years it has been speculated that excited nuclei would undergo a liquid to vapor phase transition. For even longer, it has been known that clusterization in a vapor carries direct information on the liquid- vapor equilibrium according to Fisher’s droplet model. Now the thermal component of the GeV/c Au multifragmentation data of the ISiS Collaboration is shown to follow the scaling predicted by Fisher’s model, thus providing the strongest evidence yet of the liquid to vapor phase transition.
pacs:
25.70 Pq, 64.60.Ak, 24.60.Ky, 05.70.JkNuclear multifragmentation, the break up of a nuclear system into several intermediate sized pieces, has been frequently discussed in terms of equilibrium statistical mechanics, and its possible association with a phase transition [1, 2, 3]. However, ample uncertainty remains regarding its nature, in particular whether multifragmentation is a phase transition and if so whether it is associated with the liquid to vapor phase transition.
This paper will show that: 1) high quality experimental data contain the unequivocal signature of a liquid to vapor phase transition through their strict adherence to Fisher’s droplet model; 2) the two phase coexistence line is observed over a large energy/temperature interval extending up to and including the critical point; 3) several critical exponents, as well as the critical temperature, the surface energy coefficient and the compressibility factor can be directly extracted; 4) the nuclear phase diagram can be constructed with the available data; 5) the nuclear liquid at break-up is a slightly super-saturated vapor, for which the pressure and density can be determined as a function of the temperature.
In past attempts to investigate the relationship between nuclear multifragmentation and a liquid to vapor phase transition, critical exponents have been determined [1, 4, 5, 6, 7], caloric curves have been examined [8], and the observation of negative heat capacities have been reported [9]. Other studies of multifragmentation data have shown two general, empirical properties of the fragment multiplicities called reducibility and thermal scaling [3, 10, 11].
Reducibility refers to the observation that for each energy bin the fragment multiplicities are distributed according to a binomial or Poissonian law. As such, their multiplicity distributions can be reduced to a one-fragment production probability according to a binomial or Poissonian distribution.
Thermal scaling refers to the feature that the average fragment yield behaves with temperature as a Boltzmann factor: . Thus a plot of vs. , an Arrhenius plot, should be linear. The slope in such a plot is the one-fragment production “barrier”.
Both the features of reducibility and thermal scaling are inherent to any statistical model, in particular to the clusterization of droplets from a vapor as described by Fisher’s droplet model [12]. Thus it is interesting to see if a system portraying reducibility and thermal scaling portrays also the scaling of Fisher’s model [7, 13]. Fisher’s droplet model describes the aggregation of molecules into clusters in a vapor, thus accounting for its non-ideality. The abundance of a cluster of size is given by:
| (1) | |||||
| (2) |
where is the number of droplets (or fragments) of mass , normalized to the size of the system ; is a normalization constant depending only on the value of [14]; is the topological critical exponent; , and and are the actual and liquid chemical potentials respectively; is the surface free energy of a droplet of size ; is the zero temperature surface energy coefficient; is the critical exponent related to the ratio of the dimensionality of the surface to that of the volume; and is the control parameter, a measure of the distance from the critical point, .
Equation (1) shows clearly that thermal scaling is contained in this description. In particular, at coexistence (), Eq. (1) leads to a “barrier” .

Recently, gold multifragmentation data from the ISiS Collaboration was shown to exhibit reducibility and thermal scaling in the fragment production probabilities [15, 16]. Since this behavior is inherent to Fisher’s model, it is interesting to determine if Fisher’s model describes the ISiS data set. In order to find if this is the case, the ISiS charge yields from 8 GeV/c 197Au fragmentation data (see Fig 1a) were fit to Eq. (2).
The mass of a fragment (estimated by multiplying the measured fragment charge by the -to- ratio of the fragmenting system) was used as the cluster size in Eq. (2). The total number of fragments of a given size was normalized to the size of the fragmenting system thus . Here was used in lieu of , assuming the system behaves as a degenerate Fermi gas.
The parameters of Fisher’s model, e.g. , , and (in lieu of ) were used as fit parameters. The distance from equilibrium was parameterized by a polynomial of degree four in and the coefficients of that polynomial were used as fit parameters. The surface energy coefficient was parameterized by a polynomial of degree one and the coefficients of that polynomial were used as fit parameters. The level density parameter was absorbed into the fit parameters for and .
While analyses similar to this one have been performed on multifragmentation data in the past [17, 18, 19], those efforts dealt with inclusive data sets; data from every excitation energy were examined as a whole and the results were presented as a function of incident beam energy. This work makes use of the high statistics, exclusive data set of the ISiS Collaboration and bins the events in terms of reconstructed excitation energy [20]. In addition, explicit use of Fisher’s expressions for the bulk and surface energies allows and to be determined by the data.
Data for and for were included in the fit to Eq. (2) and the parameters were allowed to float to minimize . Fisher’s parameterization of the surface energy is invalid for , thus excitation energies greater than were not considered. Fisher’s model expresses the mass/energy of a fragment in terms of bulk and surface energies. This approximation is known to fail for the lightest of nuclei where structure details (shell effects) dominate the mass. For this reason and the fact that for the lightest fragments equilibrium and nonequilibrium production cannot be clearly differentiated, fragments with were not considered in the fit. Fragments with were not elementally resolved [21], and were also excluded.

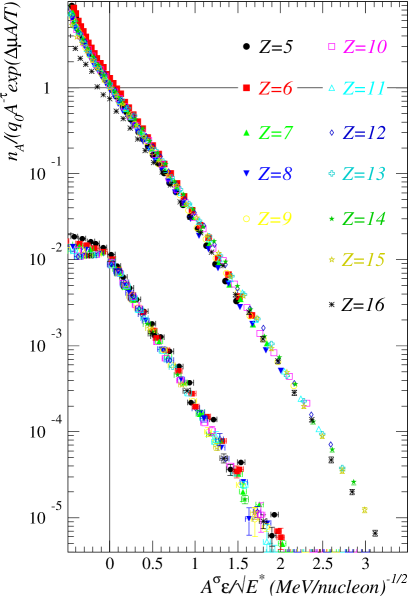
The behavior of the data for the surface is reproduced over a wide range in excitation energy and fragment charge. This is also shown in Fig. 1. In this figure the results of the analysis are presented in terms of Arrhenius plots (Fig. 1b), or of the fragment yield distribution plots (Fig. 1c). A powerful method to observe the results of this analysis directly is to scale the data according to Eq. (2) using the parameters resulting from the fitting procedure. Figure 2 shows such a result. The fragment mass yield distribution is scaled by the Fisher’s power law pre-factor and the bulk term: . This quantity is then plotted against the temperature scaled by Fisher’s parameterization of the surface energy: . The scaled data collapse over five orders of magnitude onto a single curve, which is precisely the behavior predicted by Fisher’s droplet model [12]. This curve is equivalent to a liquid-vapor coexistence line, as will be shown below, and provides the best, most direct evidence yet for a liquid to vapor phase transition in excited nuclei.
To illustrate the generality of this type of scaling, Fig. 2 also shows the scaled cluster distributions from a three-dimensional Ising model calculation [13]. This system is know to model liquid-vapor coexistence up to the critical temperature. The perfect scaling of the cluster yields according to Eq. (2) demonstrates liquid-vapor-like coexistence up to .
The value of extracted from this analysis, , is in the range predicted by Fisher’s model. Similarly, is close to the value expected for a three dimensional system, . The values of and and their energy dependence are shown in Fig. 3. The positive value of for indicates that the system behaves as a slightly super-saturated vapor. Values for and can be determined by making a choice of the level density parameter. For , MeV while gives MeV; both values are in the range of the value of the surface energy coefficient of the semi-empirical mass formula ( MeV), although the linear extrapolation all the way down to implied by Eq. (2) is questionable. The values of the critical exponents determined here are in agreement with those determined for the EOS multifragmentation data [6] and the value of the excitation energy at the critical point MeV/nucleon is in the neighborhood of the value observed in the EOS analysis ( MeV/nucleon) [6, 7, 22]. The EOS analysis relied on the assumption that . No such assumption was made in this work. In fact the present effort tests that assumption and finds it to be approximately valid below the critical point since the observed values are at most MeV (assuming ).
Using the value of determined here and a level density parameter of , the critical temperature can be estimated to be on the order of MeV, which is comparable to theoretical estimates for small nuclear systems [23, 24]. In most theoretical calculations the Coulomb force and small size of the system drastically reduces the value of . It is also well known that both and scale as a function of system size in many systems [25, 26].
The coexistence line and actual position of the fragmenting system in the pressure-density-temperature diagram can be determined from this analysis.
Fisher’s theory assumes that the non-ideal vapor can be approximated by an ideal gas of clusters. Accordingly, the quantity is proportional to the partial pressure of a fragment of mass and the total pressure due to all of the fragments is the sum of their partial pressures:
| (3) |
The reduced pressure is then given by:
| (4) |
This is a transformation of the information given in Fig. 3 onto a more familiar frame of reference.
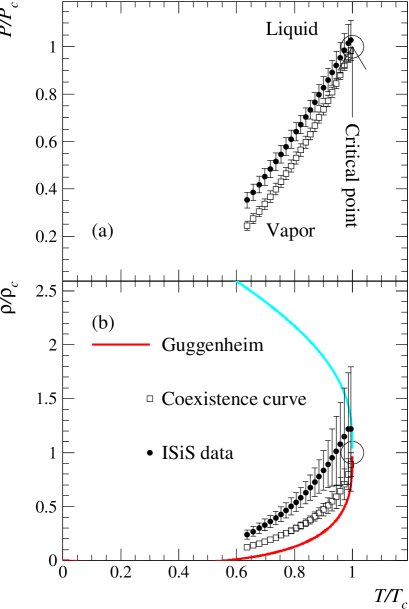
When values of corresponding to are used in these equations, the coexistence curve is obtained. In other words, this analysis provides simultaneously the coexistence line and the actual line. Both are shown in Fig 4a.
The system’s density can be found via
| (5) |
and the reduced density from
| (6) |
As before, both the actual curve and the coexistence curve can be determined. Both are shown in Fig. 4b together with the coexistence curve of Guggenheim [27].
The coexistence curve from the nuclear data does not agree closely with the Guggenheim plot over the full range of . This is not surprising given the complexity of the nuclear fluid compared to the simple fluids analyzed by Guggenheim. However, near , the universal behavior of the coexistence curve is recovered.
The compressibility factor is calculated by dividing the denominator of Eq. (4) by that of Eq. (6) and found to be . This value agrees with the value of the compressibility factor of many fluids [28].
In conclusion this paper has shown that the data of the ISiS Collaboration contain the unequivocal signature of a liquid to vapor phase transition via their strict adherence to Fisher’s droplet model. Through Fisher’s scaling of the fragment yield distribution (Fig. 2) the two phase coexistence line has been determined over a large energy/temperature interval extending up to and including the critical point. The critical exponents and as well as the approximate value of , the surface energy coefficient and the compressibility factor have been extracted and agree with accepted values. A portion of the nuclear phase diagram has been constructed with the available data. Finally, the nuclear liquid at break-up was observed to be a slightly super-saturated vapor for which and were determined as a function of .
The authors would like to thank Prof. Cathy Mader for her input and invaluable efforts with the Ising model calculations. This work was supported by the the US Department of Energy, National Science Foundation, the National Science and Engineering Research Council of Canada, the Polish State Committe for Scientific Reseach, Indiana Universtiy Office of Research, the University Graduate School, Simon Fraser University and the Robert A. Welch Foundation.
REFERENCES
- [1] J. E. Finn et al., Phys. Rev. Lett. 49, 1321 (1982).
- [2] P. J. Siemens, Nature 305, 410 (1983).
- [3] L. G. Moretto et al., Phys. Rep. 287, 249 (1997).
- [4] M. L. Gilkes et al., Phys. Rev. Lett. 73, 1590 (1994).
- [5] M. D’Agostino et al., Nucl. Phys. A 650, 328 (1999).
- [6] J. B. Elliott et al., Phys. Rev. C 62, 064603 (2000).
- [7] J. B. Elliott et al., Phys. Rev. Lett. 85, 1194 (2000).
- [8] J. Pochodzalla et al., Phys. Rev. Lett 75, 1040 (1995).
- [9] M. D’Agostino et al., Phys. Lett. B 473, 219 (2000).
- [10] L. Beaulieu et al., Phys. Rev. Lett. 81, 770 (1998).
- [11] L. G. Moretto et al., Phys. Rev. C 60, 031601 (1999).
- [12] M. E. Fisher, Physics 3, 255 (1967).
- [13] C. M. Mader et al, nucl-th/0103030 (2000).
- [14] H. Nakanishi and H. E. Stanley, Phys. Rev. B 22, 2466 (1980).
- [15] L. Beaulieu et al., Phys. Rev. Lett. 84, 5971 (2000).
- [16] L. Beaulieu et al., Phys. Rev. C 63, 031302 (2001).
- [17] A. S. Hirsch et al., Phys. Rev. C 29, 508 (1984).
- [18] A. L. Goodman et al., Phys. Rev. C 30, 851 (1984).
- [19] M. Mahi et al., Phys. Rev. Lett. 60, 1936 (1988).
- [20] T. Lefort et al., Phys. Rev. Lett 83, 4033 (1999).
- [21] K. Kwiatkowski et al., NIM A360, 571 (1995).
- [22] J. A. Hauger et al., Phys. Rev. C 57, 764 (1998)
- [23] H. R. Jaqaman et al., Phys. Rev. C 29 (1984).
- [24] P. Bonche et al., Nucl. Phys. A 436, 265 (1985).
- [25] N. B. Wilding, Phys. Rev. E 52, 602 (1995).
- [26] Y. G. Ma, nucl-th/0010063 (2000).
- [27] E. A. Guggenheim, J. Chem. Phys., 13, 253 (1945).
- [28] C. S. Kiang, Phys. Rev. Lett. 24, 47 (1970).