Antinucleus Production at RHIC
Abstract
Light antinuclei may be formed in relativistic heavy ion collisions via final state coalescence of antinucleons. The yields of antinuclei are sensitive to primordial antinucleon production, the volume of the system at kinetic freeze-out, and space-momentum correlations among antinucleons at freeze-out. We report here preliminary STAR results on and production in 130A GeV Au+Au collisions. These results are examined in a coalescence framework to elucidate the space-time structure of the antinucleon source.
1 Introduction
In nucleus-nucleus collisions at RHIC, a nearly baryon free environment with high energy density is created in the mid-rapidity region [1, 2]. These conditions are favorable for the production of light antinuclei. Production of light antinuclei is thought to be possible primarily via two mechanisms at RHIC energies. In the first mechanism, nucleus-antinucleus pairs are directly produced in high-energy nucleon-nucleon or partonic collisions. This mechanism, however, may not contribute to the final observed antinuclei since the small binding energies of the produced antinuclei make them extremely susceptible to break-up in the hot collision zone.
The second and probably dominant mechanism for production of light antinuclei is via final state-coalescence. In this picture, antinucleons of similar velocity and proximity bind during the late stages of the collision. In this model, the production rates for light antinuclei of antinucleon number can be related to the production rates for constituent antinucleons via a coalescence parameter that characterizes the likelihood of antinucleus formation:
| (1) |
In the limit where the size of the collision region is smaller than the intrinsic size of the produced antinucleus, the coalescence parameter is calculable from the antinuclear wave function [3]. In the limit of large systems, however, the coalescence parameter can be related to the size of the system. In general, the coalescence parameter is shown to scale as [4] where is the effective volume where the antinuclei are produced. Coalescence measurements are similar to HBT in that they give information about the space-time dynamics of the system at freeze-out.
2 Antinucleus measurements in STAR
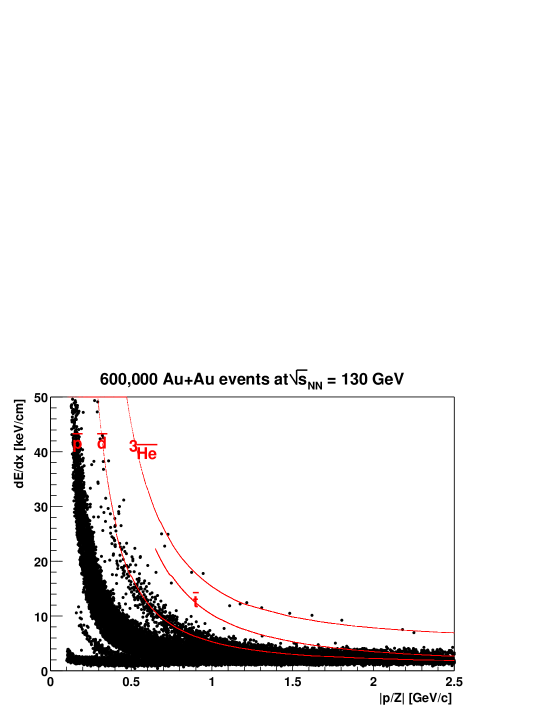
The STAR detector is well-suited for measurement and identification of relatively rare antinuclei. The main tracking detector is a large acceptance () Time Projection Chamber(TPC). We identify antinuclei via the ionization () in the TPC. Figure 1 shows the measured plotted against the magnetic rigidity () for negative tracks. Also shown are the expectations for , , and . The band is relatively pronounced, and there are 14 counts clustered around the prediction for . We observe no evidence of a band. Note that we plot here the rigidity, so the mean transverse momentum of the sample is 2.4 GeV/c. Under the assumption that and are produced in roughly equal numbers and with similar momentum distributions we would expect that most would be produced in the high rigidity region where they cannot be distinguished from more common particles given our resolution.
The raw yield is extracted as a function of rapidity () and transverse momentum () by fitting the measured distribution to an assumed signal+background form, where the background is from the tail of the distribution. In order to have high , we restrict ourselves to GeV/c and . Once we have obtained a raw yield, we apply an efficiency correction, calculated by embedding simulated tracks into real events. We also correct for absorption in the detector, where we parameterize the absorption in the detector using GEANT simulations and assume that [5]. After corrections, we extract invariant yields for the most central 10% collisions in two bins:
Comparing to SPS energies [6], we see a factor of increase in the invariant multiplicity.
For the measurement, statistics are insufficient to do a differential yield as a function of transverse momentum. Instead, we use all 14 counts to extract an invariant yield at the mean GeV/c. To do this, we calculate a cross-section weighted average efficiency over the STAR acceptance. We assume a flat rapidity distribution and an exponential spectra with GeV. The efficiency is calculated using embedded tracks in real events, and takes into account the absorption in the detector assuming [5]. To increase statistics, we use the top 20% most central events, and extract an invariant yield:
Alternatively, the large acceptance for allows us to extract a dN/dy. Assuming an exponential distribution and the calculated efficiency, we minimize a log-likelihood function with the total dN/dy as the free parameter. Using this procedure, we extract for the top 20% most central events . We have investigated the sensitivity of the extracted dN/dy to the assumed inverse slope parameter, and have found that the final dN/dy differs by less than 10% in the range GeV.
3 Coalescence Comparisons and Discussion
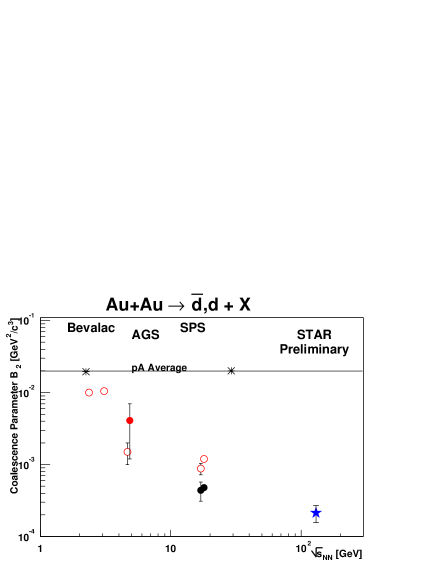
yields used for comparison and coalescence calculations were presented elsewhere [7]. We use the measured , , and yields to extract coalescence parameters using equation 1. The yield has been corrected for anti-hyperon feed-down using the Hijing event generator to estimate this contribution to the measured yield. For , we extract over the measured range GeV/c and . Figure 2 shows a comparison with previous measurements. Comparing to measurements in similar systems at lower energies we see that the coalescence parameter has dropped by more than a factor of two compared to measurements at SPS energies. Assuming , the antinucleon freeze-out volume increases by between SPS and RHIC energies.
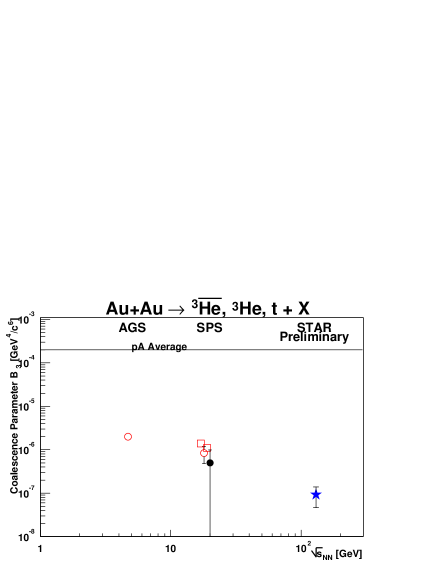
Combining the measurements of and gives . This is compared to measurements at lower energies in Figure 3. NA52 has a measurement of for antimatter in nucleus-nucleus, but they observed only 2 counts so the statistics are insufficient for comparison. Comparing the current results to the average of the measurements of antimatter and matter at SPS energies, a noticeable drop in the coalescence parameter is observed. Assuming , this corresponds to a % increase in the antinucleon freeze-out volume relative to the SPS. Within the rather large uncertainties, the increase in freeze-out volume measured using both and is consistent.
4 Conclusion
STAR has made the first measurements of light antinuclei at RHIC energies. We see a large increase in the antinucleus production rate compared to lower energy collisions. Examined in a coalescence framework, the measured yields indicate more than a factor of 2 increase in the antinucleon freeze-out volume relative to the SPS.
References
- [1] M. Calderon for the STAR Collaboration, these proceedings.
- [2] C. Adler, et al., Phys. Rev. Lett, in print.
- [3] S.T. Butler and C.A. Pearson, Phys. Rev. 129, 836 (1963).
- [4] H. Sato and K Yazaki, Phys. Lett. B 98, 153 (1981); A.Z. Mekjian, Phys. Rev. C 17, 1051 (1978); S. Das Gupta and A.Z. Mekjian, Phys. Rep. 72, 131 (1981); W.J. Llope, et al., Phys. Rev. C 52, 2004 (1995).
- [5] T.F. Hoang, Bruce Cork and H.J. Crawford, Z. Phys. C 29, 611 (1985).
- [6] I.G. Bearden, et al., NA44 Collaboration, Phys. Rev. Lett. 85, 2681 (2000).
- [7] J. Harris for the STAR collaboration, these proceedings.