Information on antiprotonic atoms and the nuclear periphery from the PS209 experiment
The PS209 experiment was run during two three-week periods in 1995 and 1996. The antiproton beam momenta were 412 MeV/c and 310 MeV/c in the first period and 106 MeV/c in the second one. A fraction of the beam time was used for the continuation of the radiochemical experiments aiming at the determination of the peripheral neutron to proton density ratio for 19 medium mass and heavy nuclei. The method, proposed by our collaboration some years ago [1], consists in the study of the annihilation residues with the mass number one unit smaller than the target mass . When both products (i.e. those with proton number and those with neutron number ) are radioactive, their relative yields after antiproton annihilation are easily determined by standard nuclear spectroscopy methods. They are directly related to the proton and neutron densities at the annihilation site. The radial distance of the most probable value of the annihilation site for events leading to products is obtained from calculations [2] as fm, almost independent of the atomic number of the target. If one assumes that the peripheral proton distributions of nuclei are now rather well determined using electromagnetically interacting probes, our experiment may be considered as a new way to evaluate the neutron distributions. In Ref. [3] the so-called halo factor was introduced as a measure for the neutron-over-proton density ratio. This halo factor transforms the measured yield of the to nuclei into the corresponding normalised (by factor) density ratio of neutrons to protons in the target nucleus at the radial distance of the annihilation site. In Refs. [4] and [5] the halo factor was presented as a function of the target neutron binding energy . A strong negative correlation was observed. For target nuclei with MeV clear evidence for a neutron rich periphery was obtained.
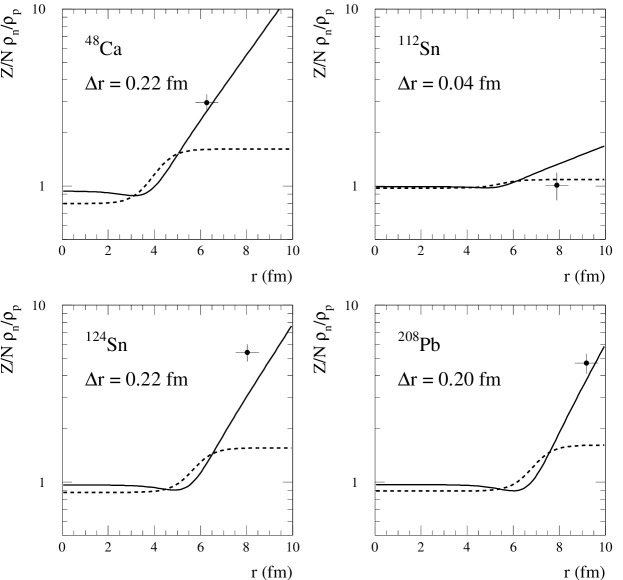
With the information on peripheral neutron densities from antiproton annihilation, one is tempted to compare them with experiments determining the difference between neutron and proton mean square radii. Care, however, is necessary, as the peripheral densities are probed by antiprotons at distances much larger than the root mean square radii. Keeping this limitation in mind, we nevertheless compared the neutron over proton densities for a number of nuclei in which recent [6, 7, 8] or older [9] data exist. Figure 1 gives the example for such a comparison. In preparing this figure the experimentally determined values were first used to obtain the neutron radius from the relation: where was taken from the recent tabulation [10] after correction for the proton charge radius. The same tabulation gives the two-parameter Fermi (2pF) charge distributions. These distributions were converted to point proton distributions [11]. The parameters for bare neutron distributions were obtained from the relation assuming either or . These two cases are shown in Fig. 1. As can be seen from this figure our radiochemical data are clearly in favour of interpreting the by the increase of the neutron surface diffuseness rather than the increase of the neutron half–density radius.
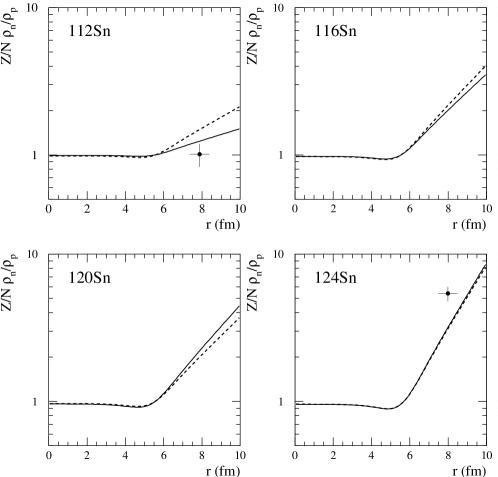
The ratios of neutron over proton density determined by the radiochemical method were also compared with the semiphenomenological approach of Gambhir and Patil [12]. Figure 2 compares the experimental density ratios with those deduced from the Gambhir prescription. The good overall agreement, together with the reasonable description of proton distributions (determined from electron scattering experiments) makes the Gambhir method attractive for predictions of peripheral neutron distributions for nuclei not yet measured.

| Z | A | lower level | ||||||
| (eV) | (eV) | (eV) | (eV) | |||||
| A | B | A | B | |||||
| 8 | 16O | 3,2 | 484(25) | 103(10) | ||||
| 20 | 40Ca | 5,4 | 5(12) | 0.059(18) | ||||
| 42Ca | 17(14) | 0.080(28) | ||||||
| 43Ca | 62(30) | 0.073(42) | ||||||
| 44Ca | 31(10) | 0.077(23) | ||||||
| 48Ca | 33(12) | 0.116(17) | ||||||
| 26 | 54Fe | 5,4 | 545(45) | 155(60) | 2.9(6) | |||
| 56Fe | 545(54) | 167(22) | 3.3(5) | |||||
| 57Fe | 638(35) | 164(25) | 3.7(4) | |||||
| 58Fe | 2017(203) | -115(115) | 4.1(10) | |||||
| 27 | 59Co | 1370(370) | 254(111) | 5.2(7) | ||||
| 28 | 58Ni | 5,4 | 910(150) | 150(40) | 4.6(10) | |||
| 60Ni | 1132(173) | 218(62) | 5.3(21) | |||||
| 62Ni | 1210(270) | 227(85) | 5.6(18) | |||||
| 64Ni | 1570(220) | 349(79) | 9.3(18) | |||||
| 40 | 90Zr | 6,5 | 1040(40) | 28(29) | 11.5(5) | |||
| 96Zr | 1260(60) | 169(49) | 15.0(17) | |||||
| 48 | 106Cd | 7,6 | 199(60) | -26(20) | 3.8(5) | |||
| 116Cd | 251(47) | -19(16) | 3.0(5) | |||||
| 50 | 112Sn | 7,6 | 387(17) | -5(11) | 4.2(6) | |||
| 116Sn | 382(20) | 23(13) | 4.9(9) | |||||
| 120Sn | 474(21) | 31(13) | 5.6(6) | |||||
| 124Sn | 512(19) | 43(11) | 6.1(7) | |||||
| 52 | 122Te | 7,6 | 619(59) | 51(28) | 7.5(10)∗∗ | -2(8) | -13(8) | |
| 124Te | 548(51) | 51(17) | 7.5(12)∗∗ | -4(5) | -16(5) | |||
| 126Te | 651(52) | 45(28) | 8.4(9)∗∗ | 5(7) | -9(7) | |||
| 128Te | 627(60) | 64(18) | 11.1(17)∗∗ | 15(4) | -8(4) | |||
| 130Te | 651(119) | 66(40) | 43.2(86)∗∗ | -67(4) | -11(4) | |||
| 70 | 172Yb | 8,7 | 997(63) | -422(60) | 202(60) | 31(2) | -9(42) | 134(42) |
| 176Yb | 1121(60) | -342(36) | 197(36) | 37(2) | 10(31) | 133(31) | ||
| 82 | 208Pb | 9,8 | 312(26) | 95(35) | 5.9(8) | 38(18) | ||
| 83 | 209Bi | 9,8 | 506(50) | -8(53) | 6.9(13) | -14(20) | ||
| 90 | 232Th | 9,8 | 1534(206)∗ | -1972(71)∗ | 42(72) | 50.8(72) | -507(30) | 74(30) |
| 92 | 238U | 9,8 | 2362(221)∗ | -2832(69)∗ | 335(79) | 68.1(61) | -872(16) | -56(20) |
| – level shift (positive value means repulsive level shift) | ||||||||
| A – measured, B – corrected for E2 resonance | ||||||||
| ∗ – only lower fine structure level was measured in these cases | ||||||||
| ∗∗ – not corrected for E2 resonance (see Ref. [15]) | ||||||||
Besides the radiochemical method antiprotons offer another, more classic way for investigating the nuclear periphery. The strong interaction level widths and shifts in the antiprotonic atoms depend on the antiproton-nucleus interaction potential which, in turn, exhibits a strong nuclear density dependence. During about 750 h of beam time 8.7 antiprotons were stopped in 55 natural or isotopically separated targets from to . At present the evaluated data consist of 45 level shifts, 29 ”lower” level widths and 33 ”upper” level widths, the latter obtained from the relative yields of X-rays. In addition, for targets with the fine structure components could in most cases be resolved. Table 1 gives the summary of the measured level widths and shifts (for the resolved levels average values are given).
As demonstrated by the calculation [2] the antiprotonic X-rays probe the nuclear periphery at distances about 1 fm closer to the nuclear centre than the radiochemical method described above. At present the consistency of both methods employed is intensively investigated. Figure 3 presents neutron to proton density ratio for deduced from the measured level widths and shifts. For and it is compared with the same quantity () deduced with the radiochemical method. In the former method it was again assumed that the proton [13] and neutron densities are given by 2pF distributions. The agreement between results of these two methods is not good. A similar discrepancy between the neutron to proton density ratio deduced from the radiochemical and X-ray experiment were observed in [14] and in nuclei [15].
This maybe caused by the 2pF distribution not being valid at large radii or the –nucleus potential used not being adapted for heavy, neutron rich nuclei. More elaborate considerations of the antiproton–nucleus interaction potential are presented during this conference [16].
On the other hand, the parameters of the nuclear matter distribution for obtained from the antiprotonic X-rays measurements give differences between neutron and proton root-mean-square radii which are in good agreement with values determined with other methods [6, 7]. This is seen in Fig. 3 where the neutron to proton density ratio deduced from measurements and determined from our antiprotonic X-ray data for four tin isotopes are shown.
This work was supported by KBN grants 2 P03B 048 15 and 2 P03B 119 16 and by the Deutsche Forschungsgemeinschaft, Bonn.
References
- [1] J. Jastrzȩbski, H. Daniel, T. von Egidy, A. Grabowska, Y.S. Kim, W. Kurcewicz, P. Lubiński, G. Riepe, W. Schmid, A. Stolarz, S. Wycech, Nucl. Phys. A558 (1993) 405c.
- [2] S. Wycech, J. Skalski, R. Smolańczuk, J. Dobaczewski, J.R. Rook, Phys. Rev. C 54 (1996) 1832 and S. Wycech private communication.
- [3] P. Lubiński, J. Jastrzȩbski, A. Grochulska, A. Stolarz, A. Trzcińska, W. Kurcewicz, F.J. Hartmann, W. Schmid, T. von Egidy, J. Skalski, R. Smolańczuk, S. Wycech, D. Hilscher, D. Polster, H. Rossner, Phys. Rev. Lett. 73 (1994) 3199.
- [4] P. Lubiński, J. Jastrzȩbski, A. Trzcińska, W. Kurcewicz, F.J. Hartmann, W. Schmid, T. von Egidy, R. Smolańczuk, S. Wycech, Phys. Rev. C57 (1998) 2962.
- [5] R. Schmidt, F.J. Hartmann, B. Ketzer, T. von Egidy, T. Czosnyka, J. Jastrzȩbski, M. Kisieliński, P. Lubiński, P. Napiorkowski, L. Pieńkowski, A. Trzcińska, B. Kłos, R. Smolańczuk, S. Wycech, W. Poschl, K. Gulda, W. Kurcewicz, E. Widmann, Phys. Rev. C60 (1999) 054309.
- [6] A. Krasznahorkay, A. Balanda, J.A. Bordewijk, S. Brandenburg, M.N. Harakeh, N. Kalantar-Nayestanaki, B.M. Nyako, J. Timar, A. Van der Woude, Nuc. Phys. A567 (1994) 521.
- [7] A. Krasznahorkay, M. Fujiwara, P. van Aarle, H. Akimune, I. Daito, H. Fujimura, Y. Fujita, M.N. Harakeh, T. Inomata, J. Janecke, S. Nakayama, A. Tamii, M. Tanaka, H. Toyokawa, W. Uijen, M. Yosoi, Phys. Rev. Lett. 82 (1999) 3216.
- [8] V. E. Starodubsky, N. M. Hintz, Phys. Rev. C 49 (1994) 2118.
- [9] C.J. Batty, E. Friedman, H.J. Gils, H. Rebel, in Advances in Nuclear Physics, edited by J.W. Negele and E. Vogt, Plenum Press, New York, Vol. 19 (1989) 1.
- [10] G. Fricke, C. Bernhardt, K. Heilig, L.A. Schaller, L. Schellenberg,E.B. Shera, C.W. De Jager, ADNDT 60(1995) 177.
- [11] E. Oset, P. Fernandez de Cordoba, L.L. Salcedo, R. Brockmanm, Phys. Rep. 188 (1990) 79.
- [12] Y.K. Gambhir, S.H. Patil, Z. Phys. A 324 (1986) 9.
- [13] H. de Vries, C.W. de Jager, C. de Vries, ADNDT 36 (1987) 495.
- [14] R. Schmidt, F.J. Hartmann, T. von Egidy, T. Czosnyka, J. Iwanicki, J. Jastrzȩbski, M. Kisieliński, P. Lubiński, P. Napiorkowski, L. Pieńkowski, A. Trzcińska, J. Kulpa, R. Smolańczuk, S. Wycech, B. Kłos, K. Gulda, W. Kurcewicz, E. Widmann, Phys. Rev. C58 (1998) 3195.
- [15] B. Kłos, PhD Thesis, Silesian University 2000, unpublished.
- [16] S. Wycech, Proceedings of LEAP2000 (this conference).
- [17] C.J. Batty, E. Friedman, A. Gal, Phys. Rep. 287 (1997) 386.